Mr Pip Scalping Indicator
- 지표
- 버전: 2.0
- 업데이트됨: 2 5월 2019
- 활성화: 7

Mr Pip Scalping Indicator
is a momentum indicator that measures the magnitude of recent price changes to evaluate overbought or oversold conditions in the price of a stock or other asset with few major tweaks. This is NOT RSI.
Features V2:
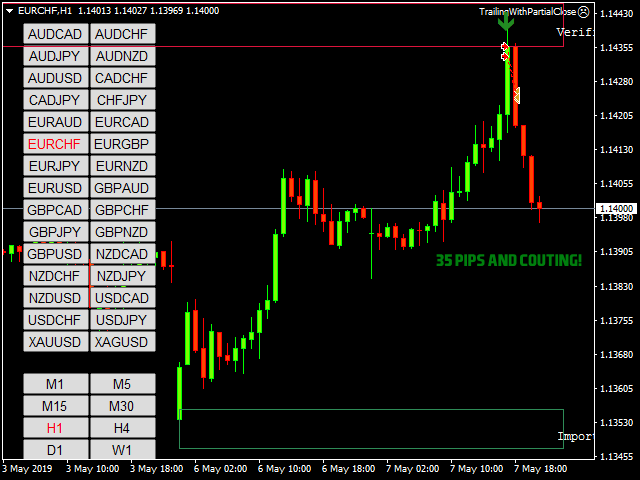
Added Supply/Demand Filter
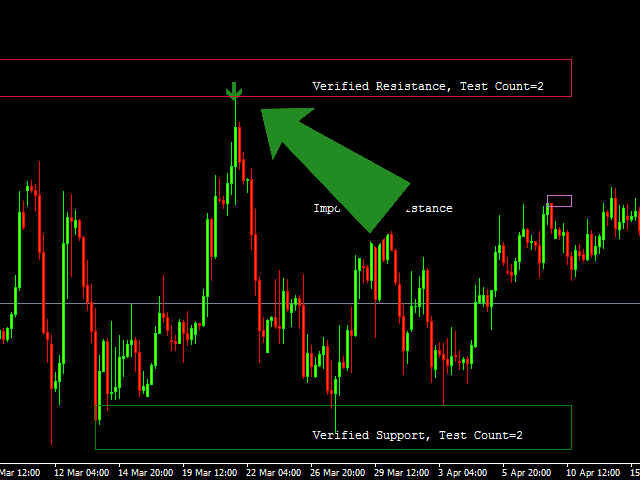
- You can select which zone to see on the chart ( Important Resistance/Support; Verified Resistance/Support; etc).
- You get alerts when prices is entering on a specific supply/demand zone.
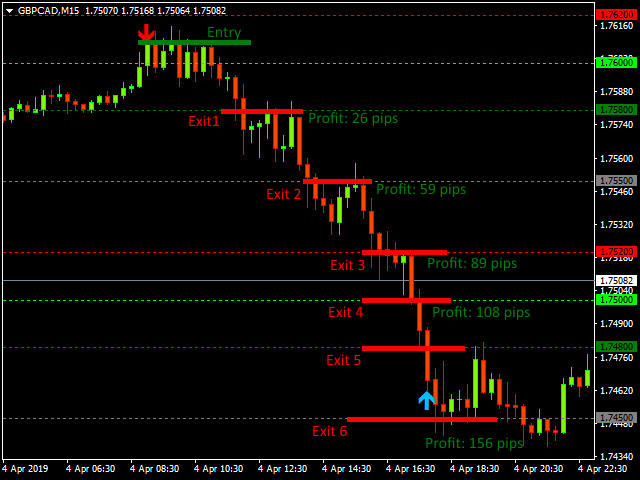
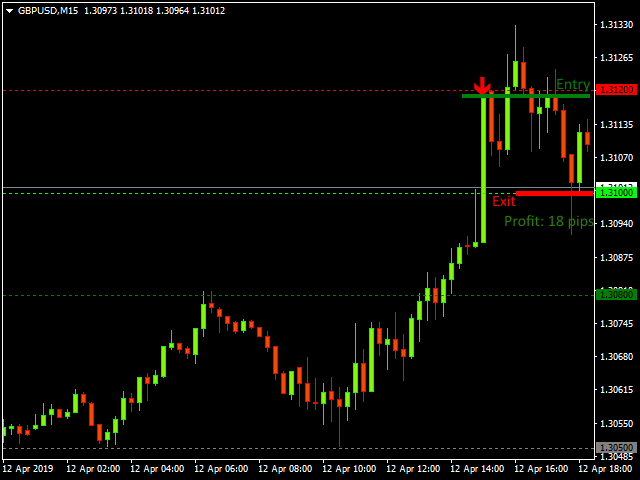
How to use?
When the signal comes, you will prepare.
At the end of the current candle you enter into the trade.
Can I take all the signals?
No, you must follow some simple rules.
What are the rules?
- Alert comes in and the current candle is rejected at strong supply/demand.
-
How to find the strong supply/demand zones?
- Look for a strong rally. Then without warning, the price suddenly reverses and drops FAST.
I recommend use of H4 zones.
- You enter at the opening of the next candle.
- DO NOT trade during news.
How to take only profitable signals?
- Use H1 or higher TFs. Greater the TF, higher the probability that the price will stop at that point.
- After you got a supply/demand wait for a signal to appear around that zone. If that candle is a rejection of the zone it's a good trade.