Market Reality

Hello,  As you know more than 90% of people in the financial markets are losers, the most important reason is the lack of a proper fixed system and risk management. I want to introduce you to an indicator that is the result of my 8 years of experience, which shows you the reality of the market. My human dignity does not allow me to guarantee the future, but the table below shows the past statistics of this indicator and its performance which really the market past is the only way to find out the efficiency of the system. If you don't know anything about analysis and the market, you can act according to the signals of this indicator.


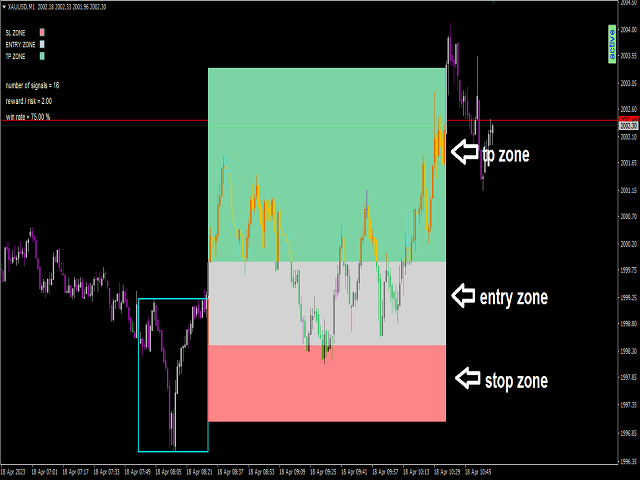
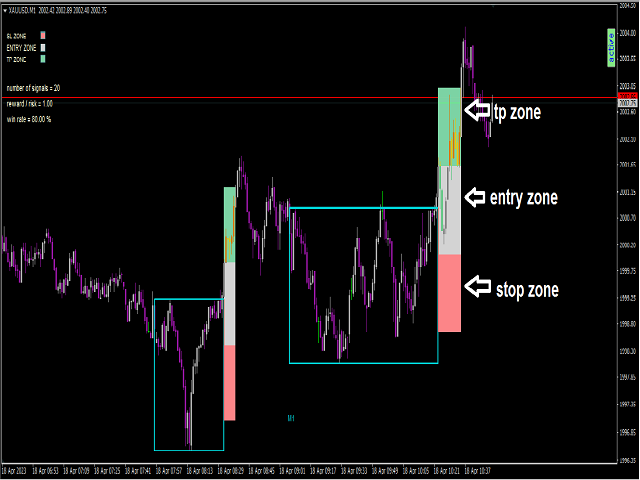
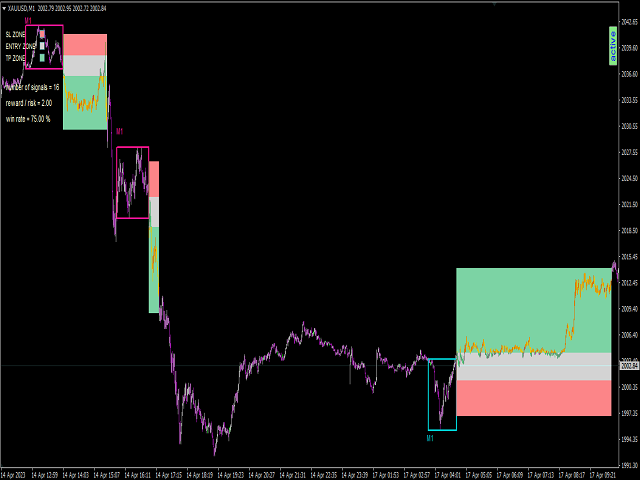
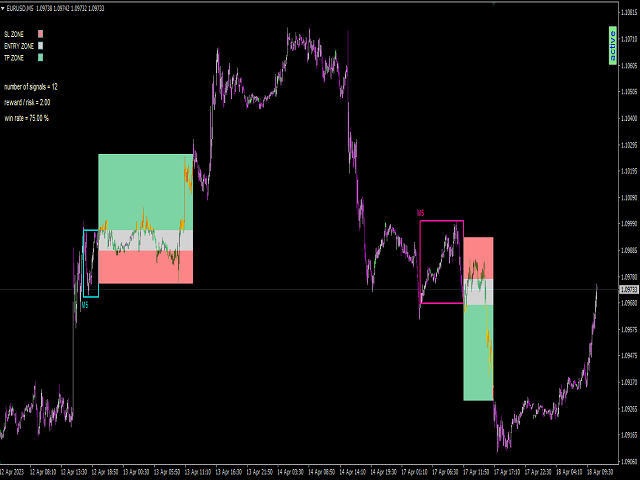
  The results of the 2000 previous signals - time frame M1 - Risk/Reward = 1

XAUUSD

Around 71%  win

EURUSD

Around  69% win

GBPUSD

Around  67% win

NZDUSD

Around  67% win

USDJPY

Around  66% win

GBPJPY

Around  66% win

EURJPY

Around  65% win


Recommendations:  

  1. currencies  XAUUSD - EURUSD - GBPUSD - NZDUSD - USDJPY - GBPJPY - EURJPY , but you can test all currencies.
  2. time farame : M1 but you can use other time frames.


  Settings:

  • Number of candles to calculate : X previous candles to calculate the indicator.
  • Active indicator :you can active or deactive this indicator. 

    First, click on the active green button on the chart and then from the input settings of the indicator:active indicator--->NO.


추천 제품
Mongol Indicator2
Sumiyabazar Buyanjargal
It's a variation of mid of HH and LL since it compares the higher of HH or LL against a period and twice the number of bars back to avoid whipsaws. I used to display this against lines on a chart, but made a histogram out of it and it looks interesting. It looks good at gauging trend strength and general turns (see image below). The name of the indicator is BAM, which is an acronym for "Below and Above Mid". Ways to use it: 1. To see general trend on longer TFs (more than 30 bars back).
Mr Pip Scalping Indicator is a momentum indicator that measures the magnitude of recent price changes to evaluate overbought or oversold conditions in the price of a stock or other asset with few major tweaks. This is NOT RSI. Features V2: Added Supply/Demand Filter You can select which zone to see on the chart ( Important Resistance/Support; Verified Resistance/Support; etc ).  You get alerts when prices is entering on a specific supply/demand zone. How to use? When the signal comes, you will
The Trend Professor is a moving average based indicator designed for the purpose of helping the community of traders to analyse the price trend. The indicator will be displayed in the main chart as it is indicated on the screenshot section. How it works The indicator has lines of moving averages and colored histograms to depict the direction of the trend. There will be a fast signal line colored blue/yellow/red at some points. The red/yellow colored lines stands for bearish trend/signal while th
Everyday trading represents a battle of buyers ("Bulls") pushing prices up and sellers ("Bears") pushing prices down. Depending on what party scores off, the day will end with a price that is higher or lower than that of the previous day. Intermediate results, first of all the highest and lowest price, allow to judge about how the battle was developing during the day. It is very important to be able to estimate the Bears Power balance since changes in this balance initially signalize about possi
Power Bears Rich
Pham Trong Khanh
Everyday trading represents a battle of buyers ("Bulls") pushing prices up and sellers ("Bears") pushing prices down. Depending on what party scores off, the day will end with a price that is higher or lower than that of the previous day. Intermediate results, first of all the highest and lowest price, allow to judge about how the battle was developing during the day. It is very important to be able to estimate the Bears Power balance since changes in this balance initially signalize about possi
Introduction This indicator detects volume spread patterns for buy and sell opportunity. The patterns include demand and supply patterns. You might use each pattern for trading. However, these patterns are best used to detect the demand zone (=accumulation area) and supply zone (=distribution area). Demand pattern indicates generally potential buying opportunity. Supply pattern indicates generally potential selling opportunity. These are the underlying patterns rather than direct price action. T
Online Accounts Manager MT4
Kyra Nickaline Watson-gordon
5 (1)
OneClick Online Account Manager is a powerful utility that helps you to manage all your accounts from a centralized panel. It is suitable for all single account traders and specially for multiple accounts traders. The utility help you to : Monitor status of all accounts on a private web page. Some information such as account connection status, account profit, DD, Balance, Equity, Margin Level, Number of positions and orders, Daily and Weekly profit/loss and also overall summation of all these p
GraphSeriesEA
Chukwudi Joshua Obiekwe
GraphSeriesEA : is more advanced system like BuySellSeriesEA, but difference is it doesn't keep positions,it closes all both buy/sell on exit;thereby giving you best equity curves ever.its doesn't have a scalper tough like buysellseriesEA, rather it close all position once it has reach a certain times and points; check base on the positions situations on the chart trend short or long wave. is very sophisticated robust forex EA with an outstanding performance .major characteristics of this EA are
Hello Guys! I want to share with you a very useful tools. Anyone of us who has used MT4 for some time knows how impractical this platform can be for discretionary trading. That's why I created this graphical interface!  Interface is very simple, all the info that you need are in the video and in the screenshot. NB: Before to run the EA Interface, remember to copy the file in the comment in your MT4 folder "Controls". PATH: .../MQL4/INCLUDE/CONTROLS NB: unfortunately the interface can't be test
Trend Analysis in act
Ihab Mohamed Kamal Fouda
The Trend Analysis Indicator is an innovative tool designed for traders and investors who seek to navigate the complexities of the financial markets with greater precision and insight. This powerful indicator is engineered to adeptly identify whether a market is trending or not, offering users a vital edge in their trading strategy. Key Features: Accurate Trend Detection : The core functionality of the Trend Analysis Indicator lies in its ability to accurately detect market trends. It analyzes p
A technical indicator that displays information about the trading volume in the form of a histogram of distribution by price levels. It is used as an independent indicator that helps to evaluate the current objective situation of the instrument, as well as in the format of integration with other methods of analysis, to confirm or filter when making trading decisions. Key Features: Interactive profile update, real-time work Five modes of histogram calculation The possibility of separating the vol
InfinityBreak v3.0 – 더 똑똑하게 거래하세요! 자동화된 거래의 최신 혁신으로 시장을 제어하세요. InfinityBreak v3.0은 주요 브레이크아웃을 자동으로 감지하고, TP, SL, 부분 TP 및 로트 크기를 관리하여 XAU/USD를 전문가처럼 거래할 수 있도록 도와줍니다. M1 타임프레임 최적화 – 빠르고 정확하며 신뢰할 수 있음. 스마트 리스크 관리 – 마틴게일 없음, 위험 전략 없음. 초보자~중급자 친화적 – 완전 자동, 간단하면서도 강력함. 스트레스 없이, 지속적으로 모니터링하지 않고 시장 브레이크아웃을 거래 기회로 바꾸세요.   MT5 Version:  Infinity Gold Break 3 | Buy Trading Robot (Expert Advisor) for MetaTrader 5     Infinity EAs Channel:  Private Messages - Evan Pierre Clement - KurukoPro
Hydra Trend Rider
INTRAQUOTES
5 (4)
Hydra Trend Rider is a non-repainting, multi-timeframe trend indicator that delivers precise buy/sell signals and real-time alerts for high-probability trade setups. With its color-coded trend line, customizable dashboard, and mobile notifications, it's perfect for traders seeking clarity, confidence, and consistency in trend trading. Setup & Guide:  Download  MT5 Version here. To learn how to use the Indicator: Indicator Manual & Guide -   Read Here Exclusively for you: It's your chance to st
on demo mode, use date for testing. for people purchase thise indicator, there is bonus ,price chanell and timing indicator  and tma  control periot and .complate trading system high low levels indicator is non repaint trend reversal indicator.and works all pairs and all timeframes. there is a histogram move up and down. and there is a level red and blue. when histogram reach the up red level that is top.and reversal is possible. when histogram down and reach blue level that is prices oversold a
The advantages of EA TWO CANDLE SMART are: It is equipped with various filters, including: maxspread, maxlot, takeprofit (4 step), stop loss (3 step), profit target per day, and many more. Open order BUY = If iClose[2] > iOpen[2] && iClose[1] > iOpen[1]. Open order SELL = If iClose[2] < iOpen[2] && iClose[1] < iOpen[1]. Target_profit_perday=50; ==> can work on forward test. lockprofit=2;//Minimal Profit in money Step_LockProfit_in_Money=25; Stoploss_in_Money=1000; Stoploss_in %=50;==> Stoploss
Binary Smart Eye
Ramzi Abuwarda
"Binary Smart Eye" MT4 지표는 바이너리 옵션 및 외환 시장 모두에 거래 신호를 제공하도록 설계되었으며, M1에서 W1까지 광범위한 시간 프레임에서 작동합니다. 추세 수준, 지능형 이동 평균 및 최적화된 거래 기간을 결합한 독점적인 전략을 사용하여 잠재적인 진입점을 식별합니다. 주요 기능에 대한 분석은 다음과 같습니다. 다중 시간 프레임 분석: 지표의 다용도성은 트레이더가 다양한 시간 프레임에서 이를 활용하여 M1의 스캘핑부터 W1의 장기 추세 추종까지 다양한 거래 스타일에 맞출 수 있도록 합니다. 독점 전략: "Binary Smart Eye"의 핵심은 다음을 활용하는 고유한 전략에 있습니다. 추세 수준: 이러한 수준은 주요 시장 추세 및 잠재적인 반전 지점을 식별하는 데 도움이 됩니다. 지능형 이동 평균: 시장 변동성에 적응하고 정확한 추세 방향을 제공하는 사용자 정의 이동 평균입니다. 스마트 거래 기간: 지표는 최적의 시장 조건을 포착하기 위해 특정 시간 기간을
Dear Trader It is my pleasure to introduce to you my tool called the " Forex Sniper Indicator" . The major aim of this tool is to help serious traders and investors in all type of Financial Markets to catch price next movement right at the moment the price direction is about to change. This tool can be used to snipe the price direction in both down trend, uptrend and ranging markets. This tool can be used as the stand alone tool though it may be combined with other tools as well. My goal is to h
This is the FXTraderariel PowerTrend . It compute a trendfollowing system based on it own algorithm. It gives you a buy or sell signal based on the trend. It based on the Supertrend, but our Version is not repainting. Furthermoore we added some Improvements and you can get an Arrow, Push or Alert when the trend changes. Depending on the settings it and trading style, it can be used for scalping or long-term trading . The indicator can be used on every time frame , but we advise to use it on H1
Snake NW
Sergei Shishaev
5 (1)
Канальный индикатор "Snake" . Отлично показывает точки входа и выхода. Не перерисовывает! Хорошо подойдет для стратегий с сетками (усреднения), стратегий с пирамидами (стратегий добора), обычной торговли по тренду, торговли на коррекции. Для любых типов инструментов:   валюты, нефть, металлы, криптовалюты. Для любых таймфреймов:   от M1 до D1 . Для любых стилей торговли:   скальпинг, интрадэй, свинг, долгосрок . Используйте в сочетании с трендовым индикатором, чтобы исключить риски входа про
Trend Sim
Ivan Simonika
This is a professional Trend Sim indicator. The intelligent algorithm of the Trend Sim indicator accurately detects the trend, filters out market noise and generates input signals and exit levels. Functions with advanced statistical calculation rules improve the overall performance of this indicator. The indicator displays signals in a simple and accessible form in the form of arrows (when to buy and when to sell). Knowing the entry point of each of the currencies is very important for every f
Trend Colored Average
Teresinha Moraes Correia
Using colors that reflect the prevailing market direction, the indicator is designed to show when the current trend is still dominant. This helps to filter out potential market noise and guides the trader to avoid false signals. By clearly visualizing trend strength and consistency, the tool assists in identifying higher-probability trade setups. It enhances precision by allowing traders to focus on movements that align with the broader market context. As a result, decision-making becomes more
The Ultimate Drawdown Recovery & Trade Protection EA for MT4! Your Trades Deserve a Second Chance. Give Them This Soldier. Struggling with floating losses or sudden drawdowns that threaten your account? Stop watching your trades drown in red and let the Ultimate Drawdown Recovery EA (UDR) recover, protect, and empower your trading strategy automatically. What Is UDR? UDR is an ultra-smart, lightning-fast MT4 Expert Advisor designed to recover drawdowns, secure break-even exits, manage trades wi
Aureus Quantum Surge
Ren Cheng Yao
5 (1)
Aureus Quantum Surge-H1: 금 자동 거래의 잠재력 확보 Limited Time Offer: Special Offer: Current Price $799 (Limited Time)! Next price: $899 실제 계정 신호: https://www.mql5.com/en/signals/2297864?source=Site+ 소개 + 판매자 개요 Aureus Quantum Surge-H1은 H1 기간 동안 XAUUSD(금)를 거래하도록 설계된 최첨단 전문가 컨설턴트입니다.이는 여러가지 기술지표와 안정적인 위험관리기술을 결합시켜 파동하는 황금시장에서 일치한 표현을 제공한다.​ 주요 특징 고급 다중 지표 전략: Ichimoku Cloud, MACD, ATR, 브린 벨트 및 LWMA의 복잡한 조합을 사용하여 높은 확률의 거래 기회를 식별합니다.​ 맞춤형 위험 관리: 보안 시스템: 옵션 정책, 조정 가능한 대량 배율 및 재설정 조건이 있어 위험을 효과적으로 통
Canadian Taiga
Charbel Abboud
CANADIAN TAIGA is a professional portfolio EA using trend-following trading system based on principles of volatility breakout and breakouts of support/ resistance levels. It works on all Canadian Dollar pairs. The core principle of the Canadian Taiga is to capture trading opportunities on all CAD pairs, using a sophisticated hedging module. Download CANADIAN TAIGA and test it on all Canadian Dollar Pairs as recommended, and if it does not what it is intended to do as described, do not purchase i
Breakout Monster Expert Advisor
Abdulfattah Yahya Mohammed Alhazmi
For The English Manual you can contact me. The Most advanced and comprehensive EA to trade Trend Breakout The “Breakout Monster EA” trades breakouts when the current price of the currency pair breaks a predefined horizontal level or trendline on the currency pair's chart. The opening of the position can be immediate after breaking the drawn trendline OR after closing the candle above/below this trend, provided that all technical and non-technical filters, defined by the trader through the exp
Work Stations
Maryna Shulzhenko
Forex Workstation   is a powerful and efficient Forex trading bot designed to use patterns, price hold levels, volatility analysis and market scaling. This bot offers unique capabilities for automated trading and optimization of strategies on various currency pairs. Let's look at the main functions and settings of Forex Workstation: Main functions: • Multicurrency: Forex Workstation supports a wide range of currency pairs, which allows you to diversify your portfolio and distribute risks. • Usin
This Robot Ea with indicators ADX. ONLY 1 COPIES OUT OF 5 LEFT AT $ 99! After that, the price will be raised to $ 199. LIVE SIGNAL and EA STRATEGY ⤵⤵⤵ https://www.mql5.com/en/users/supomo/seller#products    PARAMETER SETTING EA ⤵⤵⤵ https://www.mql5.com/en/blogs/post/744860 SETTING EA ADX VERSION: ++>, Setting_ADX VERSION= "------- ( Setting Strategy ADX ) -------";         >>period_ADX=28; ++>, EA_Indicators=1. ADX VERSION ++>,  Setting Martingale="------- ( MARTINGALE [open 1=disable] ) --
PTW NON REPAINT TRADING SYSTEM + HISTOGRAM Non-Repainting ,   Non-Redrawing   and   Non-Lagging  Trading System. Does the following: - Gives Accurate Entry and Exit Points - Scalping, Day and Swing Trading  - 95% Accuracy  - Targets, where to take profits. - Shows Trends, Support and resistance levels - Works on All Brokers - Works on All Currencies, CFDs and Stocks - It does not place trades for you, it only shows you what trades to place. - It works on All Timeframes - It is for Trend or ran
Algo v3 ea robot
Sharif Khatib Said
1 (1)
ALGO V3 EA is developed with over a year of intense research and testing. This expert advisor employs multi-timeframe volatility measurements, analyses intentions of market participants and anticipate price movements before they occur with help candlestick patterns, and supply & demand analysis for accurate entries that are highly reactive to market price movements of Gold, breaking out at critical price levels. Gold Mana is proven to be resilient for more than 3 years with stable trading throug
이 제품의 구매자들이 또한 구매함
Pulse Scalping Line - an indicator for identifying potential pivot points. Based on this indicator, you can build an effective Martingale system. According to our statistics, the indicator gives a maximum of 4 erroneous pivot points in a series. On average, these are 2 pivot points. That is, the indicator shows a reversal, it is erroneous. This means that the second signal of the indicator will be highly accurate. Based on this information, you can build a trading system based on the Martingale
Miraculous Indicator – Gann Square of Nine 기반 100% 비리페인트 Forex 및 바이너리 도구 이 영상은 Miraculous Indicator 를 소개합니다. 이 지표는 Forex 및 바이너리 옵션 트레이더를 위해 특별히 개발된 매우 정확하고 강력한 트레이딩 도구입니다. 이 지표가 독특한 이유는 전설적인 **Gann Square of Nine(Gann 9의 사각형)**과 **Gann's Law of Vibration(Gann 진동의 법칙)**에 기반을 두고 있기 때문입니다. 이는 현대 트레이딩에서 가장 정밀한 예측 도구 중 하나로 손꼽힙니다. Miraculous Indicator는 완전히 비리페인트(non-repaint) 됩니다. 즉, 캔들이 마감된 후에도 신호가 변경되거나 사라지지 않습니다. 보이는 것이 곧 결과입니다. 이는 트레이더가 자신감을 가지고 거래에 진입하고 청산할 수 있는 신뢰할 수 있고 일관된 기반을 제공합니다. 주요 특징: Gann
BinaryIndicator
Andrey Spiridonov
BinaryIndicator is a highly accurate indicator for trading binary options. It shows excellent results in scalping. This indicator is based in multifactor analysis of trend indicators, as well as confirmation oscillators, which in the end gives an increased accuracy of signals. Advantages of the indicator Increased accuracy of signals. Excellent results when trading binary options with a short expiration time from M30 to M1 . It works on any timeframes. Works with any trade symbols. Parameters
Rtc ML Ai Predictor MT4
Muhammad Faisal Sagala
Rtc ML Ai | Predictor CORE MACHINE LEARNING ENGINE Adaptive ML Market Predictor – Multi-Bar Trend & Candle Forecast What This Indicator Does This indicator is a  real-time market prediction engine  designed to analyze price behavior and estimate  future market tendencies . Unlike conventional indicators, this system  does not rely on static parameters or historical curve-fitting , but adapts its internal state dynamically during live market operation. Instead of using static rules, the indic
FFx Engulfing Setup Alerter gives trade suggestions with Entry, Target 1, Target 2 and StopLoss. Below are the different options available: Entry suggestion - pips to be added over the break for the entry 3 different options to calculate the SL - by pips, by ATR multiplier or at the pattern High/Low 3 different options to calculate the 2 TPs - by pips, by ATR multiplier or at Risk/Reward Offset the dashboard - any place on the chart Remove the suggestion once the price reached the SL line Lines
FFx InsideBar Setup Alerter gives trade suggestions with Entry, Target 1, Target 2 and StopLoss. Below are the different options available: Entry suggestion - pips to be added over the break for the entry Minimum candle size - to avoid too close buy/sell entry suggestions 3 different options to calculate the SL - by pips, by ATR multiplier or at the pattern High/Low 3 different options to calculate the 2 TPs - by pips, by ATR multiplier or at Risk/Reward Offset the dashboard - any place on the c
FFx OutsideBar Setup Alerter gives trade suggestions with Entry, Target 1, Target 2 and StopLoss. Below are the different options available: Entry suggestion - pips to be added over the break for the entry. 3 different options to calculate the SL - by pips, by ATR multiplier or at the pattern High/Low. 3 different options to calculate the 2 TPs - by pips, by ATR multiplier or at Risk/Reward. Offset the dashboard - any place on the chart. Remove the suggestion once the price reached the SL line.
FFx PinBar Setup Alerter gives trade suggestions with Entry, Target 1, Target 2 and StopLoss. Below are the different options available: Entry suggestion - pips to be added over the break for the entry Minimum candle size - to avoid too small candles 3 different options to calculate the SL - by pips, by ATR multiplier or at the pattern High/Low 3 different options to calculate the 2 TPs - by pips, by ATR multiplier or at Risk/Reward Offset the dashboard - any place on the chart Remove the sugges
FFx MACD Divergences
Eric Venturi-Bloxs
The purpose of this new version of the MT4 standard indicator provided in your platform is to display in a sub-window multiple timeframes of the same indicator with its divergences. See the example shown in the picture below. But the display isn't like a simple MTF indicator. This is the real display of the indicator on its timeframe. Here's the options available in the FFx divergences indicator: Select the timeframes to be displayed (M1 to Monthly) Define the width (number of bars) for each tim
FFx RSI Divergences
Eric Venturi-Bloxs
The purpose of this new version of the MT4 standard indicator provided in your platform is to display in a sub-window multiple timeframes of the same indicator with its divergences. See the example shown in the picture below. But the display isn't like a simple MTF indicator. This is the real display of the indicator on its timeframe. Here's the options available in the FFx divergences indicator: Select the timeframes to be displayed (M1 to Monthly) Define the width (number of bars) for each tim
FFx CCI Divergences
Eric Venturi-Bloxs
The purpose of this new version of the MT4 standard indicator provided in your platform is to display in a sub-window multiple timeframes of the same indicator with its divergences. See the example shown in the picture below. But the display isn't like a simple MTF indicator. This is the real display of the indicator on its timeframe. Here's the options available in the FFx divergences indicator: Select the timeframes to be displayed (M1 to Monthly). Define the width (number of bars) for each ti
The FFx Dashboard MTF alerter will show you on a single chart all the timeframes (M1 to Monthly) with their own status for the indicator. 2 Alert Options: Single timeframe: each selected timeframe alert separately when a signal occurs Multi timeframes: all selected timeframes must agree for an alert to be triggered Both options have an input to select the timeframes to be used for the alert(s). How to Understand the Status: Green/Red square: histogram above/below 0 line Green square + Red bord
The FFx Dashboard MTF alerter will show you on a single chart all the timeframes (M1 to Monthly) with their own status for the indicator. 2 Alert Options: Single timeframe: each selected timeframe alert separately when a signal occurs Multi timeframes: all selected timeframes must agree for an alert to be triggered Both options have an input to select the timeframes to be used for the alert(s). How to understand the status: Green/Red square: RSI above/below 50 line Green square + Red border: R
The FFx Dashboard MTF alerter will show you on a single chart all the timeframes (M1 to Monthly) with their own status for the indicator. 2 Alert Options: Single timeframe: each selected timeframe alert separately when a signal occurs Multi timeframes: all selected timeframes must agree for an alert to be triggered Both options have an input to select the timeframes to be used for the alert(s). How to understand the status: Green/Red square: Stoch above/below 50 line Green square + Red border:
The FFx Dashboard MTF alerter will show you on a single chart all the timeframes (M1 to Monthly) with their own status for the indicator. 2 Alert Options: Single timeframe: each selected timeframe alert separately when a signal occurs Multi timeframes: all selected timeframes must agree for an alert to be triggered Both options have an input to select the timeframes to be used for the alert(s). How to understand the status: Green/Red square: Price above/below Cloud (Kumo) Green square + Red bo
The FFx Dashboard MTF alerter will show you on a single chart all the timeframes (M1 to Monthly) with their own status for the indicator. 2 Alert Options: Single timeframe: each selected timeframe alert separately when a signal occurs Multi timeframes: all selected timeframes must agree for an alert to be triggered Both options have an input to select the timeframes to be used for the alert(s). How to understand the status: Green/Red square: MA pointing Up/Down Green square + Red border: MA po
The FFx Dashboard MTF alerter will show you on a single chart all the timeframes (M1 to Monthly) with their own status for the indicator. 2 Alert Options: Single timeframe: each selected timeframe alert separately when a signal occurs. Multi timeframes: all selected timeframes must agree for an alert to be triggered. Both options have an input to select the timeframes to be used for the alert(s). How to understand the status: Green square: Price above PSAR Red square: Price below PSAR Options
The FFx Dashboard MTF alerter will show you on a single chart all the timeframes (M1 to Monthly) with their own status for the indicator. 2 Alert Options: Single timeframe: each selected timeframe alert separately when a signal occurs Multi timeframes: all selected timeframes must agree for an alert to be triggered Both options have an input to select the timeframes to be used for the alert(s). How to understand the status: Green/Red square: CCI above/below levels (ie. 100/-100) Grey square: C
The FFx Dashboard MTF alerter will show you on a single chart all the timeframes (M1 to Monthly) with their own status for the indicator. 2 Alert Options: Single timeframe: each selected timeframe alert separately when a signal occurs Multi timeframes: all selected timeframes must agree for an alert to be triggered Both options have an input to select the timeframes to be used for the alert(s). How to understand the status: Green/Red square: ADX above level Grey square: ADX below level Red bor
The FFx Dashboard MTF alerter will show you on a single chart all the timeframes (M1 to Monthly) with their own status. 2 Alert Options: Single timeframe: each selected timeframe alert separately when a signal occurs Multi timeframes: all selected timeframes must agree for an alert to be triggered Both options have an input to select the timeframes to be used for the alert(s). How to understand the status: Green/Red square: bullish/bearish candle Options available in the FFx Dashboard Alerter
THE GRAFF III
Antonin Skaryd
The [GRAFF] III manual trading system is based on multiple MetaTrader (MT4) indicators. Together, the entire PACK of GRAFF III indicators makes an advanced trading tool. The system consists of over 20 different custom-built indicators which have been carefully selected and tested in the long term to produce strong and efficient trading signals. The particular indicators are based on different mathematical formulas, so the entire system is calibrated to remove false signals from its own indicator
FFx Universal Strength Meter PRO is more than a basic strength meter. Instead of limiting the calculation to price, it can be based on any of the 19 integrated strength modes + 9 timeframes. With the FFx USM, you are able to define any period for any combination of timeframes. For example, you can set the dashboard for the last 10 candles for M15-H1-H4… Full flexibility! Very easy to interpret... It gives a great idea about which currency is weak and which is strong, so you can find the best pai
Pan PrizMA CD Phase is an analogue of the МetaТrader 5 indicator , and is an option based on the Pan PrizMA indicator. Details . Averaging by a quadric-quartic polynomial increases the smoothness of lines, adds momentum and rhythm. Extrapolation by the sinusoid function near a constant allows adjusting the delay or lead of signals. The value of the phase - wave status parameter (which is close in meaning to the trigonometric phase or the angle of the radius-vector rotation in the trigonometric p
Green Wall Arrows
Daniel Luchinger
1 (1)
The Name Green Wall : Arrows hits a lot of TP, by changing the idea of non using SL as something bad, but instead use Small TP and a lot of free Margin and Patience. Use micro TP and a lot of Free Margin with this indicator on Forex. It also can be used with Binary Options. This strategy is intended to be traded Manually. This Indicator runs on Open Bar, arrows will delete when price are against it. The only Indicator Parameter is Alerts true/false, all the rest is included inside the code. Arro
Golden Monowave
Ahmed Mohamed Ali
Golden Monowave is monowave indicator, the monowave theory is one of Elliott wave approach and one of most complicate and accurate method. Golden Monowave can shortcut many major steps to identify and describe the monowave. It works on any timeframe and with any trading instrument, including currencies, indices, futures, etc. Input Parameters initial_Bars - set the initial number of bars to calculate. wave_color - select the color of the wave. label_color - select the color of labels. temp_labe
Ticks Size
Viktor Kolmakov
This indicator displays in a separate window the difference between the number of points which increased the price, and the number of points that decreased the price during the time interval specified in the settings. The time interval for calculation is expressed as the number of bars of the chart the indicator is attached to. This approach allows you to evaluate the movement direction (growth or fall) of the instrument's price, the strength of the movement and the size of the movement in point
FFx Basket Scanner
Eric Venturi-Bloxs
MetaTrader 5 version available here : https://www.mql5.com/en/market/product/24882 FFx Basket Scanner is a global tool scanning all pairs and all timeframes over up to five indicators among the 16 available. You will clearly see which currencies to avoid trading and which ones to focus on. Once a currency goes into an extreme zone (e.g. 20/80%), you can trade the whole basket with great confidence. Another way to use it is to look at two currencies (weak vs strong) to find the best single pairs
Gets
Andrey Kozak
Gets is a smart trading system with complex market analysis mechanism. The operation principle of Gets is based on neural networks and diversified collection of information from various market analyzers. Then the system analyzes the statistical databases to create a general idea of the current market situation and the further price movement. The information is displayed on the screen in a simple and intuitive way - in the form of buy and sell arrows. Also, the information on the current trend st
제작자의 제품 더 보기
Night scalper bot
Soghra Dejampisheh
Night scalper bot   is a fully automated trading system that trades on the most popular currency pairs at night. there are a lot of advantages at night trading, one of the most important ones is when you are resting your account is active.               Recommendations:                                         All these currencies should be run   :  USDCHF-EURGBP-USDCAD-AUDCHF-EURCHF-AUDUSD-GBPAUD-EURAUD-EURCAD-NZDCHF-GBPCAD-CADCHF-GBPUSD-NZDUSD-NZDCAD-EURUSD-GBPCHF-AUDCAD. Timeframe is M5 .  V
필터:
Junaid Munawar
1062
Junaid Munawar 2023.04.26 12:05 
 

사용자가 평가에 대한 코멘트를 남기지 않았습니다

Soghra Dejampisheh
4816
개발자의 답변 Soghra Dejampisheh 2023.04.26 12:15
Thank you for your positive review and I hope the indicator is profitable for you.
리뷰 답변