CurrencyMeter Pro

# CurrencyMeter Pro - Professional Multi-Market Strength Analyzer

## Overview

CurrencyMeter Pro is a powerful real-time momentum analyzer that tracks the strength of currencies, cryptocurrencies, indices, metals, and energy markets at a glance. Make smarter trading decisions by instantly identifying the strongest and weakest instruments across multiple asset classes.

Whether you're a forex trader looking to pair strong currencies against weak ones, or a multi-asset trader seeking momentum confirmation, CurrencyMeter Pro gives you the edge you need.

---

## Key Features

### Real-Time Momentum Analysis
- Calculates momentum on every tick using adaptive rolling min/max normalization
- Built-in EMA smoothing eliminates noise and false signals
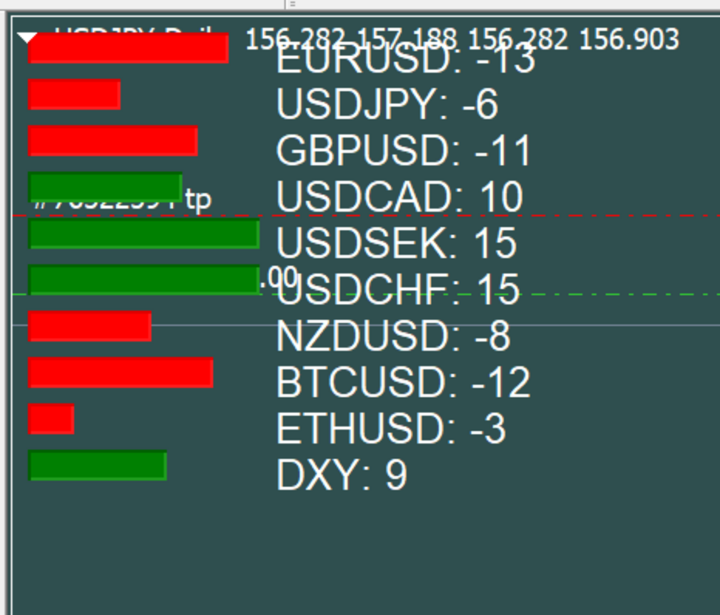
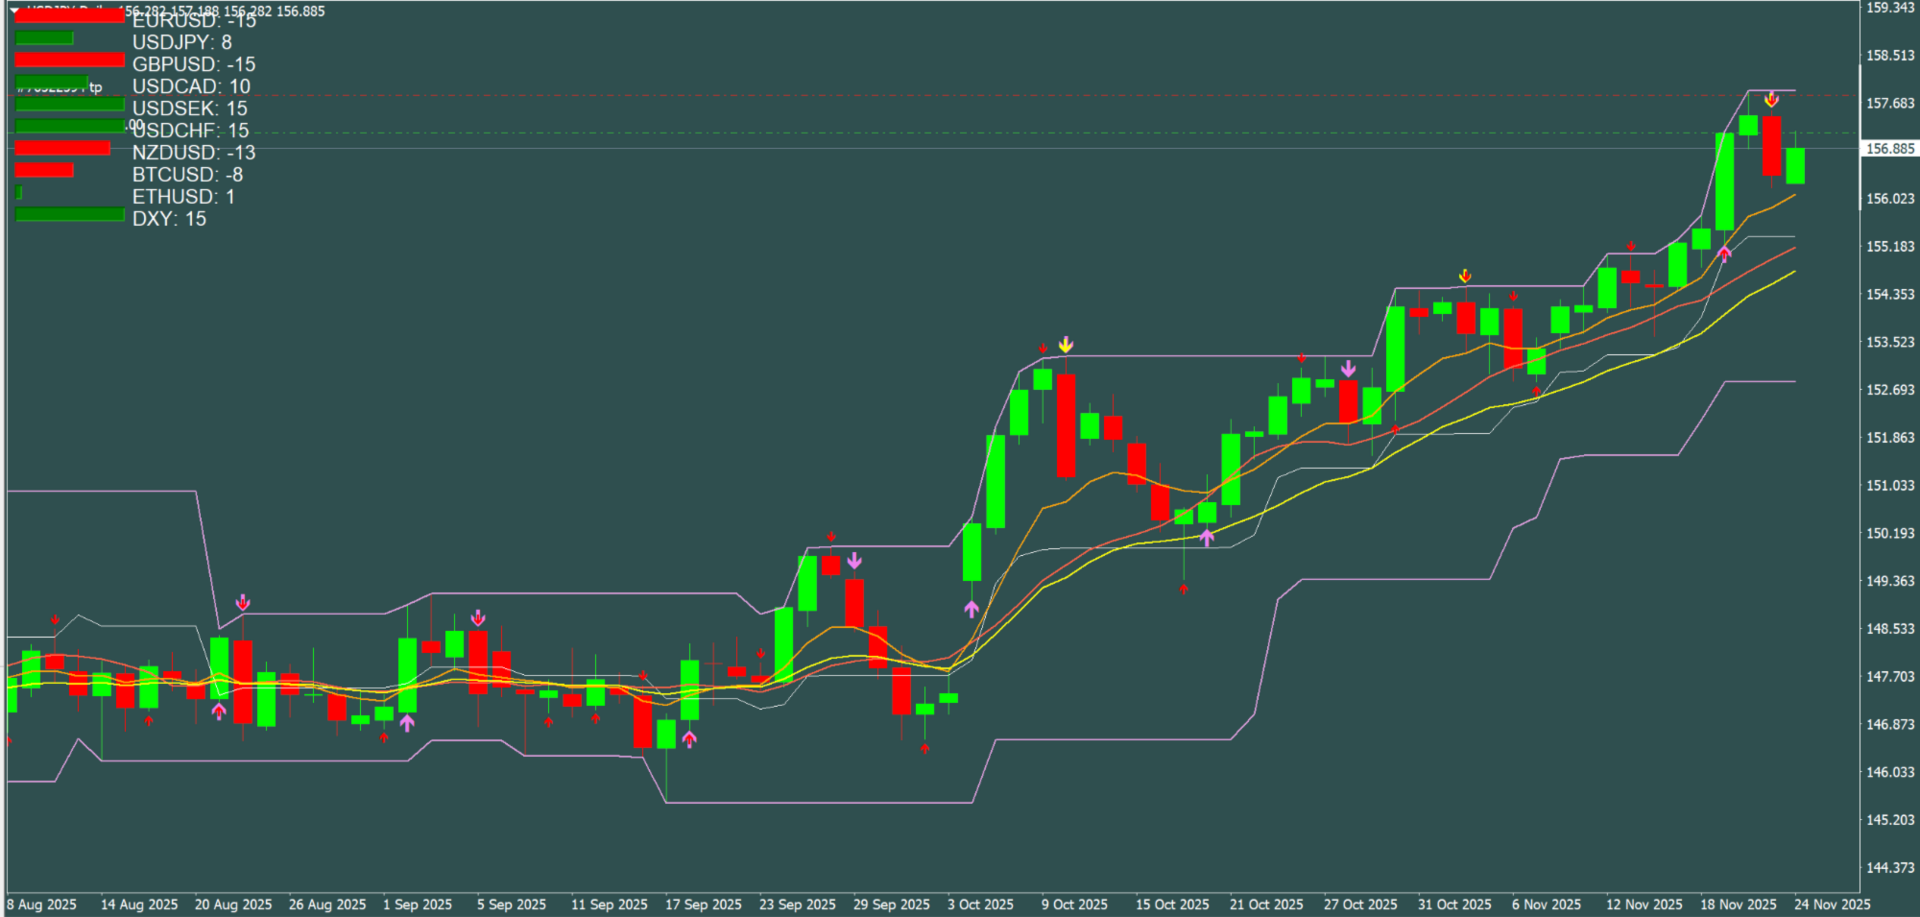
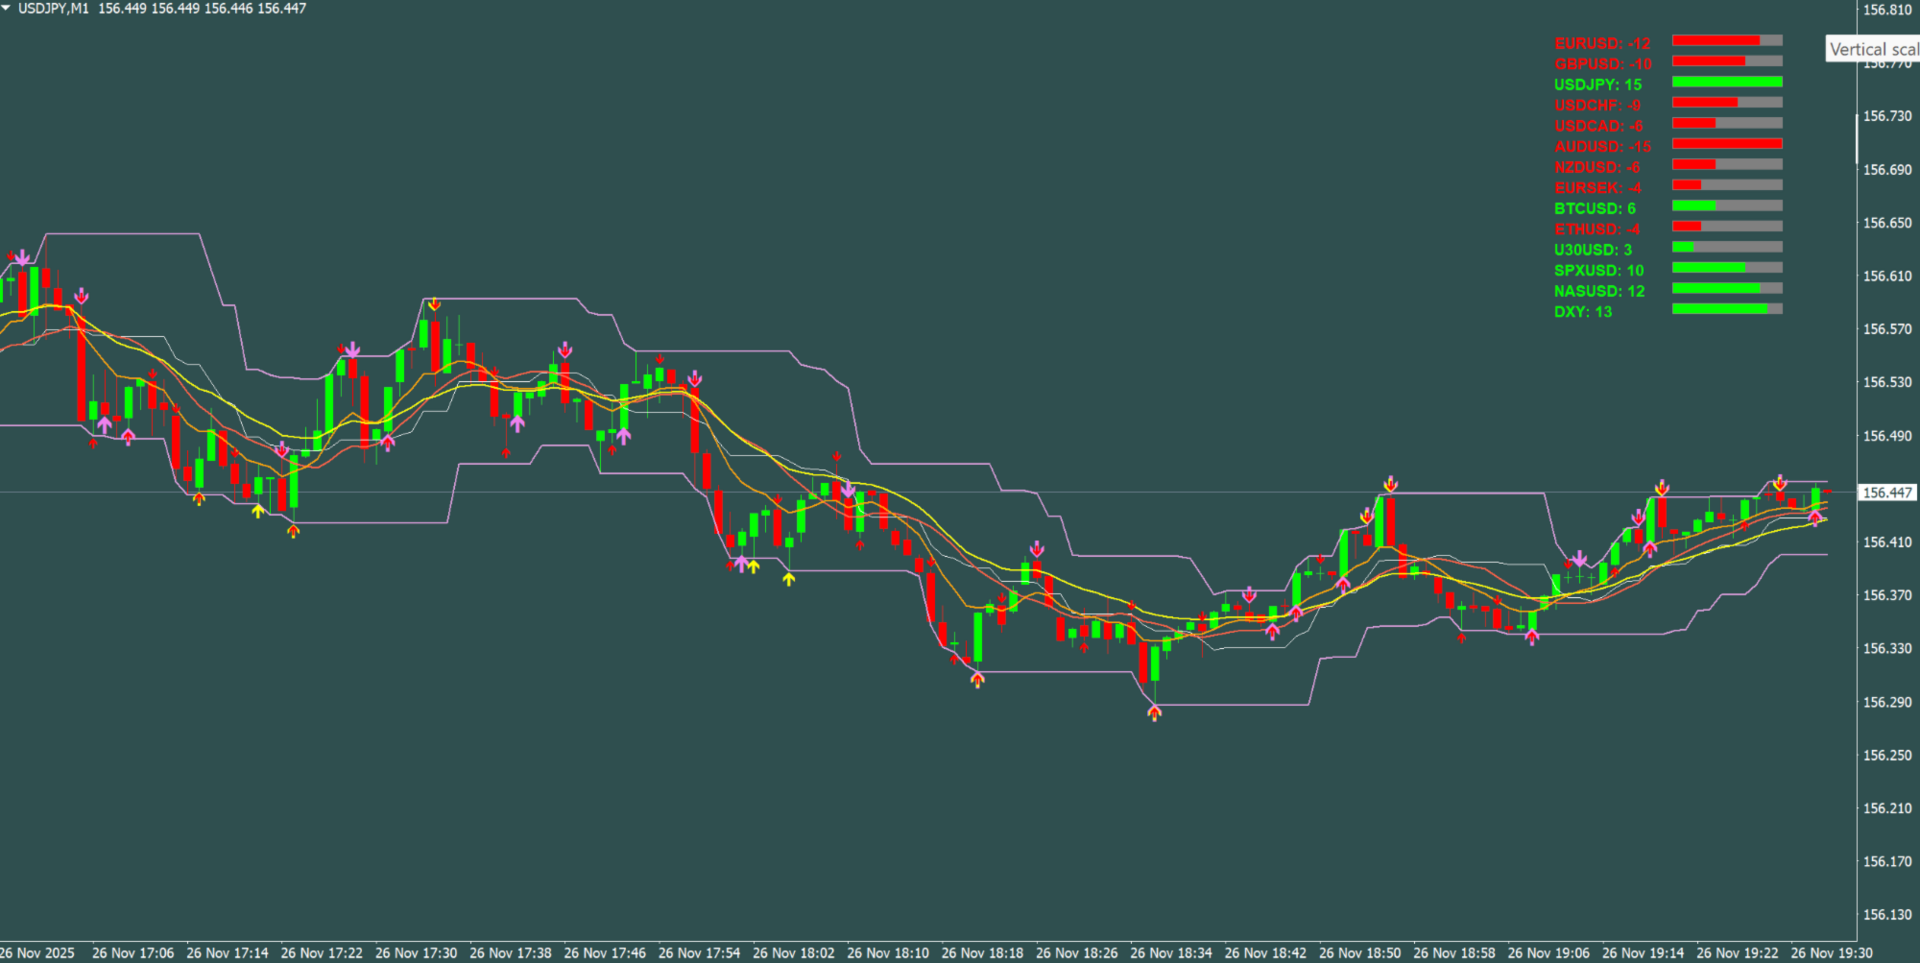
- Scaled -15 to +15 range for easy interpretation
- Color-coded bars: Green = bullish momentum, Red = bearish momentum

### Accurate US Dollar Index (DXY)
- Calculates DXY using the official ICE formula with proper currency weightings
- Track true dollar strength alongside individual pairs
- Option to display DXY at top or bottom of the list

### Two Display Modes (Included)
This product includes TWO indicator files to suit your trading style:

**1. CurrencyMeter_Pro.mq4 (On-Chart Version)**
- Displays directly on your price chart as an overlay
- Position anywhere: Top-Left, Top-Right, Bottom-Left, or Bottom-Right
- Perfect for traders who want everything visible on one screen

**2. CurrencyMeter_Pro_Subwindow.mq4 (Subwindow Version)**
- Displays in a separate panel below your chart
- Horizontal layout option for compact viewing
- Ideal for traders who prefer a clean chart with indicators in separate panels

### Fully Customizable Display
- Adjustable position (X/Y offset in pixels)
- Customizable bar width, height, and spacing
- Choose your colors for positive, negative, and neutral momentum
- Fixed or dynamic text color (matches bar color or stays fixed)
- Adjustable font size and style

### Universal Broker Compatibility
- Symbol prefix/suffix options work with ANY broker naming convention
- Supports formats like: EURUSD, EURUSDm, EUR/USD, EURUSD.pro, m.EURUSD
- Auto-detection: Only displays instruments your broker offers

### EA Integration Ready
- Exports all momentum values via GlobalVariables
- Access real-time strength data in your Expert Advisors
- Variable format: Momentum_EURUSD, Momentum_DXY, etc.

---

## Supported Instruments (100+)

### Forex Majors (7)
EURUSD, GBPUSD, USDJPY, USDCHF, USDCAD, AUDUSD, NZDUSD

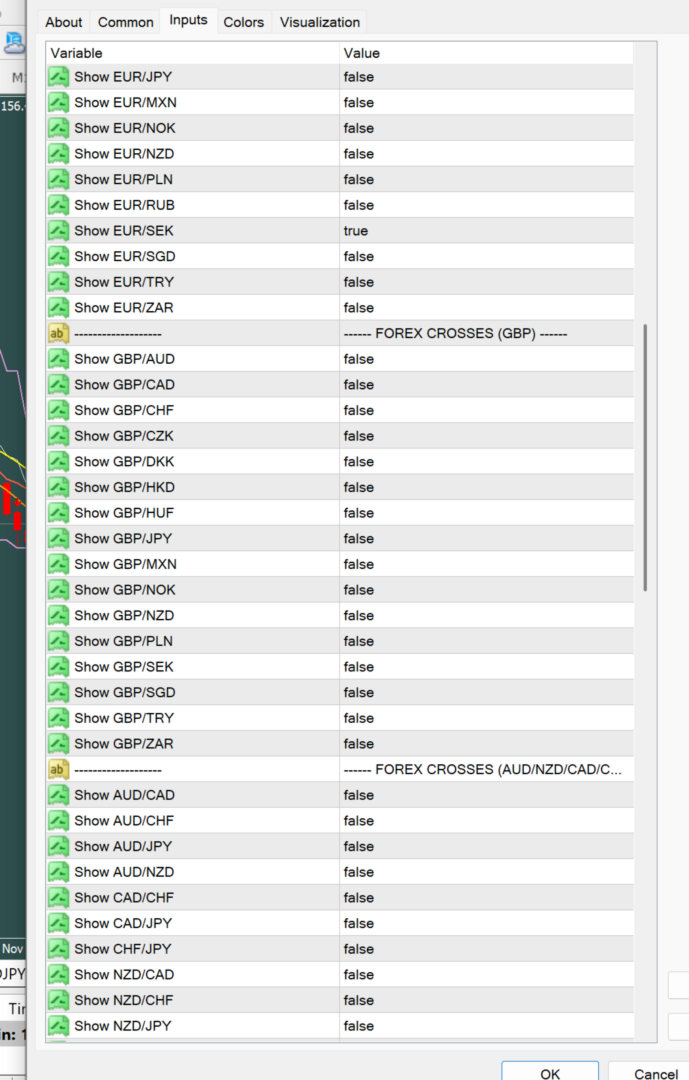
### Forex Crosses - EUR (18)
EURAUD, EURCAD, EURCHF, EURCZK, EURDKK, EURGBP, EURHKD, EURHUF, EURJPY, EURMXN, EURNOK, EURNZD, EURPLN, EURRUB, EURSEK, EURSGD, EURTRY, EURZAR

### Forex Crosses - GBP (16)
GBPAUD, GBPCAD, GBPCHF, GBPCZK, GBPDKK, GBPHKD, GBPHUF, GBPJPY, GBPMXN, GBPNOK, GBPNZD, GBPPLN, GBPSEK, GBPSGD, GBPTRY, GBPZAR

### Forex Crosses - AUD/NZD/CAD/CHF (11)
AUDCAD, AUDCHF, AUDJPY, AUDNZD, CADCHF, CADJPY, CHFJPY, NZDCAD, NZDCHF, NZDJPY, NZDSGD

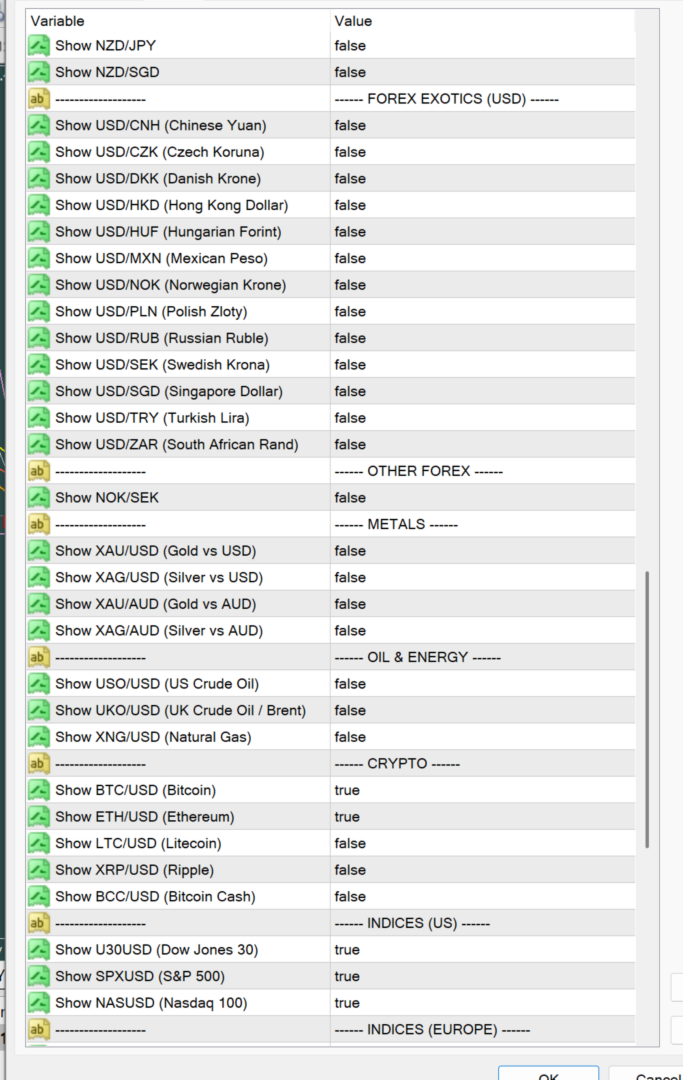
### Forex Exotics - USD (13)
USDCNH, USDCZK, USDDKK, USDHKD, USDHUF, USDMXN, USDNOK, USDPLN, USDRUB, USDSEK, USDSGD, USDTRY, USDZAR

### Other Forex (1)
NOKSEK

### Precious Metals (4)
XAUUSD (Gold/USD), XAGUSD (Silver/USD), XAUAUD (Gold/AUD), XAGAUD (Silver/AUD)

### Oil & Energy (3)
USOUSD (US Crude Oil), UKOUSD (Brent Crude), XNGUSD (Natural Gas)

### Cryptocurrencies (5)
BTCUSD (Bitcoin), ETHUSD (Ethereum), LTCUSD (Litecoin), XRPUSD (Ripple), BCCUSD (Bitcoin Cash)

### Indices - US (3)
U30USD (Dow Jones 30), SPXUSD (S&P 500), NASUSD (Nasdaq 100)

### Indices - Europe (5)
100GBP (UK FTSE 100), D30EUR (Germany DAX 30), F40EUR (France CAC 40), E50EUR (Euro Stoxx 50), E35EUR (Spain IBEX 35)

### Indices - Asia Pacific (4)
225JPY (Japan Nikkei 225), 200AUD (Australia S&P 200), H33HKD (Hong Kong Hang Seng), H50HKD (Hong Kong 50)

### Custom Symbols (10 Slots)
Add ANY symbol your broker offers using the 10 custom symbol input fields

---

## Input Parameters

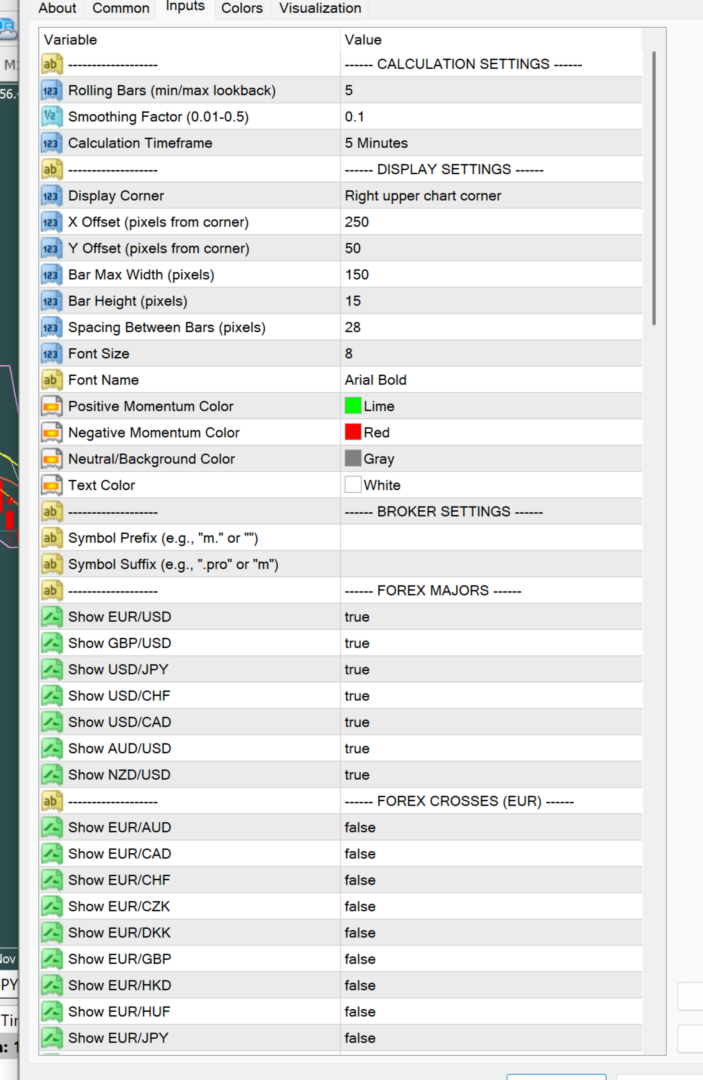
### Calculation Settings
| Parameter | Description | Default |
|-----------|-------------|---------|
| Rolling Bars | Lookback period for min/max calculation | 10 |
| Smoothing Factor | EMA smoothing intensity (0.01-0.5) | 0.1 |
| Calculation Timeframe | Timeframe for price data | M1 |

### Display Settings
| Parameter | Description | Default |
|-----------|-------------|---------|
| Display Corner | Chart corner for positioning (On-Chart version) | Left Upper |
| X Offset | Horizontal distance from corner (pixels) | 10 |
| Y Offset | Vertical distance from corner (pixels) | 50 |
| Bar Max Width | Maximum width of momentum bars (pixels) | 150 |
| Bar Height | Height of each bar (pixels) | 18 |
| Spacing Between Bars | Vertical space between meters (pixels) | 28 |
| Font Size | Text size | 10 |
| Font Name | Text font | Arial Bold |
| Positive Momentum Color | Color for bullish momentum | Lime |
| Negative Momentum Color | Color for bearish momentum | Red |
| Neutral/Background Color | Background bar color | Gray |
| Text Color | Label color (when fixed) | White |
| Use Fixed Text Color | True=fixed color, False=dynamic (matches bar) | False |
| Horizontal Layout | Side-by-side display (Subwindow version only) | True |

### Broker Settings
| Parameter | Description | Default |
|-----------|-------------|---------|
| Symbol Prefix | Added before symbol name (e.g., "m.") | Empty |
| Symbol Suffix | Added after symbol name (e.g., ".pro" or "m") | Empty |

### DXY Settings
| Parameter | Description | Default |
|-----------|-------------|---------|
| Show DXY | Display calculated Dollar Index | True |
| DXY At Bottom | Show DXY at bottom of list (vs top) | True |

---

## How To Use

### Installation
1. Copy both .ex4 files to your MT4 Indicators folder
2. Restart MT4 or refresh the Navigator panel
3. Drag your preferred version onto a chart

### Quick Start
1. Enable the instruments you want to track in the Inputs tab
2. Adjust display settings to your preference
3. If symbols don't appear, check your broker's naming convention and set the appropriate prefix/suffix

### Trading Applications
- **Pair Strong vs Weak**: When EUR shows +12 and JPY shows -10, consider long EURJPY
- **Confirm Trends**: Use momentum direction to confirm your technical analysis
- **Multi-Asset Scanning**: Quickly identify which markets are moving
- **Dollar Correlation**: Compare DXY with USD pairs for correlation trades

---

## Important Notes

### Initial Calibration Period
The indicator requires approximately 20-30 seconds to calibrate the rolling min/max calculations when first loaded onto a chart. Momentum values will stabilize and display accurately after this brief initialization period. This is normal behavior required for accurate adaptive scaling.

### Chart Window Size
For optimal performance when enabling new instruments, ensure your chart window is at a reasonable size. If some meters don't appear on smaller chart windows, simply enlarge the chart window and reload the indicator. Once loaded, you can resize the chart as desired and all meters will remain visible.

### Symbol Availability
The indicator automatically detects which symbols your broker offers. If you enable an instrument that your broker doesn't provide, it simply won't appear in the display. Use the Custom Symbol slots to add any broker-specific symbols not in the preset list.

---

## Why CurrencyMeter Pro?

**Multi-Asset Coverage** - Forex, Crypto, Indices, Metals, Energy all in one indicator

**Professional Accuracy** - Official DXY formula, EMA smoothing, adaptive normalization

**Two Display Modes** - On-chart overlay OR separate subwindow panel

**Universal Compatibility** - Works with any broker's symbol naming convention

**Fully Customizable** - Colors, sizes, positions, and 100+ instruments to choose from

**EA Ready** - GlobalVariable output for automated trading integration

**10 Custom Slots** - Add any symbol your broker offers

---

## What's Included

- CurrencyMeter_Pro.ex4 (On-Chart Version)
- CurrencyMeter_Pro_Subwindow.ex4 (Subwindow Version)
- User Guide (this document)

---

## Support

If you have questions or need assistance, please leave a comment or send a message. I'm committed to ensuring you get the most out of CurrencyMeter Pro.

---

*Trade smarter by knowing which markets are strongest. Download CurrencyMeter Pro today.*

Sound Alert Features Added

New Settings Section


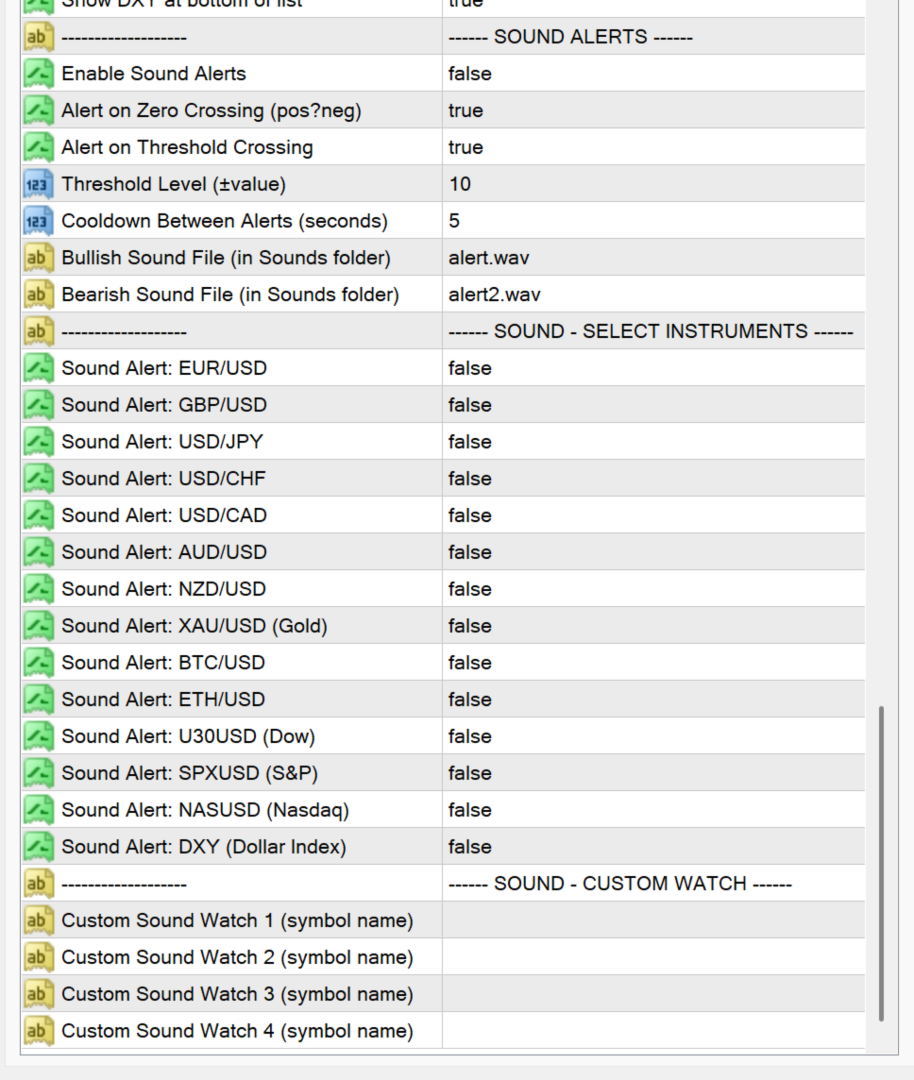
  • Enable Sound Alerts: Master on/off toggle (Default: false)
  • Alert on Zero Crossing: Sound when momentum flips positive↔negative (Default: true)
  • Alert on Threshold: Sound when momentum crosses ±threshold (Default: true)
  • Threshold Level: The level to trigger threshold alerts (Default: 10)
  • Cooldown Between Alerts: Seconds before same instrument can alert again (Default: 5)
  • Bullish Sound File: .wav file for positive crossings (Default: alert.wav)
  • Bearish Sound File: .wav file for negative crossings (Default: alert2.wav)

  • Instrument Sound Toggles
    Pre-configured toggles for common instruments:
    * EURUSD, GBPUSD, USDJPY, USDCHF, USDCAD, AUDUSD, NZDUSD
    * XAUUSD (Gold), BTCUSD, ETHUSD
    * U30USD (Dow), SPXUSD (S&P), NASUSD (Nasdaq)
    * DXY (Dollar Index)
    Custom Watch List
    4 slots where you can enter ANY symbol name to monitor with sound alerts.
    How It Works
    Zero Crossing Alerts:
    * Plays bullish sound when momentum goes from negative → positive
    * Plays bearish sound when momentum goes from positive → negative
    Threshold Crossing Alerts:
    * Plays bullish sound when momentum crosses above +10 (or your threshold)
    * Plays bearish sound when momentum crosses below -10 (or your threshold)
    Smart Features:
    * Automatic 30-second calibration period (no alerts during startup)
    * Cooldown prevents sound spam
    * Logs all alerts to Experts tab with details
    Example Setup
    To monitor EURUSD and DXY for trading:
    1. Enable Sound Alerts = true
    2. Sound_EURUSD = true
    3. Sound_DXY = true
    4. Threshold Level = 10
    5. Cooldown = 5 seconds
    You'll hear:
    * Alert when EURUSD momentum crosses ±10
    * Alert when EURUSD flips bullish/bearish
    * Alert when DXY crosses ±10 (inverse confirmation)
    * Different sounds so you know which fired
    Available MT4 Sounds
    These are in your MT4 `Sounds` folder:
    * alert.wav, alert2.wav
    * tick.wav
    * news.wav
    * ok.wav
    * expert.wav
    * connect.wav
    Or add your own .wav files to customize!

    추천 제품
    Force Directional
    Jan Carlos Pagano
    포스 디렉셔널 지표 포스 디렉셔널 기술 지표는 가격 움직임의 상대적 강도를 측정하고 동시에 트렌드의 방향성을 식별하고 추적하는 데 도움이 되는 요소 세트를 모으는 아이디어에 기반합니다. 이 지표는 느린 오실레이터(검은 선), 빠른 오실레이터(회색 선) 및 지수의 중앙 선으로 작동하는 값이 감소한 신호 선(파란 선)으로 구성되어 있습니다. 이는 움직임의 반전을 식별하고 방향 가이드로도 작동합니다. 지표의 오실레이터는 100의 값 위나 아래로 이동하여 다른 기간 및 시간 프레임에서 마지막 가격의 종가와 이전 종가를 비교합니다. 이 지표는 특히 트렌드 반전을 식별하는 데 효과적이며 어떤 시간 프레임에서도 성공적으로 사용될 수 있습니다. 그러나 보다 정확한 결정을 내리기 위해 움직임이나 트렌드의 강도를 평가하기 위해 보다 긴 시간 프레임에서 사용하는 것이 좋습니다. 사용 방법: 권장되는 전략은 느린 오실레이터가 100보다 작은 값을 가지고 신호 선을 상향으로 통과할 때 매수 포지션
    Ticks Size
    Viktor Kolmakov
    This indicator displays in a separate window the difference between the number of points which increased the price, and the number of points that decreased the price during the time interval specified in the settings. The time interval for calculation is expressed as the number of bars of the chart the indicator is attached to. This approach allows you to evaluate the movement direction (growth or fall) of the instrument's price, the strength of the movement and the size of the movement in point
    Gold Titan King Scalper
    Dodong Christian Arnon
    Indicator Description GOLD TITAN KING SIGNAL INDICATOR High-Precision Gold Scalping Buy/Sell Signals – Manual Trading Assistant Overview The Gold Titan King Signal Indicator is a manual trading assistant tool designed for high-frequency scalping on Gold (XAUUSD) and other major pairs. It generates clear BUY/SELL signals with precise entry levels, along with adjustable Stop Loss and Take Profit levels displayed directly on the chart. ️ This tool is NOT an EA. It does not execute trades
    Blahtech Market Profile
    Blahtech Limited
    4.53 (15)
    Was: $249  Now: $99   Market Profile defines a number of day types that can help the trader to determine market behaviour. A key feature is the Value Area, representing the range of price action where 70% of trading took place. Understanding the Value Area can give traders valuable insight into market direction and establish the higher odds trade. It is an excellent addition to any system you may be using. Blahtech Limited presents their Market Profile indicator for the MetaTrader community. Ins
    REX complete 3in1
    Christophe Godart
    This is the complete REX package. It consists of the lite, pro and ULTRA version.  Perfect for beginners and intermediates. REX complete is 100% non repaint. The strategy is based on a mix of different strategies, statistics, including pivot points, oscillators and patterns.  As the trading idea consists of a variety of some classic indicators like Momentum, Williams Percent Range, CCI, Force Index, WPR, DeMarker, CCI, RSI and Stochastic, it is clear that the fundamental indicators have being u
    Gioteen Volatility Index (GVI)   - your ultimate solution to overcoming market unpredictability and maximizing trading opportunities. This revolutionary indicator helps you in lowering your losing trades due to choppy market movements. The GVI is designed to measure market volatility, providing you with valuable insights to identify the most favorable trading prospects. Its intuitive interface consists of a dynamic red line representing the volatility index, accompanied by blue line that indicat
    ReboltDelta
    David Theodore Caro-greene
    Rebalance Overlay Technology (Rebolt) enables the trader to visualize the flow of money from one chart to another chart. Rebolt Delta (ReboltDelta) indicates the probable price change that will occur in the target chart based on changes in the source chart. ReboltDelta is designed for use in cooperation with Rebolt Probability. La tecnología de superposición de reequilibrio (Rebolt) permite al operador visualizar el flujo de dinero de un gráfico a otro gráfico. Rebolt Delta (ReboltDelta) indica
    Delta Pairs
    Anatolii Zainchkovskii
    Delta Pairs is an indicator for pair trading, it displays the divergence of two currency pairs. Does not redraw. A useful tool for the analysis of the behavior of two currency pairs relative to each other. Purpose The Delta Pairs indicator is designed for determining the divergences in the movements of two currency pairs. This indicator is displayed as two line charts and the difference (delta) between these charts in the form of a histogram. The Delta Pairs indicator will be useful for those w
    Binary Option Signal
    Yaroslav Varankin
    Indicator for binary options arrow is easy to use and does not require configuration works on all currency pairs, cryptocurrencies buy signal blue up arrow sell signal red down arrow tips do not trade during news and 15-30 minutes before their release, as the market is too volatile and there is a lot of noise it is worth entering trades one or two candles from the current period (recommended for 1 candle) timeframe up to m 15 recommended money management fixed lot or fixed percentage of the depo
    Night ghost
    Dmitriy Kashevich
    Night Ghost - Arrow indicator for binary options. This is a reliable assistant to you in the future! - No redrawing on the chart -Works great on EUR/USD currency pairs! -Indicator accuracy up to 90% (Especially at night) -No long setup required (Perfectly set up for Binary Options) - Not late signals - The appearance of a signal on the current candle -Perfect for M1 period (No More!) - Eye-friendly candle color (Red and Blue) -Installed Alert Working with it: - Blue arrow shows signa
    SMC Venom Model BPR 지표는 Smart Money(SMC) 개념 내에서 일하는 트레이더를 위한 전문 도구입니다. 가격 차트에서 두 가지 주요 패턴을 자동으로 식별합니다. FVG (공정 가치 갭)는 3개의 캔들의 조합으로, 첫 번째와 세 번째 캔들 사이에 갭이 있습니다. 이는 볼륨 지원이 없는 레벨 사이에 구역을 형성하여 종종 가격 수정으로 이어집니다. BPR (균형 가격 범위)은 두 개의 FVG 패턴의 조합으로, "브리지"를 형성합니다. 이는 가격이 낮은 볼륨 활동으로 움직일 때 브레이크아웃과 레벨로의 복귀 구역으로, 캔들 사이에 갭을 생성합니다. 이러한 패턴은 거래자가 차트에서 거래량과 가격 역학을 분석하여 주요 지지/저항 수준, 돌파 구역 및 진입 지점을 식별하는 데 도움이 되며, 여기서 대형 시장 참여자와 일반 참여자 간의 상호 작용이 발생합니다. 이 지표는 사각형과 화살표 형태로 패턴을 시각화하며 유연한 경고 설정도 지원합니다. 주요 특징: 패턴 표시 모드:
    Alpha Trend sign has been a very popular trading tool in our company for a long time. It can verify our trading system and clearly indicate trading signals, and the signals will not drift. Main functions: Based on the market display of active areas, indicators can be used to intuitively determine whether the current market trend belongs to a trend market or a volatile market. And enter the market according to the indicator arrows, with green arrows indicating buy and red arrows indicating se
    공급 및 수요 구역 주요 가격 지표 배경 시스템은 K-라인에서 자동으로 공급 및 수요 영역을 검색하고 실시간 주요 가격선을 그립니다. 거래자는 가격 거래선을 기준으로 거래할 수 있습니다. 주요 특징 시스템은 K-라인의 공급 및 수요 지역을 자동으로 검색합니다. 이 시스템은 또한 실시간 주요 가격선을 도출하고, 거래자는 가격 거래선을 기준으로 거래할 수 있습니다. 따라서 공급과 수요 구역 전략을 사용하는 거래자는 더 이상 공급과 수요 구역의 징후를 찾는 데 시간을 허비할 필요가 없습니다. 대신, 그들은 공급과 수요 영역 및 주요 가격에 대한 가격 반응에 집중하고 이에 맞는 거래 전략을 개발할 수 있습니다. 하지만 공급과 수요 구역 전략 자체는 변동성이 큰 기간 동안 더욱 효과적인 전략이므로 시장이 강한 추세를 보일 때는 주의해서 사용하거나 지표가 제시하는 제안을 추세 방향으로 사용해야 합니다. 범위 ShowZones: 공급 및 수요 구역을 표시할지 여부 DrawLines: 주요 가
    Nirvana prop controler MT4
    Aiireza Arjmandi Nezhad
    전문 트레이더와 평가형 계정(Prop)을 위한 위험 관리 및 한도 모니터링 지표 이 도구는 위험 관리와 한도에 관한 정보를 차트에 표시만 하여, 더 집중해서 의사결정을 내리도록 돕습니다. 인디케이터는 포지션을 열거나/닫거나/변경하지 않으며, 익스퍼트 어드바이저(EA)와도 충돌하지 않습니다. 기능 일일 및 총 드로우다운 모니터링 잔고(Balance) 또는 에쿼티(Equity)를 기준으로 일일/총 드로우다운을 계산·표시합니다(설정 가능). 설정된 한도까지 남은 비율을 표시합니다. 차트 내 깔끔하고 전문적인 패널 요약 표: Balance, Equity, 현재 P/L, 일일/총 DD, 경고 임계값. 의사결정에 집중할 수 있도록 간결하고 가독성 높은 UI. 위험 기반 포지션 사이징 퍼센트/고정 금액 리스크와 선택한 손절폭(SL)에 따라 대략적인 거래량을 산출. 위험대비보상비(R:R)와 진입, SL, TP 레벨을 차트에 표시. 경고와 알림 일일/총 DD 임계값에 근접 시 경고(임계값 퍼센트
    Trend Indicator This Indicator detects the essential momentum in the market and lets you know when the market has a potential trend Green means we are going higher and Red Means we are going Lower,  You can customise the Line to Any Color.  The alerts come in immediately there is a potential signal Defaults Length : 55 This is the Depth of your averaging calculation. The bigger it is the more noise is filtered.  55 Is the Best Optimum Setting For This Indicator
    History Pattern Search
    Yevhenii Levchenko
    표시기는 현재 시세를 작성하여 과거 시세와 비교할 수 있으며 이를 바탕으로 가격 변동을 예측합니다. 표시기에는 원하는 날짜로 빠르게 이동할 수 있는 텍스트 필드가 있습니다. 옵션: 기호 - 표시기가 표시할 기호 선택. SymbolPeriod - 지표가 데이터를 가져올 기간 선택. IndicatorColor - 표시기 색상. HorisontalShift - 지시자가 그린 따옴표를 지정된 막대 수만큼 이동합니다. Inverse - true는 인용 부호를 반대로, false - 원래 보기를 반전합니다. ChartVerticalShiftStep - 차트를 수직으로 이동합니다(키보드의 위/아래 화살표). 다음은 날짜를 입력할 수 있는 텍스트 필드의 설정으로, '엔터'를 누르면 즉시 이동할 수 있습니다.
    PipFinite Exit EDGE
    Karlo Wilson Vendiola
    4.83 (115)
    Did You Have A Profitable Trade But Suddenly Reversed? In a solid strategy, exiting a trade is equally important as entering. Exit EDGE helps maximize your current trade profit and avoid turning winning trades to losers. Never Miss An Exit Signal Again Monitor all pairs and timeframes in just 1 chart www.mql5.com/en/blogs/post/726558 How To Trade You can close your open trades as soon as you receive a signal Close your Buy orders if you receive an Exit Buy Signal. Close your Sell orders if
    GeoWprPro
    Georgij Komarov
    WPR by Profile, or WPR for Professionals Geo_WprPro is one of the well-known currency profile indicators. It simultaneously displays two WPR indicators with different parameters in the matrix form on all timeframes of multiple currency pairs forming the currency profile . As follows from the description, " WPR is a leading indicator that often goes ahead of the price chart. The oscillator frequently reaches extreme values before the price reversal as if anticipating that event: it almost always
    Gold Venamax MT4
    Sergei Linskii
    5 (1)
    Gold Venamax   - 이것은 최고의 주식 기술 지표입니다. 지표 알고리즘은 자산의 가격 변동을 분석하고 변동성과 잠재적 진입 영역을 반영합니다.   표시기 기능: 이것은 편안하고 수익성 있는 거래를 위한 매직과 두 개의 추세 화살표 블록을 갖춘 슈퍼 지표입니다. 블록 전환을 위한 빨간색 버튼이 차트에 표시됩니다. 매직은 표시기 설정에서 설정되므로 서로 다른 블록을 표시하는 두 개의 차트에 표시기를 설치할 수 있습니다. Gold Venamax는 서로 다른 화살표 버퍼(GV 및 SD)를 사용하여 두 개의 차트에 배치할 수 있습니다. 이렇게 하려면 설정에서 다른 Magic을 선택해야 합니다. 예를 들어 하나는 Magic = 999이고 다른 하나는 Magic = 666입니다. 다음으로 차트의 빨간색 버튼으로 화살표 버퍼를 선택할 수 있습니다. 지표 설정의 각 화살표 버퍼(GV 및 SD)에는 편안하고 수익성 있는 거래를 위한 별도의 화살표 필터가 있습니다(UseFiltrGV = t
    Deal Trading SPT
    Sukunthakan Ngernbamrung
    Deal Trading SPT (Super Trend) is an indicator, shows the market trend direction, entry position, take profit level, stop loss level and trend strength. Utility Help to further filter and develop strategy to trade Market overview on the chart Stop loss and take profit calculation with market volatility Resistance and support for trialing stop No repaint after the finished bar Works in any timeframe and financial instrument, including forex, CFD and crypto etc. Message pop-up, notification with
    Smart Gread Ultimate Edition (SGUL) indicator - based on smart order grid strategy. Maximum customization and flexibility of strategies are the main features of this indicator. In the right corner there is a table with the number and volume of orders. List of adjustable parameters: K: 2.0 - Factor of the next order increase (if the price moves in the other direction). TP: 50 - The number of points at which the order is closed with a profit (minimum profit per 1 lot). Step: 80 - The numb
    Discover the Power of Trend Strength Pro Unlock a new level of clarity in your trading with Trend Strength Pro , the ultimate tool for visualizing market momentum. Stop guessing and start seeing the true strength of a trend with a single glance. Our elegant and intuitive indicator helps you make smarter, more confident trading decisions. Key Advantages & Features Instantly See Trend Strength : Our color-coded histogram tells you whether the trend is getting stronger or weaker. Green means moment
    FREE
    ReboltP
    David Theodore Caro-greene
    Rebalance Overlay Technology (Rebolt) enables the trader to visualize the flow of money from one chart to another chart. Rebolt Probability indicates the probability that money has flowed from one chart to another chart for a specified length of time over a number of intervals specified by the user. When Rebolt reads Cyan or Blue these are buying signs good for the length of time specified by the user or until a conflicting signal arises. When Rebolt reads Violet or Red there are selling signs g
    Gold Trend 4
    Sergei Linskii
    금 추세   - 좋은 주식 기술 지표입니다. 인디케이터 알고리즘은 자산의 가격 움직임을 분석하고 변동성과 잠재적 진입 구간을 반영합니다. 최고의 지표 신호: - 매도 = 빨간색 히스토그램 + 빨간색 숏 포인터 + 같은 방향의 노란색 신호 화살표 + 빨간색 추세 방향 화살표. - 매수 = 파란색 히스토그램 + 파란색 롱 포인터 + 같은 방향의 아쿠아 신호 화살표 + 빨간색 추세 방향 화살표. 인디케이터의 장점 1. 표시기는 높은 정확도로 신호를 생성합니다. 2. 확인된 화살표 신호는 추세가 바뀔 때만 다시 그릴 수 있습니다. 3. 모든 브로커의 메타트레이더 4 거래 플랫폼에서 거래할 수 있습니다. 4. 모든 자산(통화, 금속, 암호화폐, 주식, 지수 등)을 거래할 수 있습니다. 5. M15-H1 차트주기(중기 트레이딩)에서 거래하는 것이 좋습니다. 6. 지표 설정에서 개별 매개 변수(TF, 색상 등)를 변경할 수 있으므로 각 트레이더가 지표를 쉽게 사용자 지정할 수 있습니
    Auto Fibo Pro m
    DMITRII GRIDASOV
    "Auto FIBO Pro" Crypto_Forex 지표 - 거래에 유용한 보조 도구입니다! - 지표는 자동으로 Fibo 수준과 로컬 추세선(빨간색)을 계산하여 차트에 배치합니다. - Fibonacci 수준은 가격이 반전될 수 있는 주요 영역을 나타냅니다. - 가장 중요한 수준은 23.6%, 38.2%, 50%, 61.8%입니다. - 역전 스캘핑이나 존 그리드 거래에 사용할 수 있습니다. - Auto FIBO Pro 지표를 사용하여 현재 시스템을 개선할 수 있는 기회도 많습니다. - Info Spread Swap Display가 있습니다. 현재 Spread와 Swap이 부착된 외환 쌍을 표시합니다. - 디스플레이에는 계정 잔액, 자본 및 마진도 표시됩니다. - 차트의 어느 모서리에서나 Info Spread Swap Display를 찾을 수 있습니다. 0 - 왼쪽 상단 모서리, 1 - 오른쪽 상단, 2 - 왼쪽 하단, 3 - 오른쪽 하단. 여기를 클릭하여 고품질 트레이딩 로봇과
    Forex Gump
    Andrey Kozak
    2.4 (5)
    Forex Gump is a fully finished semi-automatic trading system. In the form of arrows, signals are displayed on the screen for opening and closing deals. All you need is to follow the instructions of the indicator. When the indicator shows a blue arrow, you need to open a buy order. When the indicator shows a red arrow, you need to open a sell order. Close orders when the indicator draws a yellow cross. In order to get the most effective result, we recommend using the timeframes H1, H4, D1. There
    Blahtech Supply Demand
    Blahtech Limited
    4.58 (36)
    Was: $299  Now: $99   Supply Demand uses previous price action to identify potential imbalances between buyers and sellers. The key is to identify the better odds zones, not just the untouched ones. Blahtech Supply Demand indicator delivers functionality previously unavailable on any trading platform. This 4-in-1 indicator not only highlights the higher probability zones using a multi-criteria strength engine, but also combines it with multi-timeframe trend analysis, previously confirmed swings
    VR Cub
    Vladimir Pastushak
    VR Cub 은 고품질 진입점을 얻는 지표입니다. 이 지표는 수학적 계산을 용이하게 하고 포지션 진입점 검색을 단순화하기 위해 개발되었습니다. 지표가 작성된 거래 전략은 수년 동안 그 효율성을 입증해 왔습니다. 거래 전략의 단순성은 초보 거래자라도 성공적으로 거래할 수 있다는 큰 장점입니다. VR Cub은 포지션 개시 지점과 이익 실현 및 손절매 목표 수준을 계산하여 효율성과 사용 편의성을 크게 높입니다. 간단한 거래 규칙을 이해하려면 아래 전략을 사용한 거래 스크린샷을 살펴보세요. 설정, 세트 파일, 데모 버전, 지침, 문제 해결 등은 다음에서 얻을 수 있습니다. [블로그] 다음에서 리뷰를 읽거나 작성할 수 있습니다. [링크] 버전 [MetaTrader 5] 진입점 계산 규칙 포지션 개설 진입점을 계산하려면 VR Cub 도구를 마지막 최고점에서 마지막 최저점까지 늘려야 합니다. 첫 번째 지점이 두 번째 지점보다 빠른 경우, 거래자는 막대가 중간선 위에서 마감될 때까지 기다립니다
    Robot scalper for M5 timeframe. Trades on the GBPUSD currency pair. This robot has been specially developed by a company of professional traders for trading in the pound sterling. The robot approximately opens 5 to 15 trades every day. It is best to trade with brokers that have a low spread on GBPUSD up to 10 pips. The recommended minimum deposit to start is $500 or more. Advantages: does not use martingale. not a net. every trade has a stop loss. professional bot specifically for the GBPUSD p
    EARLY REMINDER: The Starting price is 65 price will rise soon up to 365$ and then 750$ after first 10 copies of sales. Grab this offer now! Introduction Hello, traders! Welcome to the demonstration of the Forex Beast Indicator , a comprehensive tool designed to assist aspiring traders in navigating the complexities of the forex market. This indicator incorporates seven essential components to provide a well-rounded trading experience: Moving Averages Colored Zones Support and Resistance Levels
    이 제품의 구매자들이 또한 구매함
    현재 20% 할인 ! 초보자 또는 전문가 트레이더를 위한 최고의 솔루션! 이 대시보드 소프트웨어는 28개의 통화 쌍에서 작동합니다. 2가지 주요 지표(Advanced Currency Strength 28 및 Advanced Currency Impulse)를 기반으로 합니다. 전체 Forex 시장에 대한 훌륭한 개요를 제공합니다. 고급 통화 강도 값, 통화 이동 속도 및 모든(9) 시간대의 28 Forex 쌍에 대한 신호를 보여줍니다. 추세 및/또는 스캘핑 기회를 정확히 파악하기 위해 차트의 단일 지표를 사용하여 전체 시장을 볼 수 있을 때 거래가 어떻게 개선될지 상상해 보십시오! 잠재적인 거래를 식별하고 확인하면서 강력한 통화와 약한 통화를 더욱 쉽게 식별할 수 있도록 이 지표에 기능을 내장했습니다. 이 표시기는 통화의 강세 또는 약세가 증가 또는 감소하는지 여부와 모든 시간대에서 수행되는 방식을 그래픽으로 보여줍니다. 추가된 새로운 기능은 현재 시장 조건 변화에 적응하는
    Dynamic Forex28 Navigator
    Bernhard Schweigert
    4.43 (7)
    Dynamic Forex28 Navigator - 차세대 외환 거래 도구. 현재 49% 할인. Dynamic Forex28 Navigator는 오랫동안 인기 있는 지표의 진화형으로, 세 가지의 힘을 하나로 결합했습니다. 고급 통화 Strength28 지표(695개 리뷰) + 고급 통화 IMPULSE with ALERT(520개 리뷰) + CS28 콤보 신호(보너스). 지표에 대한 자세한 정보 https://www.mql5.com/en/blogs/post/758844 차세대 Strength 지표는 무엇을 제공합니까?  원래 지표에서 좋아했던 모든 것이 새로운 기능과 더 높은 정확도로 강화되었습니다. 주요 기능: 독점적인 통화 Strength 공식.  모든 시간대에 걸쳐 부드럽고 정확한 강도선. 추세와 정확한 진입을 식별하는 데 이상적입니다. 역동적인 시장 피보나치 수준(시장 피보나치).  이 지표에만 있는 고유한 기능. 가격 차트가 아닌 통화 강도에 피보나치가 적용됩니다.
    Dynamic Scalper System
    Vitalyi Belyh
    5 (1)
    " Dynamic Scalper System " 지표는 추세 파동 내에서 스캘핑 방식으로 거래하도록 설계되었습니다. 주요 통화쌍 및 금에서 테스트되었으며, 다른 거래 상품과의 호환성이 가능합니다. 추가적인 가격 변동 지원을 통해 추세에 따라 단기 포지션 진입 신호를 제공합니다. 지표의 원리 큰 화살표는 추세 방향을 결정합니다. 작은 화살표 형태의 스캘핑 신호를 생성하는 알고리즘은 추세 파동 내에서 작동합니다. 빨간색 화살표는 상승 방향을, 파란색 화살표는 하락 방향을 나타냅니다. 민감한 가격 변동선은 추세 방향으로 그려지며, 작은 화살표의 신호와 함께 작용합니다. 신호는 다음과 같이 작동합니다. 적절한 시점에 선이 나타나면 진입 신호가 형성되고, 선이 있는 동안 미결제 포지션을 유지하며, 완료되면 거래를 종료합니다. 권장되는 작업 시간대는 M1~H4입니다. 화살표는 현재 캔들에 형성되며, 다음 캔들이 이미 시작되었더라도 이전 캔들의 화살표는 다시 그려지지 않습니다. 입력 매개
    이 지표는 실제 거래에 완벽한 자동 파동 분석 지표입니다! 사례... 참고:   웨이브 그레이딩에 서양식 이름을 사용하는 데 익숙하지 않습니다. Tang Lun(Tang Zhong Shuo Zen)의 명명 규칙의 영향으로 기본 웨이브를   펜   으로 명명하고 2차 웨이브 밴드를   세그먼트   로 명명했습니다. 동시에, 세그먼트에는 추세 방향이 있습니다.   주요 추세 세그먼트에는   이름이 지정되지만(이 이름 지정 방법은 향후 노트에서 사용됩니다. 먼저 말씀드리겠습니다.) 알고리즘은 굴곡 이론과 거의 관련이 없으므로 그렇게 해서는 안 됩니다. 이는 나의 시장 분석을   통해 요약된 끊임없이 변화하고 복잡한 운영 규칙을   반영합니다. 밴드는 더 이상 사람마다 다르지 않도록 표준화되고 정의되었습니다. 인위적인 간섭의 드로잉 방법은 시장 진입을 엄격하게 분석하는 데 핵심적인 역할을 합니다. 이 지표를 사용하는 것은 거래 인터페이스의 미학을 개선하고 원래의 K-line 거래를
    Rtc ML Ai Predictor MT4
    Muhammad Faisal Sagala
    Product Description Rtc ML Ai Predictor — Futuristic Intelligence for Real-Time Market Decisions Bring robotic precision to your trading.   Rtc ML Ai Predictor   fuses   Machine Learning   with   SMA-shift dynamics   to forecast short-term momentum and trend inflection points with clarity. The model evaluates multi-factor market structure, assigns a   confidence score   to each signal, and lets you act only when conditions align with your rules. Why traders choose Rtc ML Ai Predictor AI-guided e
    ECM Elite Channel is a volatility-based indicator, developed with a specific time algorithm, which consists of finding possible corrections in the market. This indicator shows two outer lines, an inner line (retracement line) and an arrow sign, where the channel theory is to help identify overbought and oversold conditions in the market. The market price will generally fall between the boundaries of the channel. If prices touch or move outside the channel, it's a trading opportunity. The ind
    IQ Gold Gann Levels
    INTRAQUOTES
    5 (4)
    Presenting one-of-a-kind Gann Indicator for XAUUSD IQ Gold Gann Levels is a non-repainting, precision tool designed exclusively for XAUUSD/Gold intraday trading. It uses W.D. Gann’s square root method to plot real-time support and resistance levels, helping traders spot high-probability entries with confidence and clarity. William Delbert Gann (W.D. Gann) was an exceptional market analyst whose trading technique was based on a complex blend of mathematics, geometry, astrology, and ancient calcul
    RelicusRoad Pro
    Relicus LLC
    4.63 (106)
    훌륭한 백테스트 , 환상적인 숫자로 증명된 실계좌 성능 , 그리고 온갖 통계 를 가진 트레이딩 지표를 얼마나 많이 구매했지만, 사용 후에 결국 계좌를 날려버린 적이 있나요? 신호 자체만으로는 신뢰할 수 없습니다. 애초에 그 신호가 왜 나타났는지 알아야 하며, 이것이 바로 RelicusRoad Pro가 가장 잘하는 일입니다! 사용자 설명서 + 전략 + 교육 비디오 + VIP 접근 권한이 있는 비공개 그룹 + 모바일 버전 사용 가능 시장을 바라보는 새로운 방법 RelicusRoad는 외환, 선물, 암호화폐, 주식 및 지수를 위한 세계에서 가장 강력하고 최고의 트레이딩 지표 이며, 트레이더가 계좌를 성장 시키는 데 필요한 모든 정보와 도구를 제공합니다. 저희는 초보자 부터 고급 트레이더까지 모든 트레이더가 성공 할 수 있도록 기술적 분석 과 트레이딩 계획 을 제공합니다. 이것은 미래 시장을 예측 하기에 충분한 정보를 제공하는 핵심 트레이딩 지표 입니다. 저희는 차트에 여러 다른 지표
    The Super Arrow Indicator provides non-repainting buy and sell signals with exceptional accuracy. Key Features No repainting – confirmed signals remain fixed Clear visual arrows: green for buy, red for sell Real-time alerts via pop-up, sound, and optional email Clean chart view with no unnecessary clutter Works on all markets: Forex, gold, oil, indices, crypto Adjustable Parameters TimeFrame Default: "current time frame" Function: Sets the time frame for indicator calculation Options: Can be set
    Introduction to Fractal Pattern Scanner Fractal Indicator refers to the technical indicator that makes use of the fractal geometry found in the financial market. Fractal Pattern Scanner is the advanced Fractal Indicator that brings the latest trading technology after the extensive research and development work in the fractal geometry in the financial market. The most important feature in Fractal Pattern Scanner is the ability to measure the turning point probability as well as the trend probabi
    Supreme Commander
    Ramon Sobrevals Arce
    4.13 (8)
    The indicator of the indicators. The Most Powerful Technique to Determine Forex Trend Strength in 2023. We have perfected Supreme Commander that it calculates an average of the selected indicators (up to 16) and the selected timeframe (all) with the result of a single trend that indicates the potential of buying and selling.  It includes the following indicators: Accelerator/Decelerator oscillator Average Directional Movement Index Awesome oscillator; Bulls and Bears  Commodity Channel Index; De
    Ultimate Market Master Trend Master the Market’s Direction with Precision The Ultimate Market Master Trend indicator is an all-in-one market sentiment analyser designed for traders who demand clarity, accuracy, and confidence in every move. It combines smart trend detection , multi-timeframe stochastic momentum , and dynamic visual cues to help you identify high-probability entries and exits with ease.  Key Features  1. Smart Trend System (Main Chart) Uses a 200-period LWMA baseline to determin
    Smart Price Action Concepts
    Issam Kassas
    4.75 (12)
    우선적으로, 이 거래 도구는 전문적인 거래에 이상적인 비-다시 그리기 및 지연되지 않는 지표입니다.  온라인 강좌, 사용자 매뉴얼 및 데모. 스마트 가격 액션 컨셉트 인디케이터는 신규 및 경험 많은 트레이더 모두에게 매우 강력한 도구입니다. Inner Circle Trader Analysis 및 Smart Money Concepts Trading Strategies와 같은 고급 거래 아이디어를 결합하여 20가지 이상의 유용한 지표를 하나로 결합합니다. 이 인디케이터는 스마트 머니 컨셉트에 중점을 두어 대형 기관의 거래 방식을 제공하고 이동을 예측하는 데 도움을 줍니다.  특히 유동성 분석에 뛰어나 기관이 어떻게 거래하는지 이해하는 데 도움을 줍니다. 시장 트렌드를 예측하고 가격 변동을 신중하게 분석하는 데 탁월합니다. 귀하의 거래를 기관 전략에 맞추어 시장의 동향에 대해 더 정확한 예측을 할 수 있습니다. 이 인디케이터는 시장 구조를 분석하고 중요한 주문 블록을 식별하고 다양한
    Supply and Demand Dashboard PRO
    Bernhard Schweigert
    4.8 (20)
    현재 20% 할인! 이 대시보드는 여러 기호와 최대 9개의 타임프레임에서 작동하는 매우 강력한 소프트웨어입니다. 주요 지표(최상의 리뷰: 고급 공급 수요)를 기반으로 합니다.   Advanced Supply Demand 대시보드는 훌륭한 개요를 제공합니다. 다음과 같이 표시됩니다.  영역 강도 등급을 포함하여 필터링된 공급 및 수요 값, 영역에 대한/및 영역 내 Pips 거리, 중첩된 영역을 강조 표시하고 모든 (9) 시간 프레임에서 선택한 기호에 대해 4가지 종류의 경고를 제공합니다. 그것은 당신의 개인적인 필요에 맞게 고도로 구성 가능합니다! 당신의 혜택! 모든 트레이더에게 가장 중요한 질문: 시장에 진입하기에 가장 좋은 수준은 무엇입니까? 최고의 성공 기회와 위험/보상을 얻으려면 강력한 공급/수요 영역 내 또는 그 근처에서 거래를 시작하십시오. 손절매를 위한 최적의 장소는 어디입니까? 가장 안전하려면 강력한 수요/공급 구역 아래/위에 정류장을 두십시오.
    ---- Brand New Strategy. Three Month Rent is $30. ONE YEAR RENT ONLY $50. FREE EURUSD VERSION AVAILABLE UNDER << Forecast System Gift >>. NO NEED FOR BACKTEST! Link to the FREE version -->  https://www.mql5.com/en/market/product/110085?source=Site --- This is a simple strategy based on BREAKOUT and FIBONACCI levels. After a breakout, either, the market: - continues the move directly to the 161, 261 and 423 levels, or - retraces to the 50% level (also called a correction) and thereafter continues
    Enigmera
    Ivan Stefanov
    5 (8)
    ENIGMERA: 시장의 핵심 중요: MQL5.com의 데모는 Strategy Tester에서 실행되며 Enigmera의 기능을 완전히 반영하지 못할 수 있습니다. 설명, 스크린샷 및 비디오를 확인하여 자세한 내용을 확인하십시오. 질문이 있으면 언제든지 메시지를 보내주세요! 인디케이터의 코드는 완전히 다시 작성되었습니다. 버전 3.0은 새로운 기능을 추가하고 인디케이터가 처음 출시된 이후 누적된 버그를 수정했습니다. 소개 이 인디케이터 및 거래 시스템은 금융 시장에 대한 주목할 만한 접근 방식입니다. ENIGMERA는 프랙탈 주기를 사용하여 정확하게 지원 및 저항 수준을 계산합니다. 실제 축적 단계를 보여주고 방향과 목표를 제공합니다. 트렌드와 수정 모두에서 작동하는 시스템입니다. 작동 방식 인디케이터의 대부분의 기능은 차트 왼쪽에 있는 버튼을 통해 제어되며, 이를 통해 다양한 시장 상황에 빠르게 대응할 수 있습니다. 버튼 ON/OFF – 인디케이터 전체를 표시하거나 숨깁니다.
    " ZigZag on Trend " 지표는 가격 움직임 방향을 파악하는 데 도움이 되는 지표이며, 막대 및 핍 계산기 기능도 제공합니다. 이 지표는 추세 지표, 가격 방향을 추적하는 지그재그로 표현된 추세선, 그리고 추세 방향으로 지나가는 막대 수와 수직선의 핍 수를 계산하는 카운터로 구성됩니다(계산은 막대의 시작점을 기준으로 합니다). 이 지표는 다시 채색되지 않습니다. 편의상 색상이 있는 막대 또는 선으로 표시됩니다. 모든 시간대에서 사용할 수 있지만, M5 이상에서 사용하는 것이 가장 좋습니다. " Period "은 가격 방향을 검색할 막대 수를 결정합니다. 한 방향으로 완만한 추세를 얻기 위해 방향의 길이를 계산합니다. " Diapason "는 추세 방향의 빈도를 조정하며, 주로 다양한 거래 상품의 첫 번째 매개변수를 조정합니다(EURUSD의 경우 최대 10개, GOLD의 경우 최대 100개). 핍 카운터는 모든 시간대 및 거래 상품에 대한 조정을 지원합니다. 주요 지표
    Looking for a powerful yet lightweight swing detector that accurately identifies market structure turning points? Want clear, reliable buy and sell signals that work across any timeframe and any instrument? Buy Sell Arrow MT Swing is built exactly for that — precision swing detection made simple and effective. This indicator identifies Higher Highs (HH) , Higher Lows (HL) , Lower Highs (LH) , and Lower Lows (LL) with remarkable clarity. It is designed to help traders easily visualize market str
    Introducing the Delta Volume Profile Indicator - Unleash the Power of Institutional Precision!  Technical Indicator: Are you ready to trade like the pros? The Delta Volume Profile Indicator is no ordinary tool. It’s a high-precision, cutting-edge indicator that puts the power of institutional-grade trading in your hands. This unique indicator analyses delta volume distribution in real-time, revealing the market's hidden buy/sell imbalances that the biggest financial institutions rely on to antic
    궁극의 화살표 지표 - 트레이딩 성공을 위한 당신의 도구! 많은 것을 약속하지만 제공하는 것이 적은 도구에 지치셨나요? 우리의 Ultimate Arrow Indicator for MT4는 당신의 트레이딩을 한 단계 높은 수준으로 끌어올릴 궁극적인 솔루션입니다. 이 지표는 명확하고 신뢰할 수 있는, 타협 없는 신호를 제공하기 위해 정밀하게 설계되었습니다. 이렇기 때문에 Ultimate Arrow Indicator는 경험이 풍부한 트레이더와 초보자 모두에게 이상적인 선택입니다: 탁월한 성능 - 검증된 결과 1년간의 상세한 백테스트: 승률 90%로 이 지표는 수익을 창출하는 데 매우 신뢰할 수 있는 것으로 입증되었습니다. 7,006개의 생성된 신호 중 6,242개가 승리였으며, 신호당 평균 29핍의 이익을 얻었습니다. 손실 비율 최소화: 생성된 신호 중 10%만이 부정적인 결과였으며, 이는 알고리즘의 정확도와 품질을 증명합니다. 주요 기능 리페인트 없음 : 신호가 생성된 후에는 변경되지
    BinaryUniversal
    Andrey Spiridonov
    BinaryUniversal is a signal indicator for binary options and Forex. In its work, the indicator uses a complex algorithm for generating signals. Before forming a signal, the indicator analyzes volatility, candlestick patterns, important support and resistance levels. The indicator has the ability to adjust the accuracy of the signals, which makes it possible to apply this indicator for both aggressive and conservative trading. The indicator is set in the usual way, it works on any time period and
    Introduction to X3 Chart Pattern Scanner X3 Cherart Pattern Scanner is the non-repainting and non-lagging indicator detecting X3 chart patterns including Harmonic pattern, Elliott Wave pattern, X3 patterns, and Japanese Candlestick patterns. Historical patterns match with signal patterns. Hence, you can readily develop the solid trading strategy in your chart. More importantly, this superb pattern scanner can detect the optimal pattern of its kind. In addition, you can switch on and off individu
    "Dragon's Tail" is an integrated trading system, not just an indicator. This system analyzes each candle on a minute-by-minute basis, which is particularly effective in high market volatility conditions. The "Dragon's Tail" system identifies key market moments referred to as "bull and bear battles". Based on these "battles", the system gives trade direction recommendations. In the case of an arrow appearing on the chart, this signals the possibility of opening two trades in the indicated directi
    Scientific trade
    Aleksey Ivanov
    5 (1)
    An extremely convenient indicator that truly makes the process of making money on the exchange easy. It is based on the scientifically rigorous theory of the market developed by the author, the beginning of which is presented here .                The full algorithm of this indicator operation is presented in the article .               The indicator calculates the most probable price movement trajectory and displays it on the chart. Based on the predicted price movement trajectory
    Super Signal – Skyblade Edition 전문가용 노리페인트 / 노래그 트렌드 신호 시스템, 뛰어난 승률 제공 | MT4 / MT5용 핵심 기능: Super Signal – Skyblade Edition은 추세 매매를 위해 설계된 스마트 신호 시스템입니다. 이 시스템은 다중 필터 로직을 활용하여, 명확한 방향성과 실질적인 모멘텀이 수반된 고품질 추세만을 감지합니다. 이 시스템은 고점 또는 저점을 예측하지 않으며 , 다음 세 가지 조건이 모두 충족될 때만 신호를 발생시킵니다: 명확한 추세 방향 강화되는 모멘텀 건전한 변동성 구조 또한, 시장 세션 기반의 유동성 분석을 통해 신호의 신뢰성과 타이밍을 더욱 향상시킵니다. 신호 특성: 모든 화살표 신호는 100% 리페인트 없음 / 지연 없음 신호가 한 번 발생하면 고정되며, 깜빡이거나 사라지지 않음 차트 상의 시각적 화살표, 정보 패널, 팝업 알림, 사운드 알림, 푸시 알림 포함 EA 통합 가능 (버퍼 출력 제공), 자동
    TREND HARMONY MT4 –  Multi Timeframe Trend and Phase and Pullback Level Visualizer indicator for Metatrader4 The TREND HARMONY indicator automates deep trend analysis and generates visualizations for you. Take control of your trades by eliminating uncertainty! Revolutionize your trading experience with precision and insight through the TREND HARMONY Multi Timeframe Trend Indicator – your ultimate MT4 trend visualization indicator. Are you tired of missing trading opportunities or consistently e
    Hit Rate Top Bottom Signal
    Martin Alejandro Bamonte
    히트율 탑 바텀 신호 히트율 탑 바텀 신호 히트율 탑 바텀 신호 는 완전히 혁신적인 접근 방식을 제공합니다. 특정 TP-SL과 PAIR/TF에서 어떤 성과를 내는지 미리 평가하고자 하는 분들께 이상적입니다. 전략 히트율 탑 바텀 신호 는 모든 트레이더와 모든 거래 유형 에게 필수적인 도구입니다. 이 전략은 정확한 리페인트 없는 신호 를 제공하여 언제 어떤 방향으로 거래해야 할지를 명확하게 제시할 뿐만 아니라 각 페어와 TF에 대한 상세한 성공률 기록 을 제공합니다. 사전 정의된 테이크 프로핏(TP)과 스톱 로스(SL)을 통해 신호의 효율성을 미리 알 수 있습니다 , 이는 효과적인 리스크 관리와 정확한 거래에 매우 중요합니다. 이 전략의 특징은 전체 움직임이 아닌 임펄스 내의 반전 지점을 감지하는 데 중점을 두고 있어 전통적인 탑-바텀보다 신호 발생 빈도가 높고, 시장의 주요 변동에서 핵심 순간을 포착하는 데 집중합니다. 이 전략은 SL/TP 비율과 결합된 신호의 과거 성과를
    First time on MetaTrader, introducing IQ Star Lines - an original Vedic Astrology based indicator. IQ Star Lines, an unique astrological indicator purely based on   Vedic astrology   calculations, published for the   first time on Metatrader.  This unique tool plots dynamic planetary grid lines based on real-time stars, constellations, and celestial movements, which allows you to plot the power of the cosmos directly onto your trading charts. This indicator is specifically designed for scalpers
    Core Principles Swing Angle Measurement   Swing angles are calculated by measuring the degree of price movement between swing highs and lows over time. Steeper angles (typically 45+ degrees) indicate stronger momentum and potentially more profitable trading opportunities. Traders use various timeframes to identify these patterns, from intraday charts to weekly swings. Momentum Confirmation   High degree swing angles often coincide with strong momentum indicators like RSI breakouts, volume spikes
    Gold Channel XAUUSD
    Paulo Rocha
    5 (4)
    Gold Channel is a volatility-based indicator, developed with a specific timing algorithm for the XAUUSD pair, which consists of finding possible corrections in the market. This indicator shows two outer lines, an inner line (retracement line) and an arrow sign, where the theory of the channel is to help identify overbought and oversold conditions in the market. The market price will generally fall between the boundaries of the channel. If prices touch or move outside the channel it is a tradi
    필터:
    리뷰 없음
    리뷰 답변