Trend Analysis Dashboard
- 지표
- 버전: 1.1
- 활성화: 5

The Trend Analysis Dashboard is a powerful, all-in-one technical analysis tool designed for traders who need a clear, consolidated view of market momentum across multiple timeframes. Instead of cluttering your chart with numerous separate indicators, this tool aggregates signals from four key oscillators (Stochastic, RSI, and dual CCI) into a single, easy-to-read panel.
It calculates the directional bias (Buy, Sell, or Neutral) for each enabled timeframe and provides a visual summary of overall market sentiment, helping you to identify high-probability trading opportunities based on confluence.
How It Works
The indicator operates on a simple yet powerful principle: Confluence. It analyzes the signals from four different indicators on up to nine timeframes to determine the strength and direction of the trend.
-
Data Collection: For each enabled timeframe (e.g., M5, H1, D1), the indicator gathers real-time data from:
-
Stochastic Oscillator: Compares the main and signal lines.
-
Dual RSI: Compares two RSI lines with different periods (default 14 and 15).
-
Dual CCI (Entry & Trend): Uses two CCI indicators with different periods and sensitivities to gauge both immediate entry points and the underlying trend strength.
-
-
Signal Generation: For each indicator on each timeframe, it generates a signal:
-
Buy Signal (Green): When the indicator configuration suggests bullish momentum.
-
Sell Signal (Red): When the configuration suggests bearish momentum.
-
Neutral/Wait (Yellow): When the signals are conflicting or indeterminate.
-
-
Confluence Calculation: The indicator assigns a score ( +1 for Buy, -1 for Sell) for each of the four indicators. A perfect bullish confluence on a single timeframe scores +4 , while a perfect bearish confluence scores -4 .
-
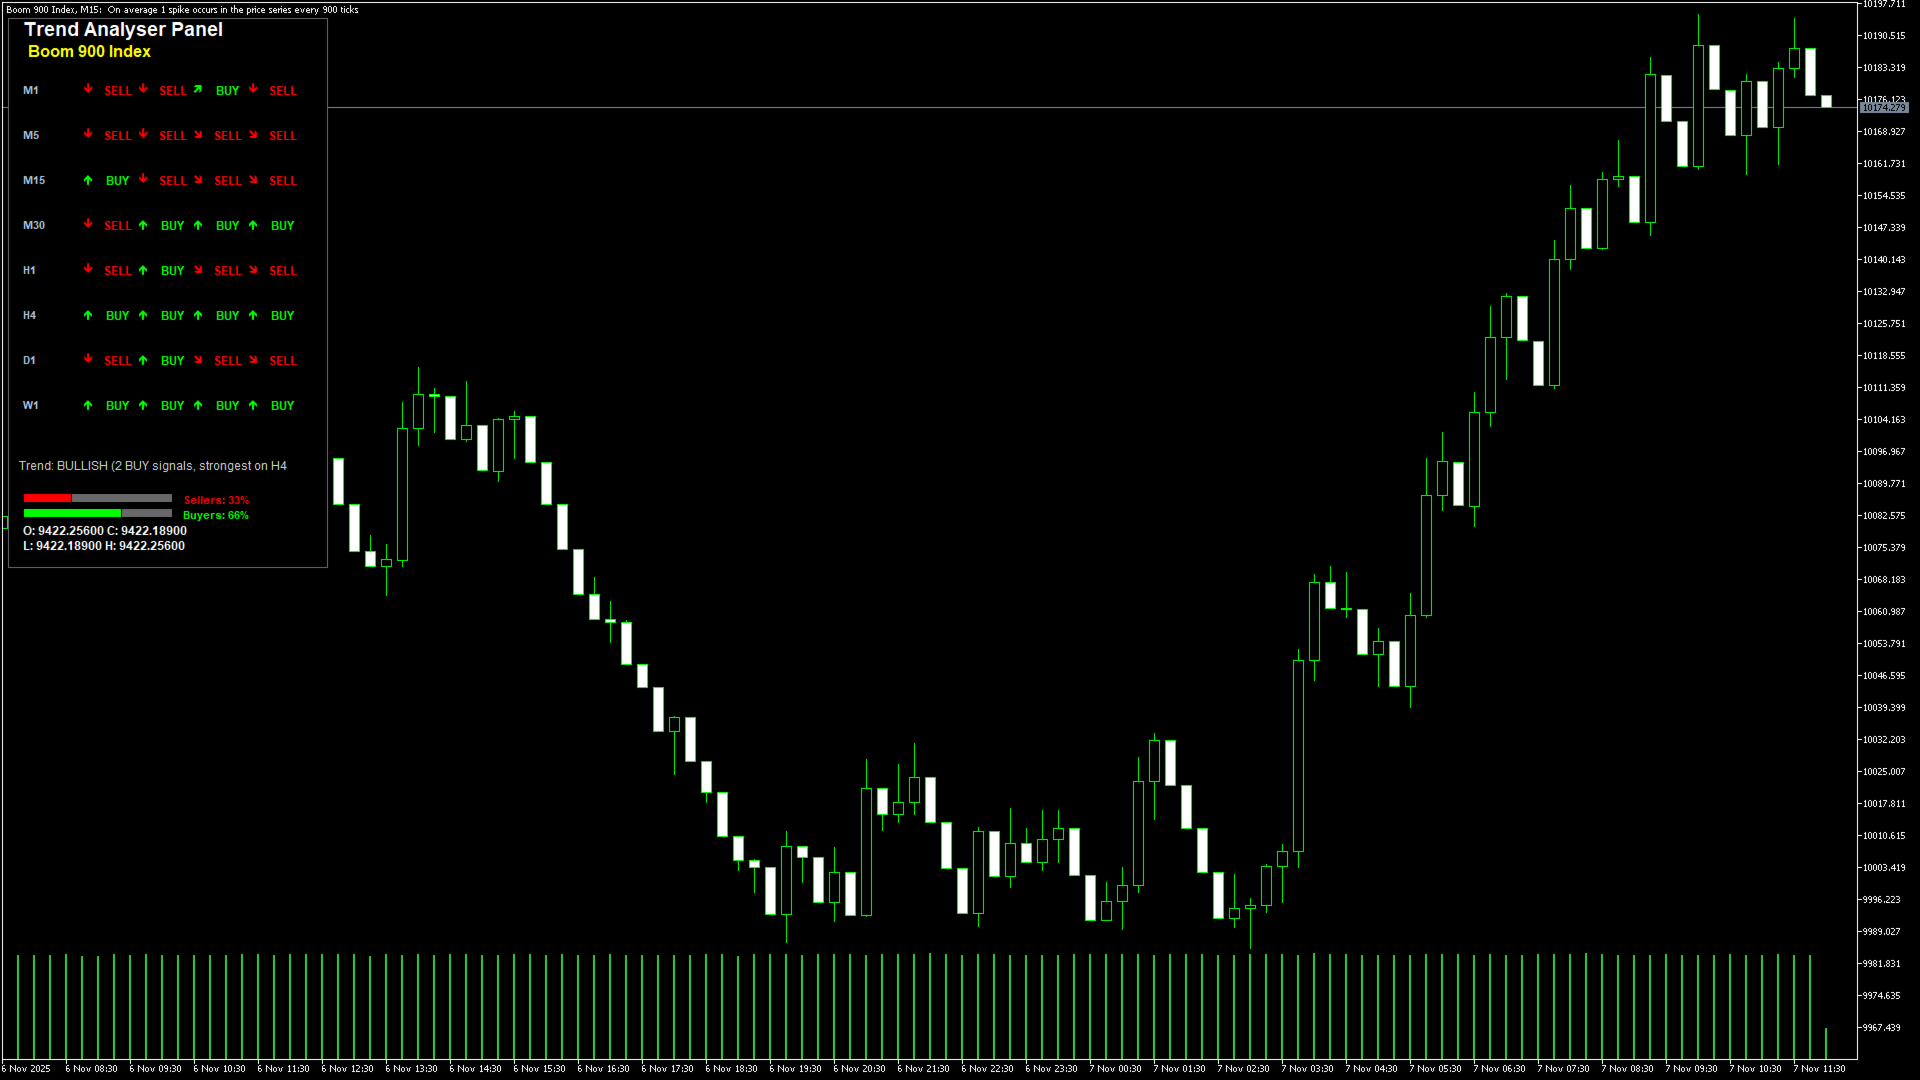
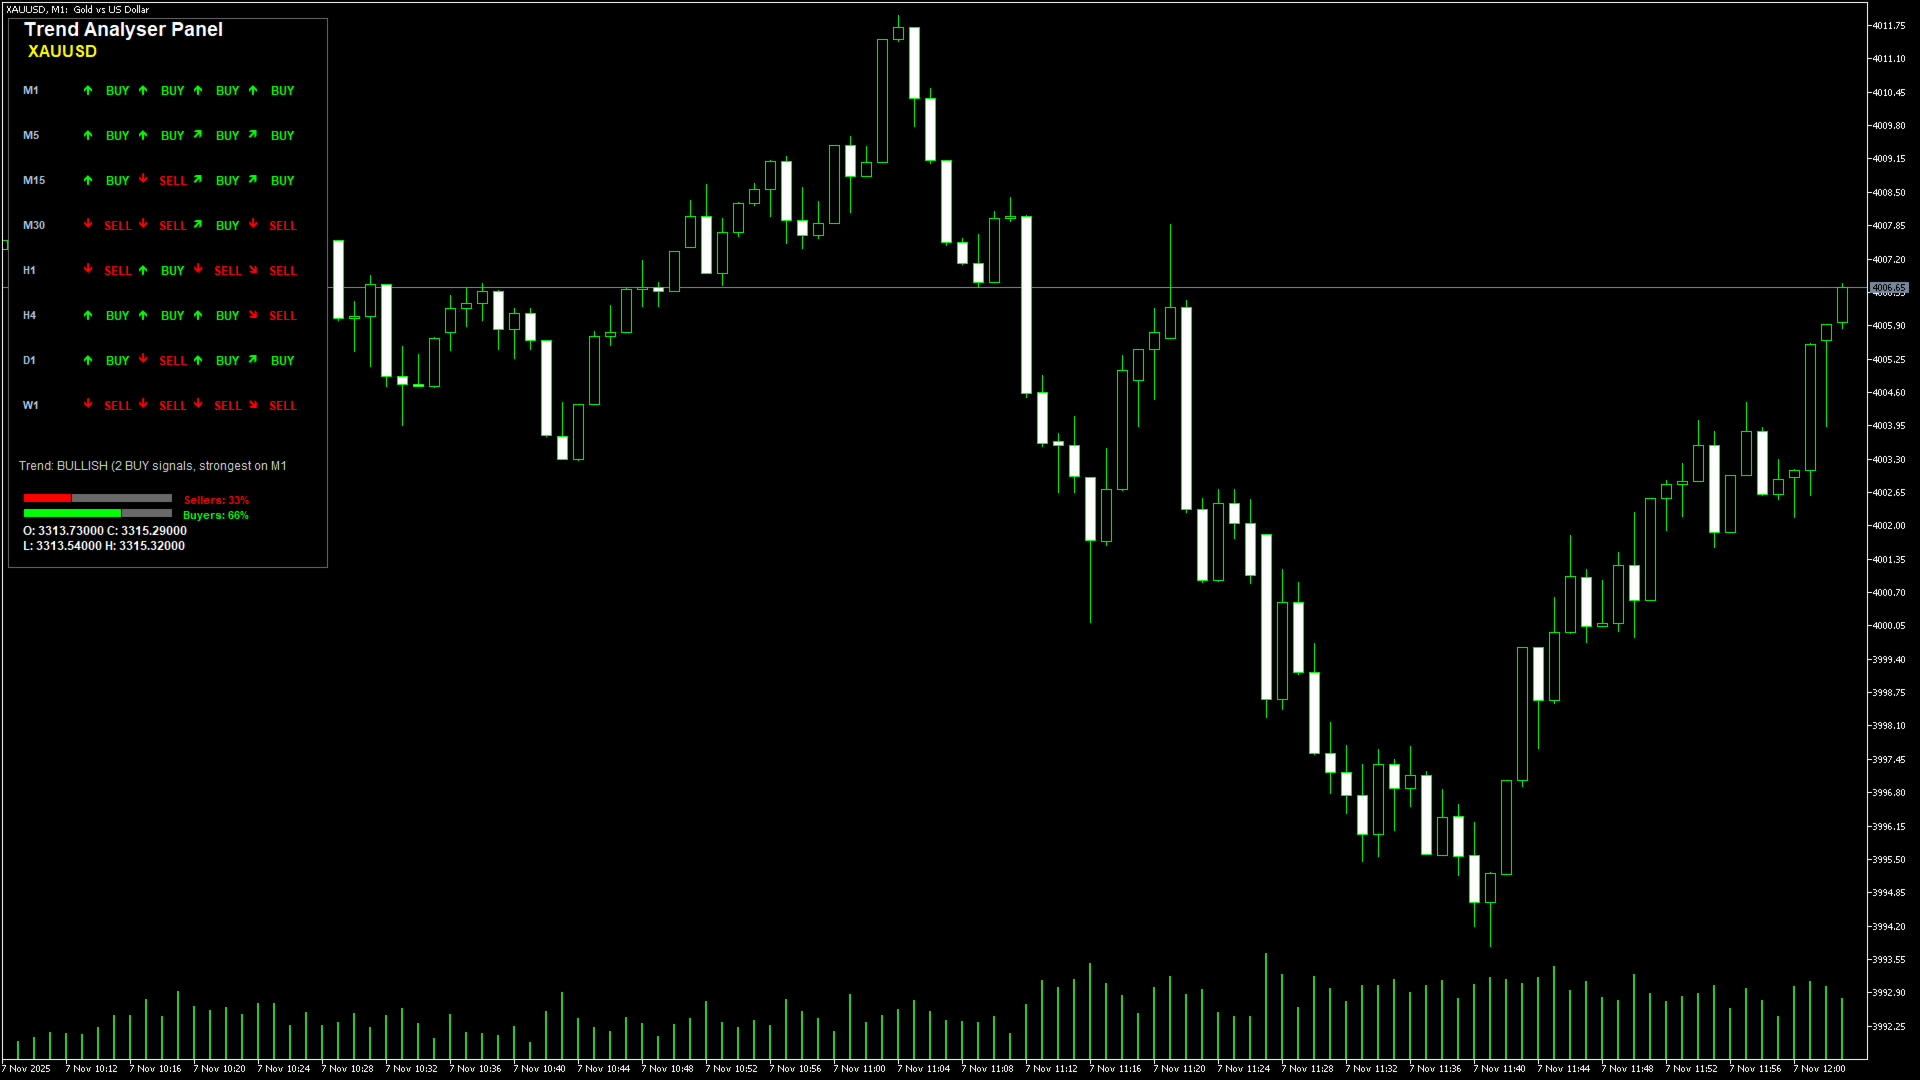
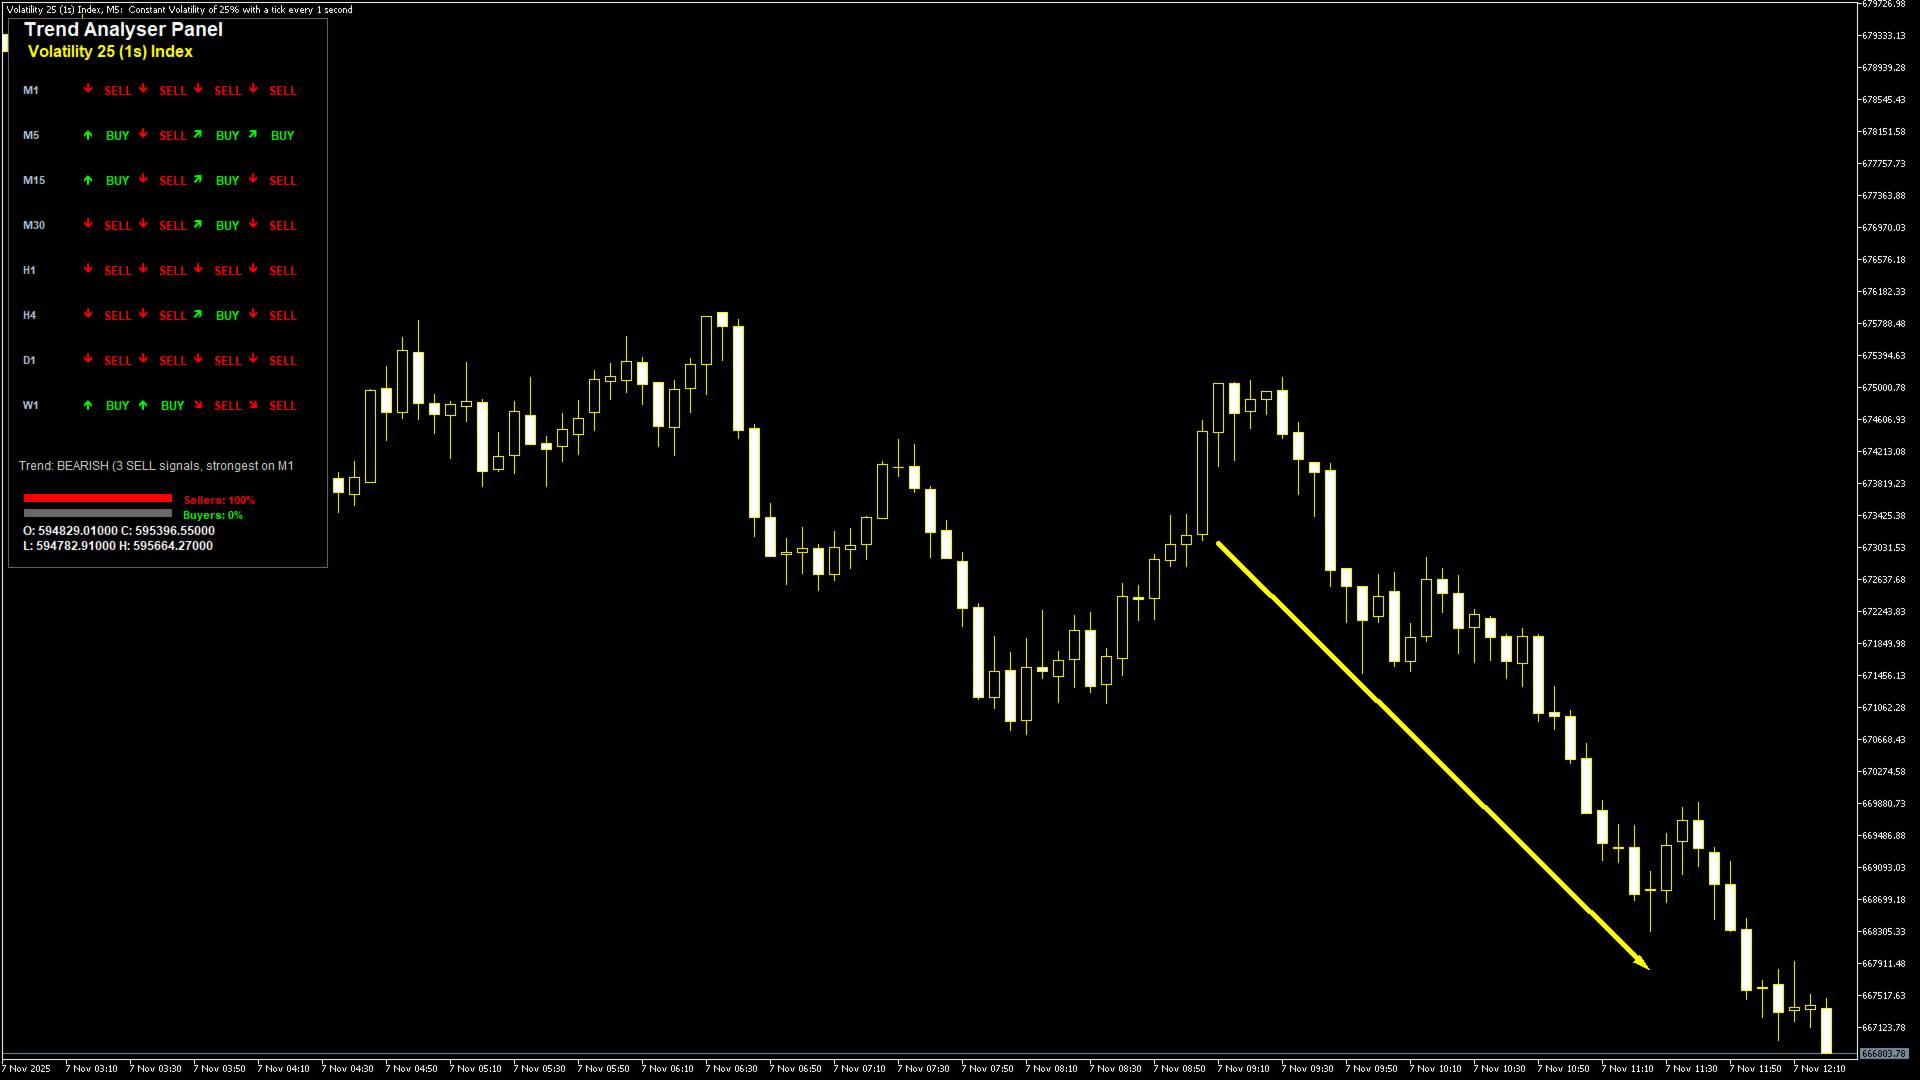
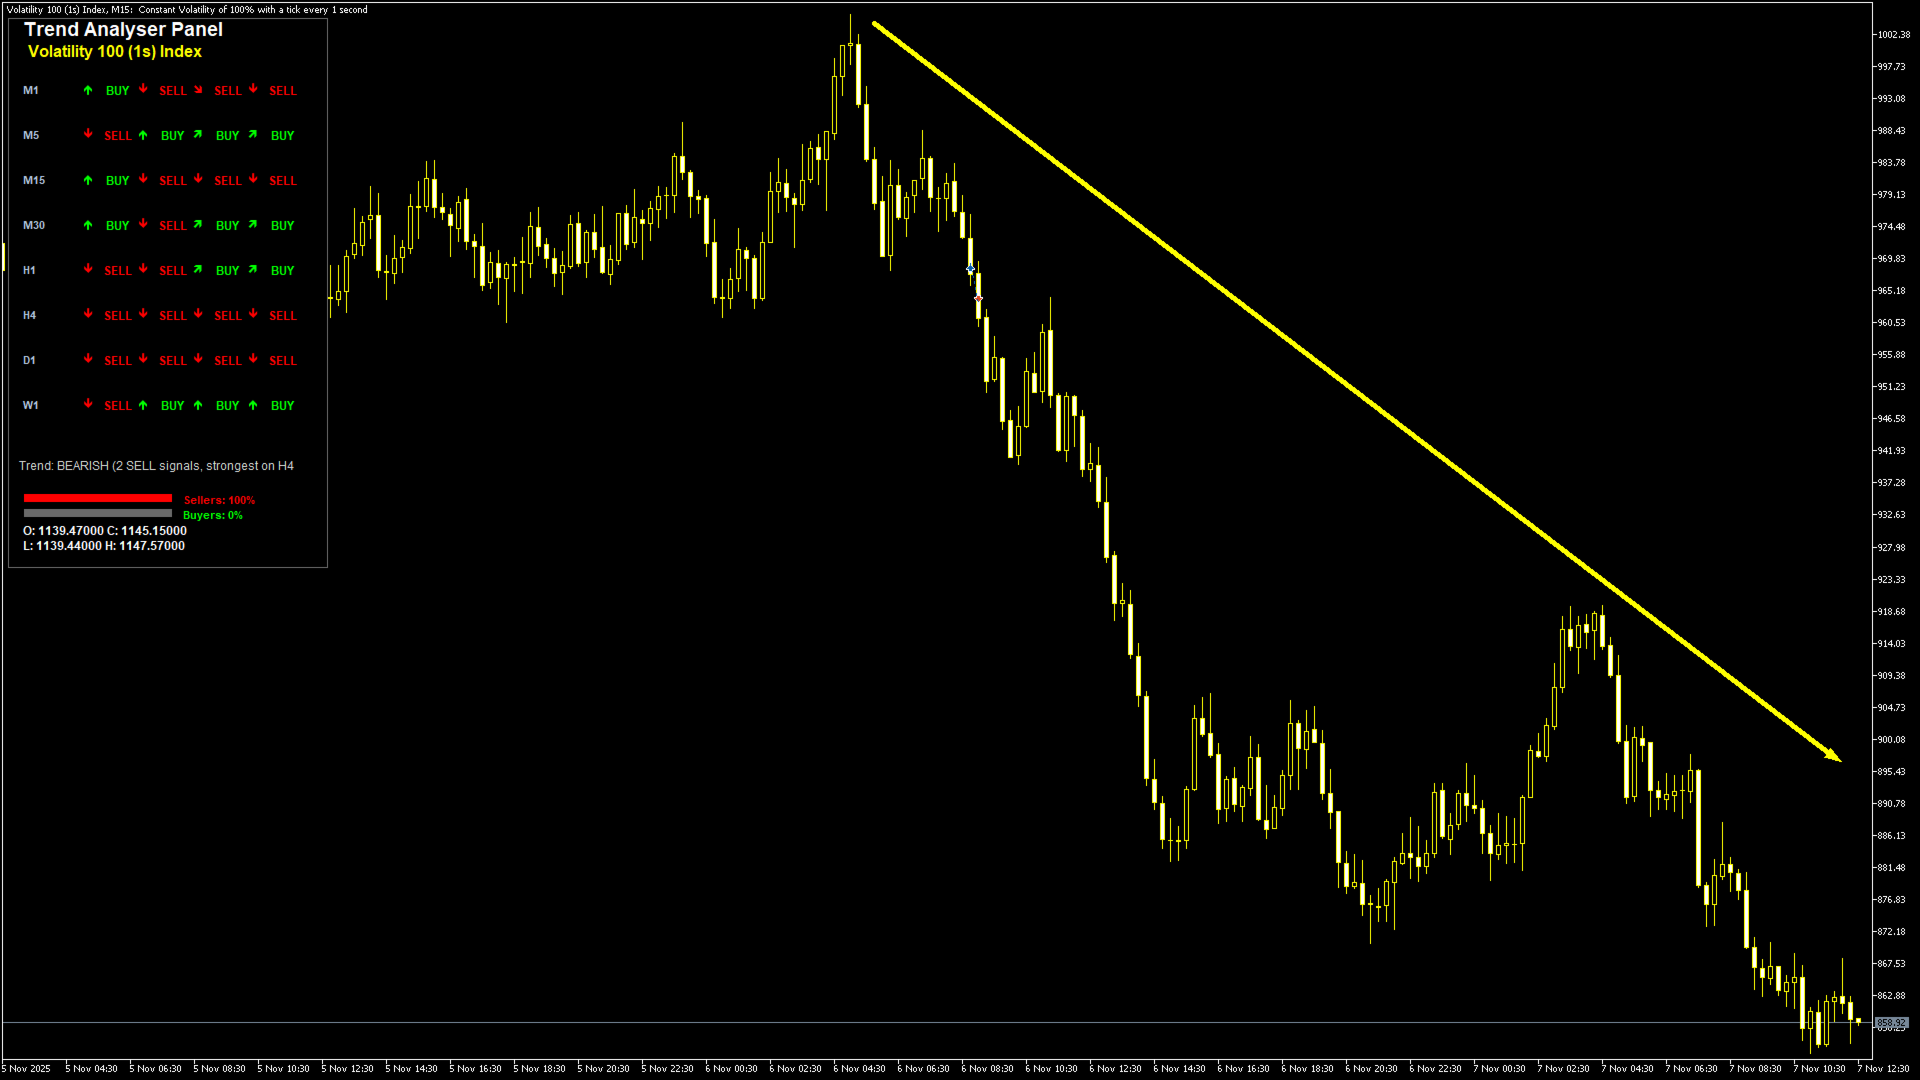
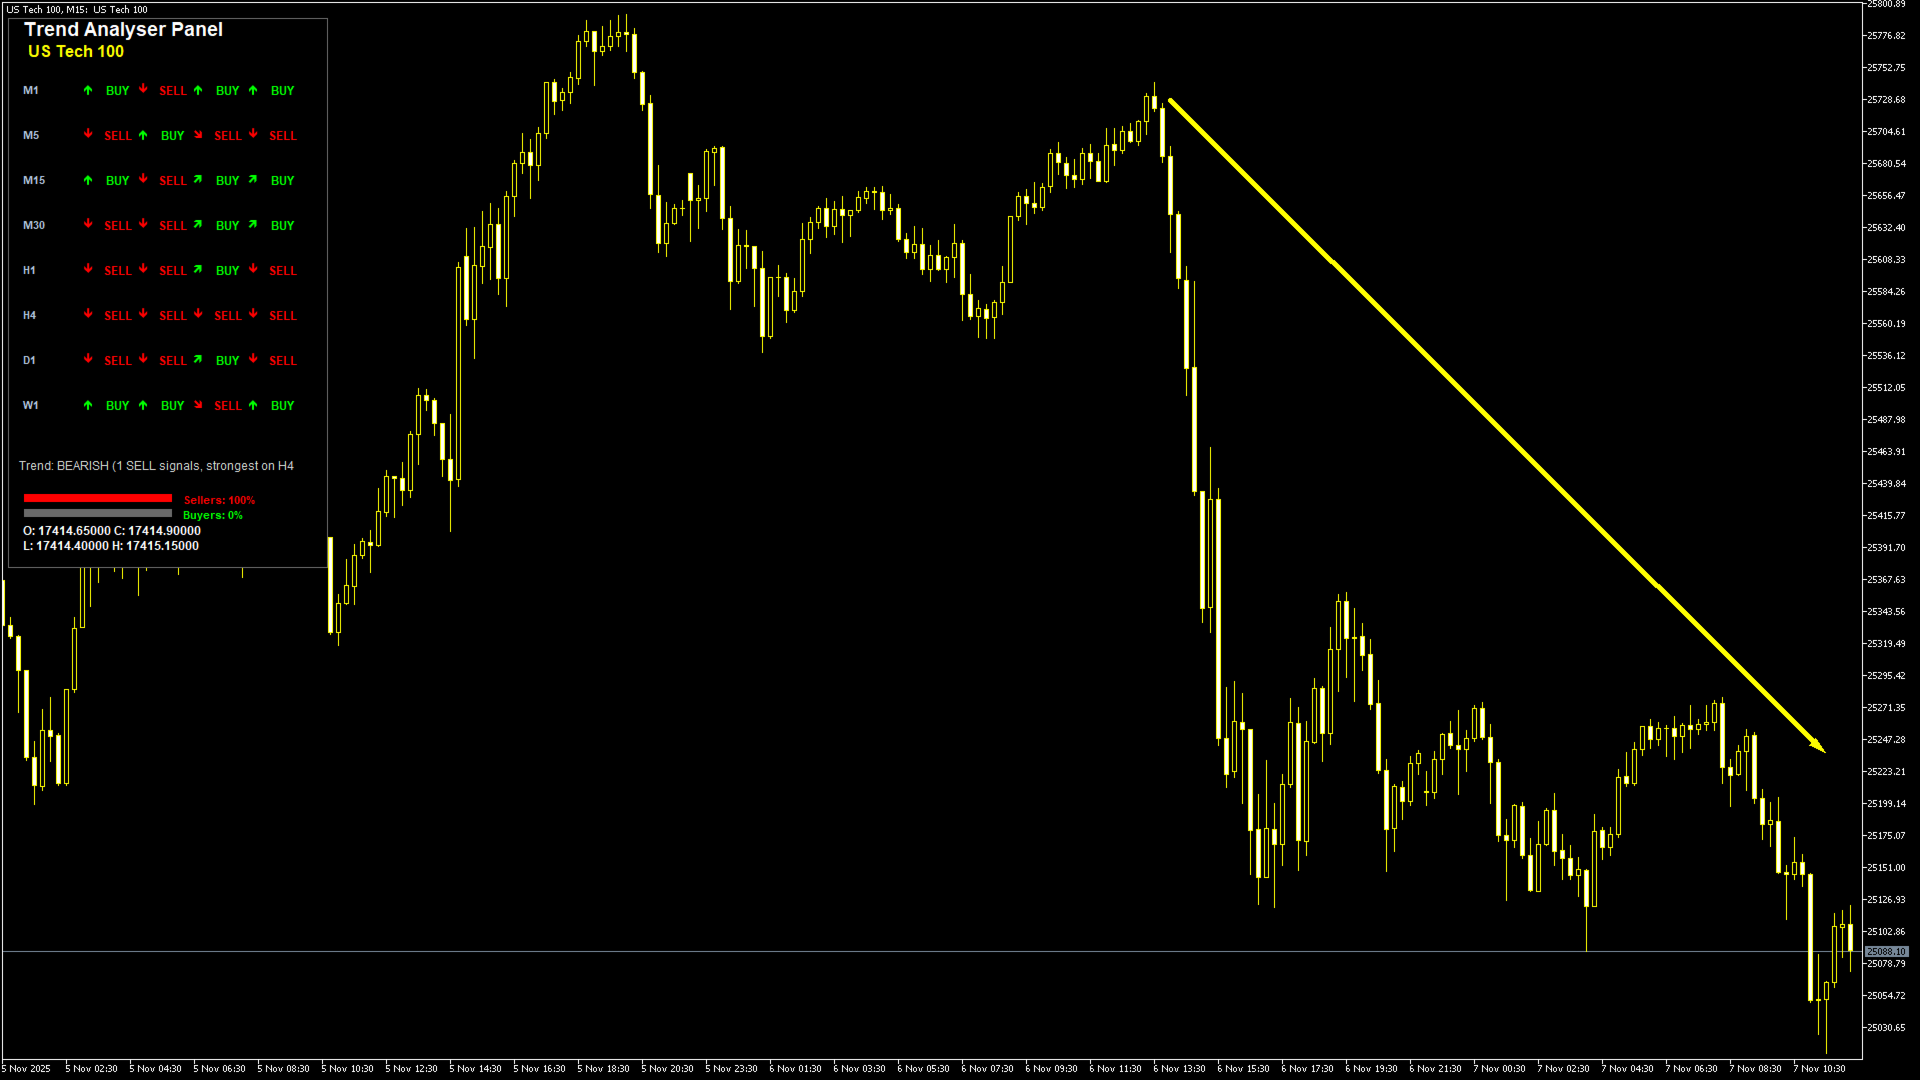
Visual Dashboard: All this information is displayed in a clean, tower-style panel on your main chart:
-
Each row represents a different timeframe.
-
Each column shows the signal from one of the four indicators.
-
The overall trend summary, buyer/seller power bars, and current price information are calculated and displayed at the bottom.
-
Key Features
-
Multi-Timeframe Analysis: Simultaneously monitor trends from 1-minute (M1) to monthly (MN1) charts. Enable or disable any timeframe according to your trading style.
-
Multi-Indicator Confluence: Combines signals from Stochastic, RSI, and two CCI indicators to filter out noise and identify high-quality signals.
-
Intuitive Visual Interface: A compact, non-intrusive dashboard rendered directly on the chart window. Features a color-coded system (Green for Buy, Red for Sell, Yellow for Neutral) for instant comprehension.
-
Comprehensive Market Summary:
-
Trend Summary Text: Clearly states if the overall trend is Bullish, Bearish, or Neutral, and identifies the timeframe with the strongest signal.
-
Buyer/Seller Power Bars: Visual percentage bars showing the balance of buying vs. selling pressure across all analyzed timeframes.
-
Real-Time Price Display: Shows the current Open, Close, High, and Low prices of the active symbol.
-
-
Flexible Alert System: Receive notifications via Push Notifications (to your MetaTrader 5 mobile app), Email, or Native Pop-up Alerts when perfect confluence (all 4 indicators agreeing) occurs on any timeframe.
-
Highly Customizable:
-
Adjust all indicator parameters (periods, slowing).
-
Choose which candle (Current or Previous) to base calculations on.
-
Full color customization for every element of the dashboard.
-
Toggle the entire panel on/off with a close button.
-