HTF Power of Three ICT

5

HTF Power of Three (ICT) -  MT5 Indicator - Version 1.1

Overview

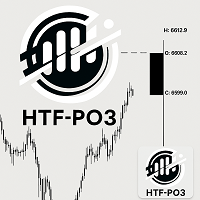
The HTF Power of Three indicator is a professional implementation of the Inner Circle Trader's (ICT) Power of Three concept, inspired by Larry Williams. This indicator visualizes higher timeframe (HTF) candle development in real-time on any lower timeframe chart, making it an essential tool for ICT traders who study institutional price movement patterns.

What is Power of Three (PO3)?

Power of Three represents a three-staged Smart Money campaign that occurs in every timeframe:

  1. ACCUMULATION - Smart money accumulates positions around the opening price
  2. MANIPULATION - Liquidity is engineered, stops are hunted, and weak hands are shaken out
  3. DISTRIBUTION - Smart money exits positions, pairing with pending interest

As ICT states: "This is applicable to every time measurement, as long as you have a beginning time, the highest value, the lowest value, and an ending in terms of measuring time."

Key Features

Visual HTF Candle Representation

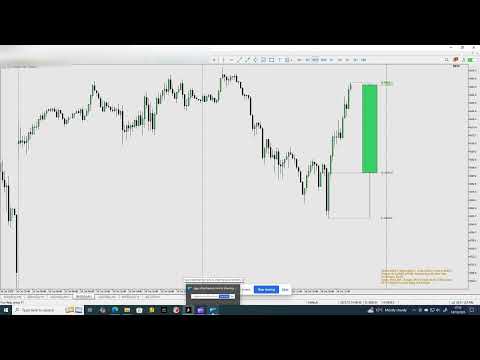
  • Displays a single, clean HTF candle on the right side of your chart (multiple instances of the indicator can be used to show 2 or more candle, but the HTF parameter must be different between instances and also the offset from last candle must be changed from the default value). 
  • Shows real OHLC (Open, High, Low, Close) with proper body and wicks
  • Color-coded: Green for bullish candles, Red for bearish candles
  • Updates in real-time as the HTF candle develops

Reference Lines System

Three intelligent reference lines connect the HTF candle to your current price action:

  1. Open Reference Line - Connects from HTF period start to the candle's open
  2. High Reference Line - Extends from candle high to current time
  3. Low Reference Line - Extends from candle low to current time

These lines provide clear visual context of the HTF range development.

Advanced Phase Analysis 

This is what sets this version apart from others! The indicator includes intelligent PO3 phase detection displayed in the info panel:

  • ACCUMULATION - First third of HTF candle (0-33% completion)
  • MANIPULATION - Middle third, especially when price reaches extremes (33-66% completion)
  • EXPANSION - Active range development during manipulation phase
  • DISTRIBUTION - Final third of HTF candle (66-100% completion)

This automated phase analysis helps you understand WHERE you are in the institutional cycle at any moment.

Real-Time Countdown

The indicator shows exactly how many candles remain before the current HTF candle closes, allowing you to:

  • Time your entries with precision
  • Avoid entering late in the HTF cycle
  • Anticipate new HTF candle formation
  • Plan exits before distribution completes

Comprehensive Info Panel

Displays all critical information:

  • Current HTF timeframe and ratio (e.g., "H4 - Ratio: 1:4")
  • Candle type (Bullish/Bearish)
  • Range and body size in pips
  • Phase analysis (current PO3 stage)
  • Progress percentage and candle count
  • Countdown (candles remaining)
  • All OHLC price levels

Parameters

Higher Time Frame to represent (default: PERIOD_H4)

  • Select the Higher Time Frame to monitor
  • Available options: M1, M5, M15, M30, H1, H4, D1, W1, MN1
  • Must be higher than your current chart timeframe
  • The indicator automatically calculates the candle ratio

Examples:

  • Chart M5 + HTF H1 = 1:12 (12 M5 candles = 1 H1 candle)
  • Chart H1 + HTF H4 = 1:4 (4 H1 candles = 1 H4 candle)
  • Chart M15 + HTF D1 = 1:96 (96 M15 candles = 1 D1 candle)

Visual Settings

Offset from last candle (pixels) (default: 20)

  • Distance in pixels from the last chart candle to the HTF candle
  • Adjust to position the candle where you prefer on the right side

Candle width in pixels (default: 8)

  • Width of the HTF candle in pixels
  • Increase for better visibility, decrease for a more compact display

Bullish Candle Color (default: Lime)

  • Color for bullish HTF candles (Close > Open)

Bearish Candle Color (default: Red)

  • Color for bearish HTF candles (Close < Open)

Wick Color (default: Gray)

  • Color for candle wicks (upper and lower)

Outline Color (default: Black)

  • Color for the candle body outline

Show Candle Outline (default: true)

  • Toggle the black outline around the candle body

Reference Lines Settings

Show candle outline (default: true)

  • Enable/disable all three reference lines

    Connection lines color (default: Red)

    • Color for the connection lines

    Reference Line Style (default: STYLE_DOT)

    • Line style: STYLE_SOLID, STYLE_DASH, STYLE_DOT, STYLE_DASHDOT, STYLE_DASHDOTDOT

    Labels & Info Panel

    Show OHLC labels (default: true)

    • Display OHLC price labels next to the HTF candle

    Show info panel (default: true)

    • Display the comprehensive information panel

    Price label color (default: White)

    • Color for all text labels

    Price Label Font Size (default: 8)

    • Font size for labels and info panel

    Label Font (default: "Arial")

    • Font type for all text

    Info panel corner (default: CORNER_RIGHT_UPPER)

    • Position of the info panel on chart
    • Options: CORNER_LEFT_UPPER, CORNER_RIGHT_UPPER, CORNER_LEFT_LOWER, CORNER_RIGHT_LOWER

    Advanced Features

    Show countdown timer in info panel (default: true)

    • Display remaining candles until HTF candle closes
    • Essential for timing entries and exits

    Alert on new HTF candle (default: false)

    • Alert notification when a new HTF candle starts
    • Useful for multi-timeframe monitoring

    Why This Version is Superior

    Intelligent Phase Analysis

    Unlike basic HTF candle indicators that only show OHLC levels, this version includes automated PO3 phase detection. You can instantly see whether Smart Money is in:

    • Accumulation phase (building positions)
    • Manipulation phase (hunting stops, creating liquidity)
    • Expansion phase (active trend development)
    • Distribution phase (exiting positions)

    This analysis is based on time progress through the HTF candle and price position relative to the range, giving you institutional-level insight.

    Precision Countdown Timer

    The real-time countdown shows exactly how many candles remain before the HTF cycle completes. This is crucial because:

    • Entering during distribution (late stage) is high risk
    • Entering during accumulation (early stage) offers better R:R
    • You can anticipate manipulation phases
    • You know when to expect new HTF candle formation

    Complete Visual Context

    The three reference lines system provides unmatched clarity:

    • See exactly where the HTF period started
    • Understand how far price has travelled
    • Identify key institutional levels
    • Spot accumulation and distribution zones instantly

    Professional-Grade Implementation

    • Clean, non-cluttering single candle display
    • Pixel-perfect positioning that doesn't interfere with price action
    • Proper error handling (validates HTF > Chart TF)
    • Resource-efficient code
    • Compatible with all MT5 builds

    Use Cases

    Scalping & Day Trading

    • Use M15 or H1 HTF on M1/M5 charts
    • Enter during accumulation, exit before distribution
    • Use countdown to time precise entries

    Swing Trading

    • Use H4 or D1 HTF on H1/H4 charts
    • Identify larger institutional cycles
    • Avoid late entries by monitoring phase and countdown

    Multi-Timeframe Analysis

    • Stack multiple instances with different HTF settings
    • Monitor H1, H4, and D1 simultaneously on M15 chart
    • Align entries with multiple HTF cycles

    Backtesting & Study

    • Use MT5 Strategy Tester replay mode
    • Study historical PO3 patterns
    • Understand how institutions moved price
    • Perfect for ICT Mentorship students

      Tips for Best Results

      • Match HTF to your trading style: Scalpers use H1/H4, Swing traders use D1/W1
      • Use phase analysis: Only enter during accumulation phase for best R:R
      • Watch the countdown: Avoid entries when fewer than 30% of candles remain
      • Combine with other ICT concepts: Order blocks, Fair Value Gaps, Liquidity pools
      • Study in replay mode: Best way to learn PO3 patterns

      Support & Updates

      This indicator is designed for serious ICT traders who understand institutional price delivery. The phase analysis and countdown features make it an indispensable tool for timing entries within the Power of Three framework.

      Disclaimer: This indicator is for educational purposes. Always practice proper risk management and never risk more than you can afford to lose.

      Avis 2
      Lierson José
      180
      Lierson José 2026.03.18 15:28 

      Excelent job bro! Let's go!

      man1980
      2507
      man1980 2026.01.17 01:12 

      The HTF PO3 indicator does a great job of identifying higher time frame market phases like accumulation, manipulation and expansion. it's especially useful for intraday traders because it adds clear context and helps avoid trading during trap conditions. When combined with smart money concepts, it works well as a bias and timing tool rather than an entry signal. overall it's a solid indicator for traders who want better structure and patience in their trading.

      Produits recommandés
      This Volume Delta Profile is an advanced MetaTrader 5 indicator that visualizes   volume delta (order flow imbalance)   using a volume profile-style histogram. It shows the difference between buying and selling pressure at specific price levels, helping traders identify supply and demand zones. This indicator provides a unique perspective on market dynamics by visualizing the imbalance between buying and selling pressure, offering insights beyond traditional volume analysis. Core Concept Positiv
      The MarketProfileTPO indicator for MetaTrader 5 is a powerful tool designed to bring the Market Profile concept, based on Time Price Opportunity (TPO) analysis , directly onto your main chart window. This indicator calculates and displays the price distribution over a specified period, highlighting key areas of market activity and concentration. It is particularly optimized for high-volatility instruments like NAS100, US30, and XAUUSD when used on the M1 (1-minute) timeframe, offering a detailed
      Les marchés réagissent aux données macroéconomiques, et non aux lignes techniques. Lorsque des statistiques à fort impact comme le NFP, l'IPC (CPI) ou le PIB tombent, les indicateurs traditionnels de price action sont instantanément balayés. L' USD Economic Strength Index est une matrice d'élite de calibre institutionnel, développée nativement pour MetaTrader 5. Au lieu de vous appuyer sur des sites web externes ou des calculs manuels, ce tableau de bord optimisé capture, analyse et pondère auto
      Includes almost all the concepts related to Volume Profile: POC , Value Area , Developing POC , Anchored VWAP , Volume Delta ; since the “Total” in its name. It is fast in its calculations and simple to work with. Features: 1.    Selectable calculation timeframe to find most traded levels. 2.    Capable of calculating Volume Profile based on tick data 3.    Adjustable histogram bars by their count. 4.    Adjustable histogram bars by their height (price range). 5.    Showing Value Area (VA

      The "MR Volume Profile 5" indicator is a charting tool that displays trading volume at different price levels rather than time intervals. A key concept in volume profile is the point of control (POC)—the price level with the highest volume traded during the session or time range. While tools like VWAP or OBV provide volume trends, the "MR Volume Profile 5" indicator offers granular detail about where the most market activity occurs at specific price levels. This makes it a more precise tool for
      Price Volume Trend (PVT) Oscillator Description:  The PVT Oscillator is a volume indicator that serves as an alternative to the standard On-Balance Volume (OBV). While ordinary volume indicators can be noisy and hard to read, this tool converts volume flow into a clear Histogram Oscillator, similar to a MACD, but for Volume. It is designed to detect first  Trend Reversals and Divergences by analyzing the difference between a Fast and Slow PVT moving average. Why is this better than standard OBV?
      FREE
      # Smart Market Structure Suite The **Smart Market Structure Suite** is a technical analysis utility for MetaTrader 5 that integrates four distinct structural engines into a unified charting workspace. By combining structural high-low pivots, institutional order blocks with support-resistance flips, momentum-driven supply/demand zones, and divergence-proof oscillator levels, this utility helps traders identify key horizontal boundaries, order flow footprints, and structural transitions. The eng
      Trader Nakal Basic – Smart POC & Trend Reversal System Fitur Utama Dynamic Point of Control (POC): Menghitung level harga dengan volume akumulasi tertinggi secara otomatis dari jam pembukaan pasar ( Asia/Jakarta Session ) lengkap dengan penyesuaian otomatis Season DST/Winter. EMA/SMA Trend Crossover Signal: Memberikan konfirmasi arah tren terkini melalui persilangan garis EMA 9 dan SMA 21. Automatic ATR Stop Loss & Take Profit: Secara otomatis mengkalkulasi dan menampilkan garis acuan Stop Lo
      Volume Delta Scanner MT5
      Mariusz Franciszek Szczepanczyk
      Folume Delta Scanner MT5 Volume Delta Scanner is in real-time merkscanner-yndikator foar MetaTrader 5 dy't meardere symboalen en tiidframes tagelyk kontrolearret fanút ien paniel. Ynstee fan manuell te wikseljen tusken grafiken, krije jo yn ien eachopslach in direkt oersjoch fan keap- en ferkeapdruk oer jo heule watchlist. De yndikator is boud op Volume Delta-logika - it berekkent it ferskil tusken keap- en ferkeapdruk op basis fan kearsstruktuer en tickvolume, wêrtroch jo in direkt en ûnfilt
      Was: $249  Now: $99   Market Profile defines a number of day types that can help the trader to determine market behaviour. A key feature is the Value Area, representing the range of price action where 70% of trading took place. Understanding the Value Area can give traders valuable insight into market direction and establish the higher odds trade. It is an excellent addition to any system you may be using. Inspired by Jim Dalton’s book “Mind Over Markets”, this indicator is designed to suit the
      The Accumulation and Distribution indicator is a volume-based indicator that was essentially designed to measure underlying supply and demand. This is accomplished by trying to determine whether traders are actually accumulating (buying) or distributing (selling). This is accomplished by plotting a cumulative total of the money flow volume for each period. This indicator can reveal divergences between volume flow and actual price to primarily affirm a current trend or to anticipate a future reve
      VeloTicker PRO — Real-Time Flow Reading VeloTicker PRO is an advanced indicator designed for traders looking to interpret market dynamics beyond just price. With an intuitive visual interface based on dual gauges (BUY vs. SELL), it transforms market flow into clear signals, enabling faster and more precise decision-making. What It Delivers Instant reading of buying and selling pressure Clear visualization in a gauge (speedometer) format Rapid response to market changes Intelligent smoot
      French Cet indicateur agit comme un assistant d'analyse graphique avancé pour les traders qui aiment trader les figures graphiques (Chart Patterns). Il est conçu pour réduire la charge de l'analyse visuelle et augmenter la précision de la prise de profit. Caractéristiques principales de cet indicateur du point de vue de l'utilisation pratique : 1. Détection automatique des figures (Automated Pattern Detection) Gain de temps et réduction des biais : Vous n'avez pas besoin de tracer manuellement d
      VSA Fusion Structure Pro
      Ahmad Mahmoud Khalil Al Biss
      VSA Fusion Structure Pro Volume Spread Analysis and Market Structure for MetaTrader 5 VSA Fusion Structure Pro is a technical analysis indicator that combines Volume Spread Analysis (VSA), Break of Structure (BOS), Change of Character (CHoCH), Order Blocks (OB), and Fair Value Gaps (FVG) in a single chart-based system. The indicator helps traders examine the relationship between trading activity, candle spread, price structure, and potential support and resistance zones. It provides visual marke
      Read detailed post with screenshots here: https://www.mql5.com/en/blogs/post/771350 Features (What the indicator does for you) Detects both bullish and bearish Cups:   Finds the classic “cup‑and‑handle” and its upside‑down version. Mathematical cup shape:   Uses quadratic regression to make sure the cup looks like a smooth “U” rather than a jagged “V”. Two entry line options:   Horizontal resistance line or a slanted trend‑line that follows the left‑rim to right‑rim. Custom price source:   Choo
      Volume Vacuum Profile
      Gleidson Duca De Aguiar
      Launch price: 30 USD - price will increase after the first purchases, so early buyers lock in this rate. Volume Vacuum Profile is a session-by-session Volume Profile indicator for MetaTrader 5. It combines the daily Point of Control (POC), a full volume histogram and automatic Low Volume Node (LVN) detection - the liquidity vacuum zones where price tends to move fast due to a lack of resting orders. Key features: - Volume histogram built from 1-minute data for each trading day, independent of
      Normalized OBV
      Jose Miguel Soriano
      When looking at the information of On Balance Volume indicator, a question arises: is it a strong or weak movement? Should it be compared with previous days? These data should be normalized to always have a reference. This indicator presents the followings parameters: Normalization period (Max-Mins absolute) Smoothing period (-1 off) Tick/Real Volume Maximum number of bars to calculate (-1 off) Upper value normalization Lower value normalization Calculation: normOBV = (value - absMin) * (relMax
      XAUUSD OrderFlow Structure AutoPOC Pro is an advanced MetaTrader 5 indicator designed to analyze market structure, order flow, buying and selling pressure, liquidity, and volume distribution directly on the chart. The indicator is especially focused on XAUUSD (Gold) analysis, although it can also be used with other instruments available in MetaTrader 5. Its objective is to bring together several analytical tools that would normally require multiple indicators: market structure, BOS and CHOCH, Or
      No Demand No Supply MT5
      Trade The Volume Waves Single Member P.C.
      No Demand No Supply   This indicator identifies   No Demand –No Supply candles to your chart and plots volume bars colored according to the signal. It can be applied to all timeframes or to a specific one only. It can also be used as regular volume indicator  with exceptional future of WEIGHTED VOLUME. Furthermore is has an alert notification, sound and email when a signals occurs. The indicator does not repaint but the alert will come on two candles back due to the definition of No Demand No Su
      VPO Profile MT5
      Kyra Nickaline Watson-gordon
      5 (2)
      Definition : VPO is a Volume Price Opportunity. Instead of using bars or candles with an Open, High, Low, and Close price, each "bar" in a Market Profile is represented by horizontal bars against the price It is called Market Profile terminology. In other words volume-price-opportunity (VPO) profiles are histograms of how many volumes were traded at each price within the span of the profile. By using a VPO chart, you are able to analyze the amount of trading activity, based on volume, for each
      VibeFox Volume Profile — Volume Profile pour MetaTrader 5 VibeFox Volume Profile est une boîte à outils complète de Volume Profile pour MetaTrader 5. Elle construit la distribution horizontale du volume négocié le long du prix, afin que tu voies instantanément où le marché a concentré le plus d'activité, où il a peu négocié et quels niveaux de prix sont susceptibles d'agir comme des aimants ou des barrières. Chaque profil est dessiné directement sur le graphique et contrôlé depuis un panneau mod
      LevelsHunter Pro
      Dmitrii Kovalevskii
      LevelsHunter Pro – Profil de Volume Professionnel avec Analyse Historique Qu'est-ce que c'est ? LevelsHunter Pro est un indicateur de profil de volume qui non seulement affiche les niveaux actuels POC, VAH et VAL, mais vous permet également de   remonter dans le temps   et de voir où se trouvaient ces niveaux au moment de n'importe quelle transaction passée. Ce n'est pas un outil pour deviner sur le graphique. C'est pour   l'analyse à froid   de ce qui s'est déjà passé. Pourquoi un trader en a b
      The package consists of two MetaTrader 5 indicator files that are normally placed together on the chart: TudasInstantAnalysis.mq5   — the "top" indicator, drawn over price on the main chart. TudasDownCombined.mq5   — the "bottom" indicator, an independent subwindow below the chart. The logic has been calibrated, and continues to be calibrated, against real XAUUSD data. Part 1 — Top Indicator:   TudasInstantAnalysis.mq5 1.1 EMA Ribbon — moving-average ribbon Trend "by eye" on candles is easy t
      SMART EXIT Currency Strength Meter is a professional Forex currency strength indicator designed to identify the strongest and weakest currencies in real time. The indicator analyzes 27 major Forex pairs and ranks the 8 major currencies according to their relative strength. By combining EMA momentum analysis with volatility-adjusted calculations, traders can quickly identify market leaders and laggards without manually reviewing dozens of charts. Main Features • Real-time ranking of the 8 major c
      Le Volume Profile est l'un des outils analytiques les plus puissants utilisés par les traders professionnels et institutionnels. Contrairement aux indicateurs de volume traditionnels qui montrent uniquement le moment où les transactions se sont produites en bas de votre écran, le Volume Profile montre exactement à quels niveaux de prix ces transactions ont eu lieu. Cela vous donne une vision radiographique claire de la structure du marché, vous permettant de voir exactement où la smart money (ar
      ICT Silver Bullet Indicator is designed to make trading the Silver Bullet strategy easier and more efficient. It combines all key parts of the ICT Silver Bullet method and highlights them on the chart, so you can focus on placing trades. Each feature is highly customizable, allowing you to adjust settings and visuals to match your trading style and preferences. The control panel lets you quickly hide or show specific tools for clearer analysis. The indicator also includes an alert system that n
      - All of my indicators are just 30$ !! Limited offer. Contact me for extra bonus   indicator, instruction or any questions! - Lifetime update free - Non-repaint - Plus Free Filtering Indicator  - Related product: Gann Gold EA - I just sell my products in Elif Kaya Profile, any other websites are stolen old versions, So no any new updates or support. Advantages of  M1 Scalper Pro  Profitability: M1 Scalper Pro is highly profitable with a strict exit strategy. Frequent Opportunities: M1 Scalper
      Buy Sell Smart
      Syamsurizal Dimjati
      BUY and SELL smart The BUY and SELL Smart Indicator is a next-generation trading tool engineered for precision scalpers, intraday strategists, and professional analysts who demand both speed and clarity in market visualization. It seamlessly integrates smart candle-based analytics, adaptive ATR logic, and real-time economic event awareness — giving you a fully synchronized view of market volatility and momentum. Through an elegant and optimized interface, FlashScalp delivers   instant signal fee
      TRI Visualizer
      Yoshimi Mon 三 Ura
      TRI Visualizer MT5 – Thermodynamic Market Analysis Overview The TRI (Thermal Range Indicator) Visualizer Enhanced is a rare market analysis indicator that goes beyond conventional technical analysis, applying principles of thermodynamics from physics. It interprets market price fluctuations as “thermodynamic energy,” enabling the highly accurate detection of subtle market changes that are often overlooked. Innovative Mechanisms 1. Dual Calculation Engines Classic TRI Mode Formula: |Close
      Bar Size Pro
      Makarii Gubaydullin
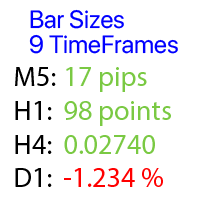
      Calcule la variation de prix sur chaque timeframe : barres flottantes ou dernières barres fermées. Utilitaire multifonctionnel : 66+ fonctionnalités, incluant cet outil  |   Contactez-moi  si vous avez des questions  |    Version MT4 Vous pouvez sélectionner le   décalage   de la barre calculée : Barres flottantes (actuelles); Dernières barres fermées (précédentes); Le type de valeur de prix   peut être sélectionné avec le commutateur bleu en haut : Pips; Points de marché; Valeur en pourcentage
      Les acheteurs de ce produit ont également acheté
      Trend Sniper X
      Sarvarbek Abduvoxobov
      4.86 (44)
      Trend Sniper X est un indicateur de suivi de tendance multi-unités de temps pour MetaTrader 5 qui aide les traders à identifier la direction de la tendance et les points d'inversion potentiels avec clarté et précision. pour MT4: https://www.mql5.com/en/market/product/193245 Informations sur le prix : Le prix actuel est un prix promotionnel et est susceptible de changer lors des prochaines mises à jour et nouvelles fonctionnalités. Offre bonus : Pour obtenir GRATUITEMENT l'Auto-Trade Assistant E
      Un nouveau Roi en ville - Indicateur + Gestion des ordres (TP1 + TP2 + TP3) + Envoi optionnel de signaux Telegram INCLUS (GRATUIT) (SYSTÈME COMPLET DE TRADING et DE SIGNAUX) Notre meilleur EA pour l’Or : Gold Slayer Cet indicateur inclut une stratégie avancée, un système de trading avec gestion des ordres personnalisable ainsi qu’un système de retour à la moyenne combinant des extensions d’enveloppes, soutenu par plusieurs filtres intelligents de confirmation comme le RSI afin de détecter des en
      Smart Trend Trading System — MetaTrader 5 Après votre achat, envoyez-moi un message sur MQL5 pour recevoir GRATUITEMENT Smart Universal Expert Advisor, ainsi que le cours en ligne, le manuel PDF et l’accès au groupe privé. STTS réunit la direction de la tendance, les signaux d’entrée et de sortie, les zones de retournement et les niveaux de prix importants directement sur votre graphique. Suivez le système manuellement ou connectez un EA compatible distinct pour une exécution automatique selon l
      Entry Points Pro vous montre où entrer, où placer le stop et avec quel lot trader — avant que vous ne passiez l'ordre. PRIX Actuellement 199 USD : 10 exemplaires à ce prix, ensuite 249 USD. Le prix final est de 349 USD. Je gagne ma vie en tradant sur les marchés, et je le montre, donc je n'ai pas besoin de vendre cet indicateur à tout le monde. C'est un outil pour les traders qui réfléchissent par eux-mêmes, pas un bouton magique. La flèche apparaît à la clôture de la bougie et ne se redessine
      Ultra Indicator
      Ihor Otkydach
      5 (1)
      ULTRA est un indicateur technique « tout-en-un » : il analyse le marché de manière autonome, génère des signaux de trading, affiche les niveaux permettant de définir des ordres stop-loss et suggère le moment opportun pour clôturer les positions afin de sécuriser les bénéfices ou de minimiser les pertes. En d'autres termes, peu importe que vous ne sachiez pas analyser le marché, déterminer les niveaux (où placer votre stop-loss) ou que vous ayez du mal à gérer votre capital. ULTRA s'occupera de t
      SuperScalp Pro
      Van Minh Nguyen
      4.54 (37)
      SuperScalp Pro - Professional Multi-Layer Confluence Scalping System SuperScalp Pro est un indicateur de scalping avancé qui améliore le Supertrend classique grâce à plusieurs filtres intelligents de confirmation. Il vous aide à identifier des opportunités de trading Buy/Sell présentant une probabilité de réussite plus élevée, tout en réduisant considérablement les faux signaux. Des flèches Buy et Sell bien visibles apparaissent directement sur le graphique, avec des niveaux de Stop Loss et de T
      Gann Made Easy   est un système de trading Forex professionnel et facile à utiliser qui est basé sur les meilleurs principes de trading en utilisant la théorie de mr. WD Gann. L'indicateur fournit des signaux d'ACHAT et de VENTE précis, y compris les niveaux Stop Loss et Take Profit. Vous pouvez échanger même en déplacement en utilisant les notifications PUSH. VEUILLEZ ME CONTACTER APRÈS L'ACHAT POUR RECEVOIR GRATUITEMENT DES INSTRUCTIONS DE TRADING ET D'EXCELLENTS INDICATEURS SUPPLÉMENTAIRES! V
      Boba Analysis Suite
      Trade Ready Solutions LLC
      5 (2)
      Boba Analysis Suite Boba Analysis Suite est un indicateur d’analyse pour MetaTrader 5. Il réunit la structure du marché, les zones de prix pertinentes et le contexte général du marché dans une même vue graphique. Développé à partir de l’expérience pratique d’un trader et formateur en trading, il accompagne une démarche d’analyse structurée : évaluer la direction du marché, identifier les niveaux importants et analyser plusieurs unités de temps conjointement. Une analyse en contexte La significat
      FiboSniper Pro
      Van Minh Nguyen
      5 (4)
      FiboSniper Pro – Multi-Filter Fibonacci System with Auto SL/TP and Control Panel FiboSniper Pro est un indicateur technique qui combine des Fibonacci Envelopes dynamiques avec plusieurs filtres de confirmation afin de générer des signaux Buy et Sell sélectionnés. Les niveaux de Fibonacci sont calculés à partir de Moving Average et ATR, puis filtrés par ADX, EMA, RSI, ATR, Volume, Time et la structure des bougies. L’indicateur affiche directement sur le graphique les niveaux automatiques de Stop
      Prochaine mise à jour — Version 2.52 bientôt disponible ! [NOUVEAU] Préparez-vous à découvrir 4 nouvelles fonctionnalités majeures conçues pour améliorer votre analyse du marché et votre flux de travail de trading Nous faisons passer l’analyse du marché au niveau supérieur avec 4 nouvelles fonctionnalités conçues pour répondre à vos besoins en trading. Découvrez : 1. TRADE OVERVIEW DASHBOARD 2. CONFLUENCE AT ZONE 3. STRONG & WEAK HIGH/LOW 4. OTE 1. TRADE OVERVIEW DASHBOARD Un tableau de bord qu
      M1 Sniper MT5
      Oleg Rodin
      5 (7)
      M1 SNIPER   est un système d'indicateurs de trading facile à utiliser. Il s'agit d'un indicateur à flèche conçu pour l'unité de temps M1. Cet indicateur peut être utilisé seul pour le scalping sur l'unité de temps M1 ou intégré à votre système de trading existant. Bien que conçu spécifiquement pour le trading sur l'unité de temps M1, ce système peut également être utilisé avec d'autres unités de temps. Initialement, j'avais conçu cette méthode pour le trading du XAUUSD et du BTCUSD. Cependant, j
      Auto Optimized SpeedAngle est un système de vectorisation du momentum de niveau institutionnel qui élimine l'ajustement de courbe ( curve-fitting ) grâce à une optimisation continue par avancement ( Walk-Forward Optimization , WFO). Plutôt que de s'appuyer sur des entrées statiques qui se dégradent lorsque les régimes de marché changent, l'indicateur recalibre dynamiquement ses paramètres en utilisant une validation hors échantillon ( Out-of-Sample , OOS), garantissant ainsi que les signaux affi
      SQN Max indicator for MT5 by ITC
      Renaud Herve Francois Candel
      Sqn Max Indicator Sqn Max is an exclusive indicator to trade the market with high effectiveness. The indicator is based on price action, volatility and trend. This indicator is as simple as possible but not too simple. The indicator can generate alerts to ease the trading process. You don't have to stay all day in front of your screen. The indicator can be used with any class of assets and with any time frame. It is possible to achieve better results trading our list of selected assets. We achi
      Crystal Heikin Ashi Signals
      Muhammad Jawad Shabir
      5 (5)
      Crystal Heikin Ashi Signals—Professional Trend & Signal Detection Indicator Advanced Heikin Ashi Visualization with Intelligent Signal System for Manual & Automated Trading Final Price: $149 ---------> Price goes up $10 after every 10 sales . Limited slots available — act fast . Overview User Guide PDF Crystal Heikin Ashi Signals is a professional-grade MetaTrader 5 indicator that combines pure Heikin Ashi candle visualization with an advanced momentum-shift detection system. Designed for both m
      FX Power MT5 NG
      Daniel Stein
      5 (33)
      FX Power : Analysez la force des devises pour des décisions de trading plus intelligentes Aperçu FX Power est l'outil essentiel pour comprendre la force réelle des principales devises et de l'or, quelles que soient les conditions du marché. En identifiant les devises fortes à acheter et les faibles à vendre, FX Power simplifie vos décisions de trading et révèle des opportunités à forte probabilité. Que vous suiviez les tendances ou anticipiez les retournements à l'aide de valeurs extrêmes de D
      Trend Catcher ind mt5
      Ramil Minniakhmetov
      5 (18)
      INDICATEUR DE DÉTECTEUR DE TENDANCE L'indicateur de détecteur de tendance analyse les mouvements de prix du marché grâce à une combinaison d'indicateurs d'analyse de tendance adaptatifs, propriétaires et personnalisés. Il identifie la véritable direction du marché en filtrant les fluctuations à court terme et en se concentrant sur la force de la dynamique sous-jacente, l'expansion de la volatilité et la structure des prix. Il utilise également une combinaison d'indicateurs personnalisés de lis
      Scalper Vault est un système de trading puissant et complet, conçu pour les traders en quête de régularité dans le cadre du trading intrajournalier. Cet indicateur de haute précision constitue un système de trading autonome et exhaustif, offrant des analyses de qualité institutionnelle, aussi bien pour le Forex que pour les options binaires. VEUILLEZ ME CONTACTER APRÈS VOTRE ACHAT POUR OBTENIR MES CONSEILS DE TRADING AINSI QU'UN EXCELLENT BONUS ! En éliminant les incertitudes et les analyses man
      SIO Oscillator : oscillateur auto-optimisé de déséquilibre de semi-variance Achetez l’indicateur et recevez GRATUITEMENT l’Expert Advisor (EA) basé sur celui-ci. La plupart des oscillateurs traitent tous les mouvements de prix de la même manière. SIO sépare la pression haussière de la pression baissière et mesure le déséquilibre entre les deux, montrant quel camp contrôle réellement le marché : les acheteurs ou les vendeurs. Lorsque le déséquilibre atteint un extrême, SIO génère un signal clair
      Indicateur multi-devises de force et de momentum MT5 Dynamic Forex28 Navigator est l'évolution de nos indicateurs populaires de longue date, qui réunit la puissance de cinq en un : Advanced Currency Strength28 Indicator (700 avis) Advanced Currency IMPULSE with ALERT (530 avis) Currency Strength EXOTICS GOLD Impulse with Alert CS28 Combo Signals (bonus actuel) Pas besoin d'acheter quatre indicateurs et de les empiler sur vos graphiques. Tout est réuni dans un seul indicateur puissant : la force
      Adaptive Price Action Engine Achetez un indicateur, obtenez l'EA gratuitement Analyse auto-optimisée des tendances et des figures de chandeliers Multi-Timeframe Les marchés évoluent constamment, et tous les modèles de Price Action n’ont pas la même valeur dans toutes les conditions de marché. Adaptive Price Action Engine a été conçu pour s’adapter aux changements du marché en combinant structure de tendance, analyse Multi-Timeframe, figures de chandeliers et optimisation statistique au sein d’un
      Azimuth Pro
      Ottaviano De Cicco
      5 (7)
      Azimuth Pro V2: Synthetic Fractal Structure and Confirmed Entries for MT5 Overview Azimuth Pro is a multi-level swing structure indicator by Merkava Labs . Four nested swing layers, swing-anchored VWAP, ABC pattern detection, three-timeframe structural filtering, and closed-bar confirmed entries — one chart, one workflow from micro-swings to macro-cycles. This is not a blind signal product. It is a structure-first workflow for traders who care about location, context, and timing. Halloween P
      Neuro Poseidon MT5
      Daria Rezueva
      4.68 (53)
      Neuro Poseidon is a new indicator by Daria Rezueva. It combines precise trading signals with adaptive TP/SL levels - creating best possible trades as a result! Message me and get  Neuro Poseidon Assistant  as a gift to automize your trading process! What makes it stand out? 1. Proven profitability on all assets and timeframes 2. Only confirmed BUY and SELL signals present on the chart 3. Adaptive TP & SL levels generated by the software for each trade 4. Easy to understand - suitable for al
      PZ Swing Trading MT5
      PZ TRADING SLU
      5 (5)
      Protect against whipsaws: revolutionize your swing trading approach Swing Trading is the first indicator designed to detect swings in the direction of the trend and possible reversal swings. It uses the baseline swing trading approach, widely described in trading literature. The indicator studies several price and time vectors to track the aggregate trend direction and detects situations in which the market is oversold or overbought and ready to correct. [ Installation Guide | Update Guide | Tro
      SkyHammer Signal Pro Indicateur professionnel de signaux de tendance sans repaint, avec niveaux Entry, SL et TP verrouillés SkyHammer Signal Pro est un indicateur de tendance et de momentum structuré, conçu pour les traders qui recherchent des signaux clairs, fixes et vérifiables. Il fonctionne le mieux sur les timeframes courts, comme M1 et M5 . L’indicateur ne cherche pas à prédire les sommets ou les creux du marché. Il attend plutôt une structure de marché confirmée, une direction de tendance
      Advance AI Scanner
      Mohamed Samsudeen
      5 (1)
      Advance AI Scanner is a multi-symbol analysis indicator for MetaTrader 5. It scans Forex pairs, metals, energy, stock indices and cryptocurrencies at the same time and rates each instrument with its own self-training model. It explains in plain English what moved each market and why, and it estimates how far upcoming economic news usually moves each symbol, measured on your broker's own price history. $199 instead of $499. 10 copies left at this price. One time purchase  Installation and User
      Le profit de la structure du marché change à mesure que le prix s'inverse et recule. L'indicateur d'alerte d'inversion de la structure du marché identifie le moment où une tendance ou un mouvement de prix approche de l'épuisement et est prêt à s'inverser. Il vous avertit des changements dans la structure du marché qui se produisent généralement lorsqu'un renversement ou un recul majeur est sur le point de se produire. L'indicateur identifie initialement les cassures et la dynamique des prix, c
      Break and Retest Hunter is a powerful MetaTrader 5 indicator designed to automatically identify support and resistance levels, breakout structures, and potential retest opportunities in real time. Bonus Indicator: After purchasing Break and Retest Hunter , contact me to receive Trade Indicator Assistant EA completely free as a bonus utility. $65 for the next 10 copies . Next price is $120.  Combining adaptive market analysis, clear BUY/SELL signals, Fibonacci-based profit targets, and a premiu
      DayTrader PRO
      Davit Beridze
      5 (4)
      DayTrader PRO DayTrader PRO est un indicateur de trading avancé qui combine le filtre Laguerre de John Ehlers avec un puissant moteur d'auto-optimisation. Au lieu d'utiliser des paramètres fixes, l'indicateur recherche automatiquement les meilleurs réglages en fonction des conditions récentes du marché, vous aidant à vous adapter à la volatilité changeante sans ajustements manuels constants. L'indicateur génère des signaux clairs d'ACHAT (BUY) et de VENTE (SELL), accompagnés de niveaux de Stop L
      Apex Patterns PRO Achetez l'indicateur - Obtenez GRATUITEMENT l'Expert Advisor basé sur celui-ci. Intelligence auto-optimisée des figures chartistes et des cassures Les scanners de figures traditionnels s'appuient sur des paramètres fixes, sous-performant souvent lorsque la volatilité et les structures du marché changent. Apex Patterns PRO est conçu pour s'adapter aux conditions changeantes du marché en combinant la reconnaissance des figures chartistes structurelles, le filtrage du momentum et
      Power Candles MT5
      Daniel Stein
      4.58 (12)
      Power Candles V3 - Indicateur de force à optimisation automatique Power Candles V3 transforme la force des devises et des instruments en un plan de trading exploitable sur chaque graphique auquel il est associé. Au lieu de se contenter de colorer les bougies, il effectue une optimisation automatique en temps réel en arrière-plan et vous fournit les meilleurs niveaux de Stop Loss, Take Profit et seuils de signal pour le symbole que vous avez sous les yeux. Un simple clic suffit pour l'adopter en
      Plus de l'auteur
      Market 3 Sessions Indicator
      Antonio Molinaro
      3.67 (3)
      Session Box Indicator for MetaTrader 5 IMPORTANT NOTE: **A new input parameter ( Skip weekends  )  has been introduced which must be set to false for markets opened 24/7** Version 1.00 Release Version 1.01 Complete code rewrite Version 1.02 Fix: added missing font name and removed emoji as session name, added label positioning Version 1.03 Fix: proper weekend handling, complete minute support for all sessions, independent label position Description: The SessionBox indicator is designed to visu
      FREE
      HTF Power of Three (ICT) -  MT4 Indicator - Version 1.1 Overview The   HTF Power of Three   indicator is a professional implementation of the Inner Circle Trader's (ICT) Power of Three concept, inspired by Larry Williams. This indicator visualizes higher timeframe (HTF) candle development in real-time on any lower timeframe chart, making it an essential tool for ICT traders who study institutional price movement patterns. What is Power of Three (PO3)? Power of Three represents a three-staged Sma
      Session Box Indicator for MetaTrader 4 IMPORTANT NOTE: **A new input parameter ( Skip weekends  )  has been introduced which must be set to false for markets opened 24/7** Version 1.00 Release Version 1.01 Complete code rewrite Version 1.02 Fix: added missing font name and removed emoji as session name, added label positioning Version 1.03 Fix: proper weekend handling, complete minute support for all sessions, independent label position Description: The SessionBox indicator is designed to visu
      Range Bar Pro
      Antonio Molinaro
      Range Bar Pro Indicator for MetaTrader 5 Visualize market trends, levels and other features with Range Bar Pro, an innovative indicator that draws a unique, standalone candle on the right side of any MT5 chart. This single candle is generated from an analysis of price over a specified range, providing you with a powerful snapshot of the market. Key Features: Single-Candle Visualization: Gain quick insights with a single, specially derived candle that reflects comprehensive price movement over a
      ADX-Based Candle Color Indicator for MT5 Description:   Enhance your trading experience with the ADX-Based Candle Color Indicator for MT5! This powerful tool colors candlesticks based on the Average Directional Index (ADX) indicator, helping you quickly assess market strength and direction at a glance. Key Features:   - Color-Coded Candles:     - Green (Bullish) when D+ > D-.     - Red (Bearish) when D- > D+.   - Intensity Mapping:       The color intensity reflects the ADX value—stronger col
      Footprint Indicator for MT5 NOTE: LIMITED TIME PRICE *** ONLY £30 1. Introduction  This Indicator provides a real-time footprint and volume profile visualization per candle directly on MetaTrader 5 charts, allowing traders to analyze order flow, volume distribution, and market pressure with precision.  2. Installation  1. Copy the Indicator file into the MetaTrader 5 /Indicators folder.  2. Restart MetaTrader 5.  3. Drag the Indicator onto a chart.  3. Indicator Overview  The Indicator rende
      In trading, the Master Pattern (sometimes called the market master pattern ) is a conceptual framework describing how price typically moves as capital flows through markets. It is not a rule-set, but a recurring structural sequence driven by institutional behaviour, liquidity, and crowd psychology. Different trading schools describe it with different names, but the underlying logic is largely the same. Core Idea Markets tend to move through a repeating cycle: Accumulation → Expansion → Distribut
      Filtrer:
      Lierson José
      180
      Lierson José 2026.03.18 15:28 

      Excelent job bro! Let's go!

      Antonio Molinaro
      2134
      Réponse du développeur Antonio Molinaro 2026.03.19 14:41
      Thank you Jose`, I'm glad you are happy.
      man1980
      2507
      man1980 2026.01.17 01:12 

      The HTF PO3 indicator does a great job of identifying higher time frame market phases like accumulation, manipulation and expansion. it's especially useful for intraday traders because it adds clear context and helps avoid trading during trap conditions. When combined with smart money concepts, it works well as a bias and timing tool rather than an entry signal. overall it's a solid indicator for traders who want better structure and patience in their trading.

      Antonio Molinaro
      2134
      Réponse du développeur Antonio Molinaro 2026.03.19 14:43
      Thanks a lot for the 5*. I'm happy you find it useful.
      Répondre à l'avis