VPO Profile MT5
- 지표
-
Kyra Nickaline Watson-gordon
 Experienced Developer (Experts / Indicators / Utilities ...)
Account Manager (Investment Manager) - 버전: 1.5
- 업데이트됨: 17 7월 2024
- 활성화: 10
Definition :
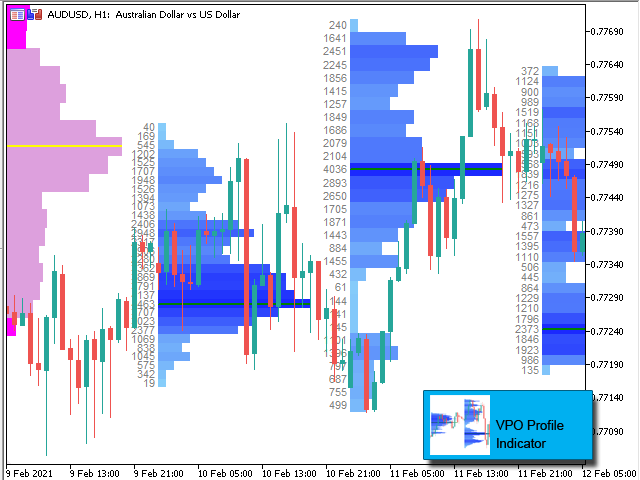
VPO is a Volume Price Opportunity. Instead of using bars or candles with an Open, High, Low, and Close price, each "bar" in a Market Profile is represented by horizontal bars against the price It is called Market Profile terminology.
In other words volume-price-opportunity (VPO) profiles are histograms of how many volumes were traded at each price within the span of the profile.
By using a VPO chart, you are able to analyze the amount of trading activity, based on volume, for each price level the market traded at for any given time period. The VPO Profile Chart study allows you to clearly see the areas where the market is trading with the max volumes.
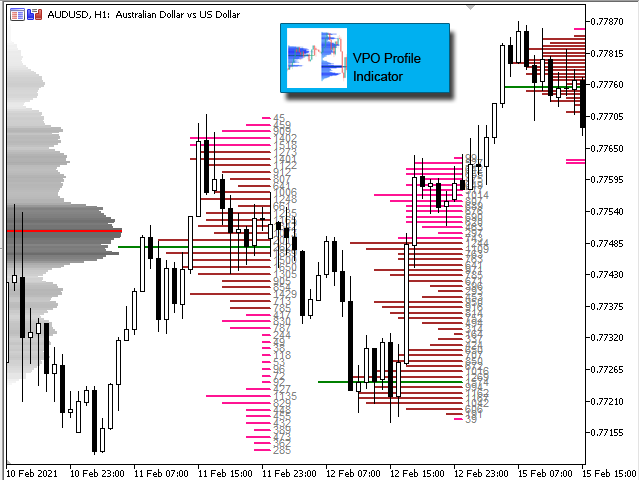
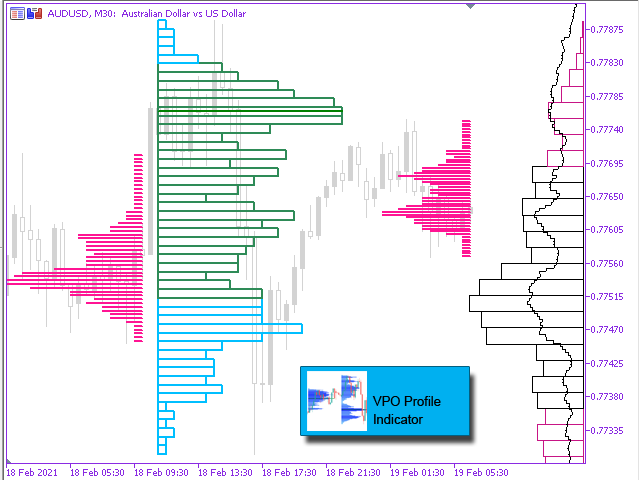
The indicator can help determine Support-Resistance levels.
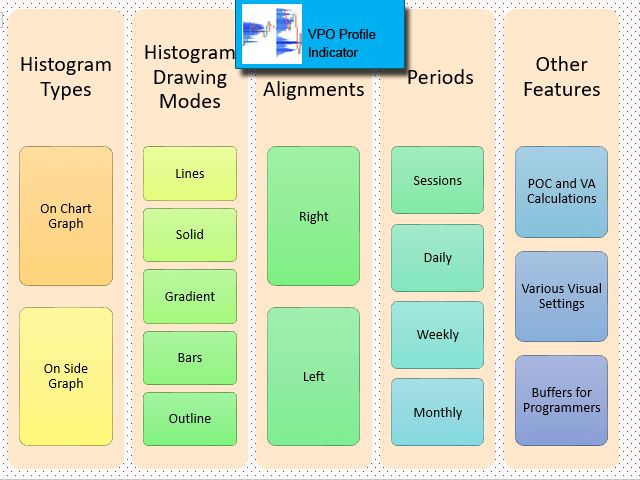
Inputs :
- On Chart Profile Options
- Enable/Disable
- Volumes : Tick/Real Volumes
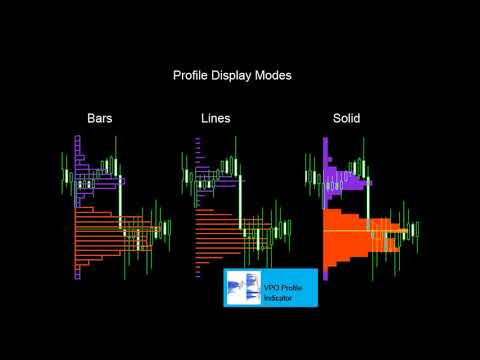
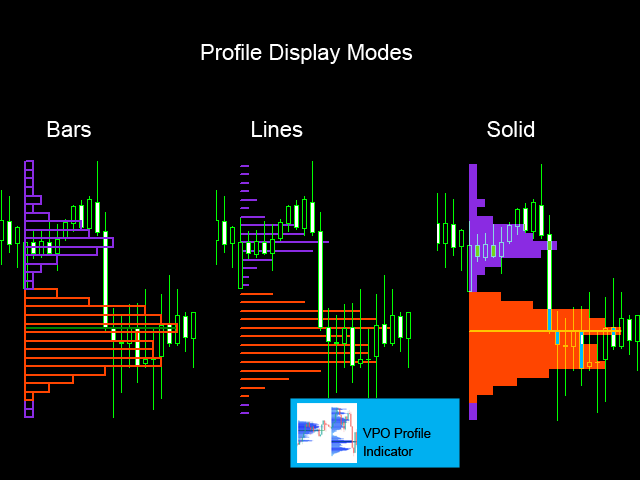
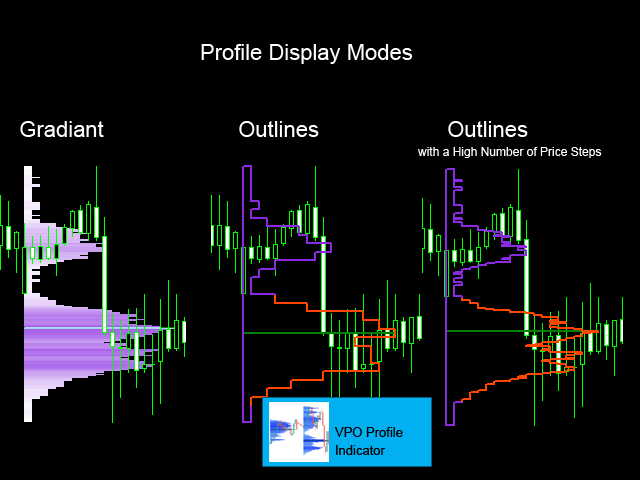
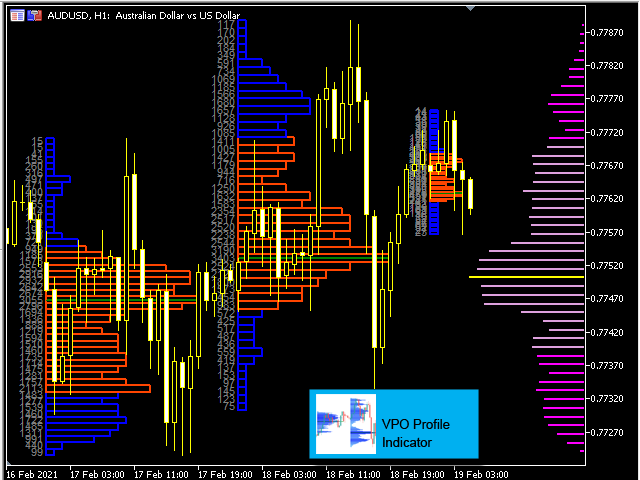
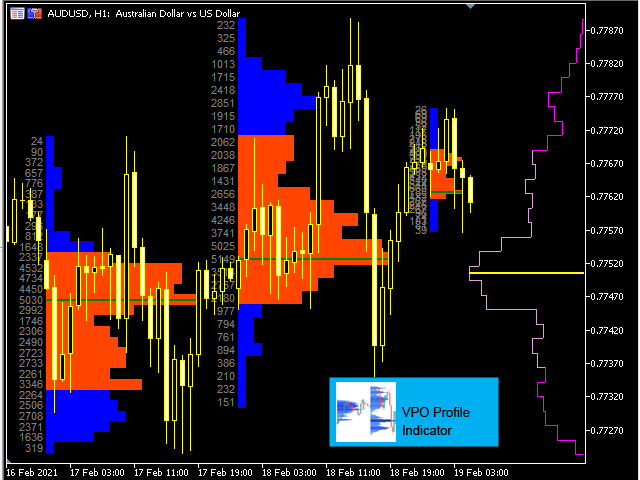
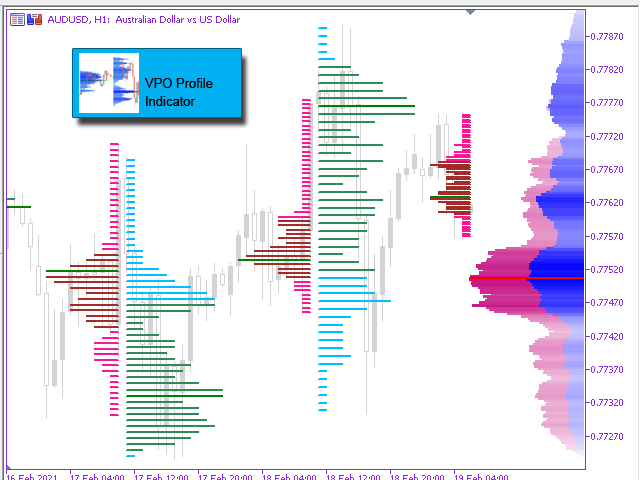
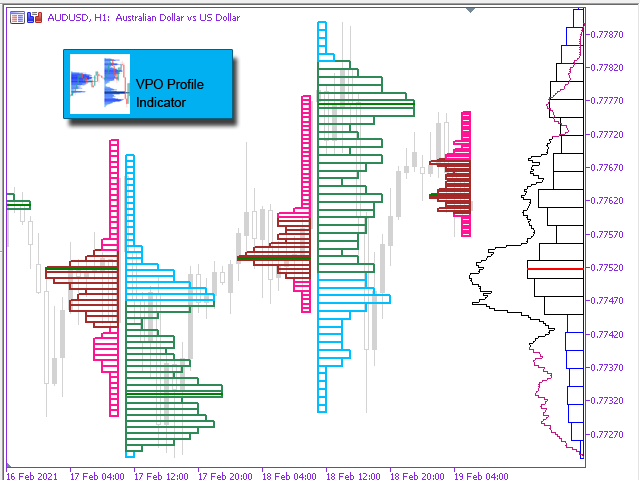
- Profile Display Mode : Lines/Solid/Gradient/Bars/OutLine
- Profile Alignment : Right/Left
- Profile Periods : Session/Daily/Weekly/Monthly
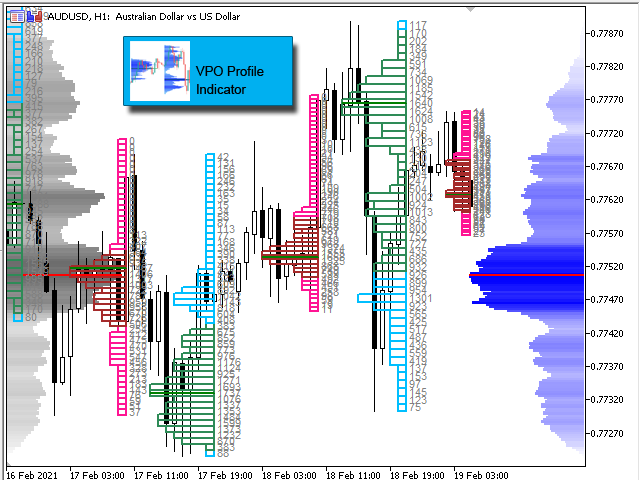
- Show Volume Text : Enable Text of Volumes
- Number of Price Steps : Number of horizontal divisions of profile
- VA Percentage : Percentage of Value Area
- Number of Profiles (Sessions)
- Session Start Time
- Session End Time
- On Side Profile Options
- Enable/Disable
- Volumes : Tick/Real Volumes
- Profile Display Mode : Lines/Solid/Gradient/Bars/OutLine
- Profile Alignment : Right/Left
- Number of Days : Number of days included in profile calculation
- Number of Price Steps : Number of horizontal divisions of profile
- VA Percentage : Percentage of Value Area
- Profile Size (% of Chart Width)
- Visual Settings
- On Chart Profile Color
- On Chart Profile Back Color (for Gradient)
- On Chart Profile Draw VA
- On Chart Profile VA Color
- On Chart Profile Draw POC
- On Chart Profile POC Color
- On Chart Profile POC Thickness
- On Chart Profile Text Color
- On Chart Profile Text Font Size
- On Chart Profile Longitudinal Scale (%)
- On Side Profile Color
- On Side Profile Back Color (for Gradient)
- On Side Profile Draw VA
- On Side Profile VA Color
- On Side Profile Draw POC
- On Side Profile POC Color
- On Side Profile POC Thickness
Buffers for programmers :
Tips :
- You can attach more than one indicator to a chart with different settings in these cases :
- If you want multiple sessions on a day,
- If you want both right and left on side histograms on a chart,
- If you want 2 or more histograms overlapping each other.
Visit our other useful utilities, Indicators and experts here.


Nice indicator, works with ticks on forex and real volume on others (didnt check yet). Recommended!