Chart Pattern Signals
- 지표
- 버전: 1.20
- 활성화: 20

Super Signal Series – V12 PRO
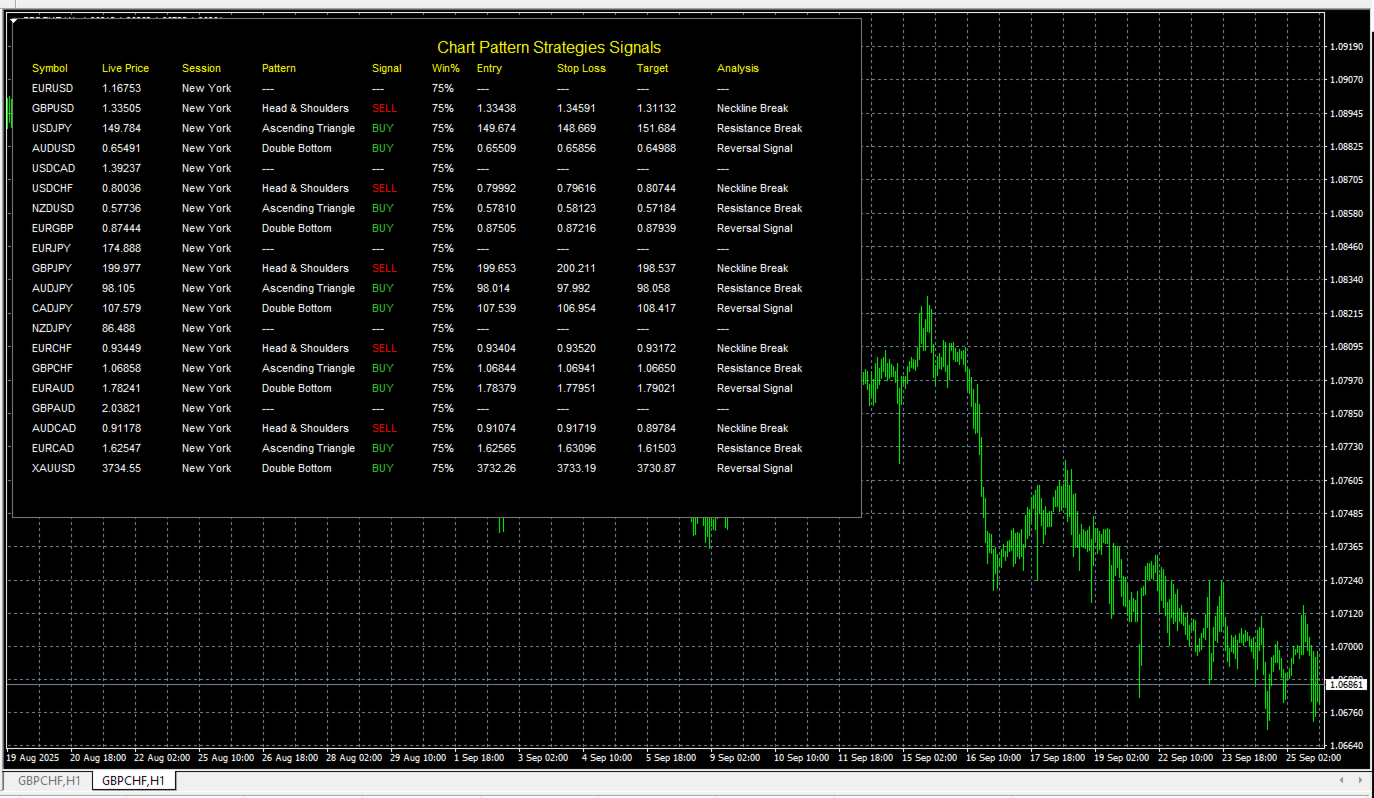
Chart Pattern Strategies Signals Indicator
MT4 Gold EA
XAU Trend Matrix EA – Worth $150 : See the EA https://www.mql5.com/en/market/product/162870MT5 Gold EA
XAU Steady Gain Pro – Worth $150 : See the EA https://www.mql5.com/en/market/product/162861
Total Bonus Value: $300
Overview
The Chart Pattern Strategies Signals Indicator is a comprehensive dashboard for MetaTrader 4 designed to give traders a powerful, at-a-glance view of potential chart pattern setups across multiple markets. It monitors a customizable list of instruments in real-time, displaying clear, actionable information directly on your chart. This tool is built to assist manual traders by identifying and organizing high-probability trading signals, saving you hours of scanning through individual charts.
Key Features-
Multi-Symbol Dashboard: Scans a user-defined list of up to 20 instruments simultaneously, including Forex pairs, CFDs, and precious metals like Gold (XAU/USD).
-
Real-time Signal Display: The dashboard is designed for clarity and quick decision-making, providing all the critical data you need for a potential trade in one place:
-
Symbol & Live Price
-
Current Trading Session (Tokyo, London, New York)
-
Detected Chart Pattern (e.g., Head & Shoulders, Ascending Triangle)
-
Clear BUY or SELL Signal highlighted in color.
-
Win Percentage (Win%) to gauge signal strength.
-
Suggested Limit Entry, Stop Loss, and Target Prices for your trade plan.
-
Brief Analysis note (e.g., "Resistance Break").
-
-
Completely Non-Intrusive: As an indicator, it will never place trades on its own. It serves purely as an informational and signal-generating tool, leaving you in full control of your trading decisions.
-
Fully Customizable Interface: You have complete control over the dashboard's appearance. Adjust the panel's width, height, row and column spacing, colors, and font to perfectly match your chart setup and preferences.
-
Efficient Performance: The indicator uses a timer to refresh data, ensuring it provides up-to-date information without overloading your trading terminal.
Recommendations:
Pairs: EURUSD, GBPUSD, USDJPY, AUDUSD, USDCAD, USDCHF, NZDUSD, EURGBP, EURJPY, GBPJPY, AUDJPY, CADJPY, NZDJPY, EURCHF, GBPCHF, EURAUD, GBPAUD, AUDCAD, EURCAD, XAUUSD.
- Timeframe : M5 , M30 , H1 .
- Accounts type: Any ECN, Low spread account.
- Lot Size: 0.01 for 100 USD Equity
-
Attach: Load the indicator onto any single chart in your MT4 terminal.
-
Scan: The indicator runs in the background, scanning all the symbols you've listed in the input settings for the predefined chart patterns.
-
Display: When a potential pattern is identified, the indicator instantly populates the corresponding row in the dashboard with the pattern name, a trade signal (BUY/SELL), and the calculated price levels for entry, stop loss, and take profit.
-
Decide: You can then use this information to perform your own analysis and decide whether to manually enter the trade based on the signals provided.
Important Note: The pattern detection logic in this version is simulated to provide a functional framework and showcase the indicator's capabilities. For live trading, the AnalyzePatternsForSymbol function would need to be programmed with robust algorithms for each of the 10 chart patterns.
Input Parameters-
Symbols: A comma-separated list of all the instruments you want the dashboard to monitor.
-
Layout & Style: A full suite of options to control the size, spacing, colors, and font of the dashboard panel.
-
Pattern Detection Parameters: Basic inputs for the underlying ZigZag indicator used to help identify pattern anchor points.
This indicator is intended for informational and analytical purposes only. It does not guarantee profits or financial success. Trading financial markets involves significant risk, and losses may occur. Users should exercise caution, perform their own analysis, and apply proper risk and money management practices.