Pin Bar Pro v1

Pin Bar Pro v1.0 – MQL5 지표

설명:
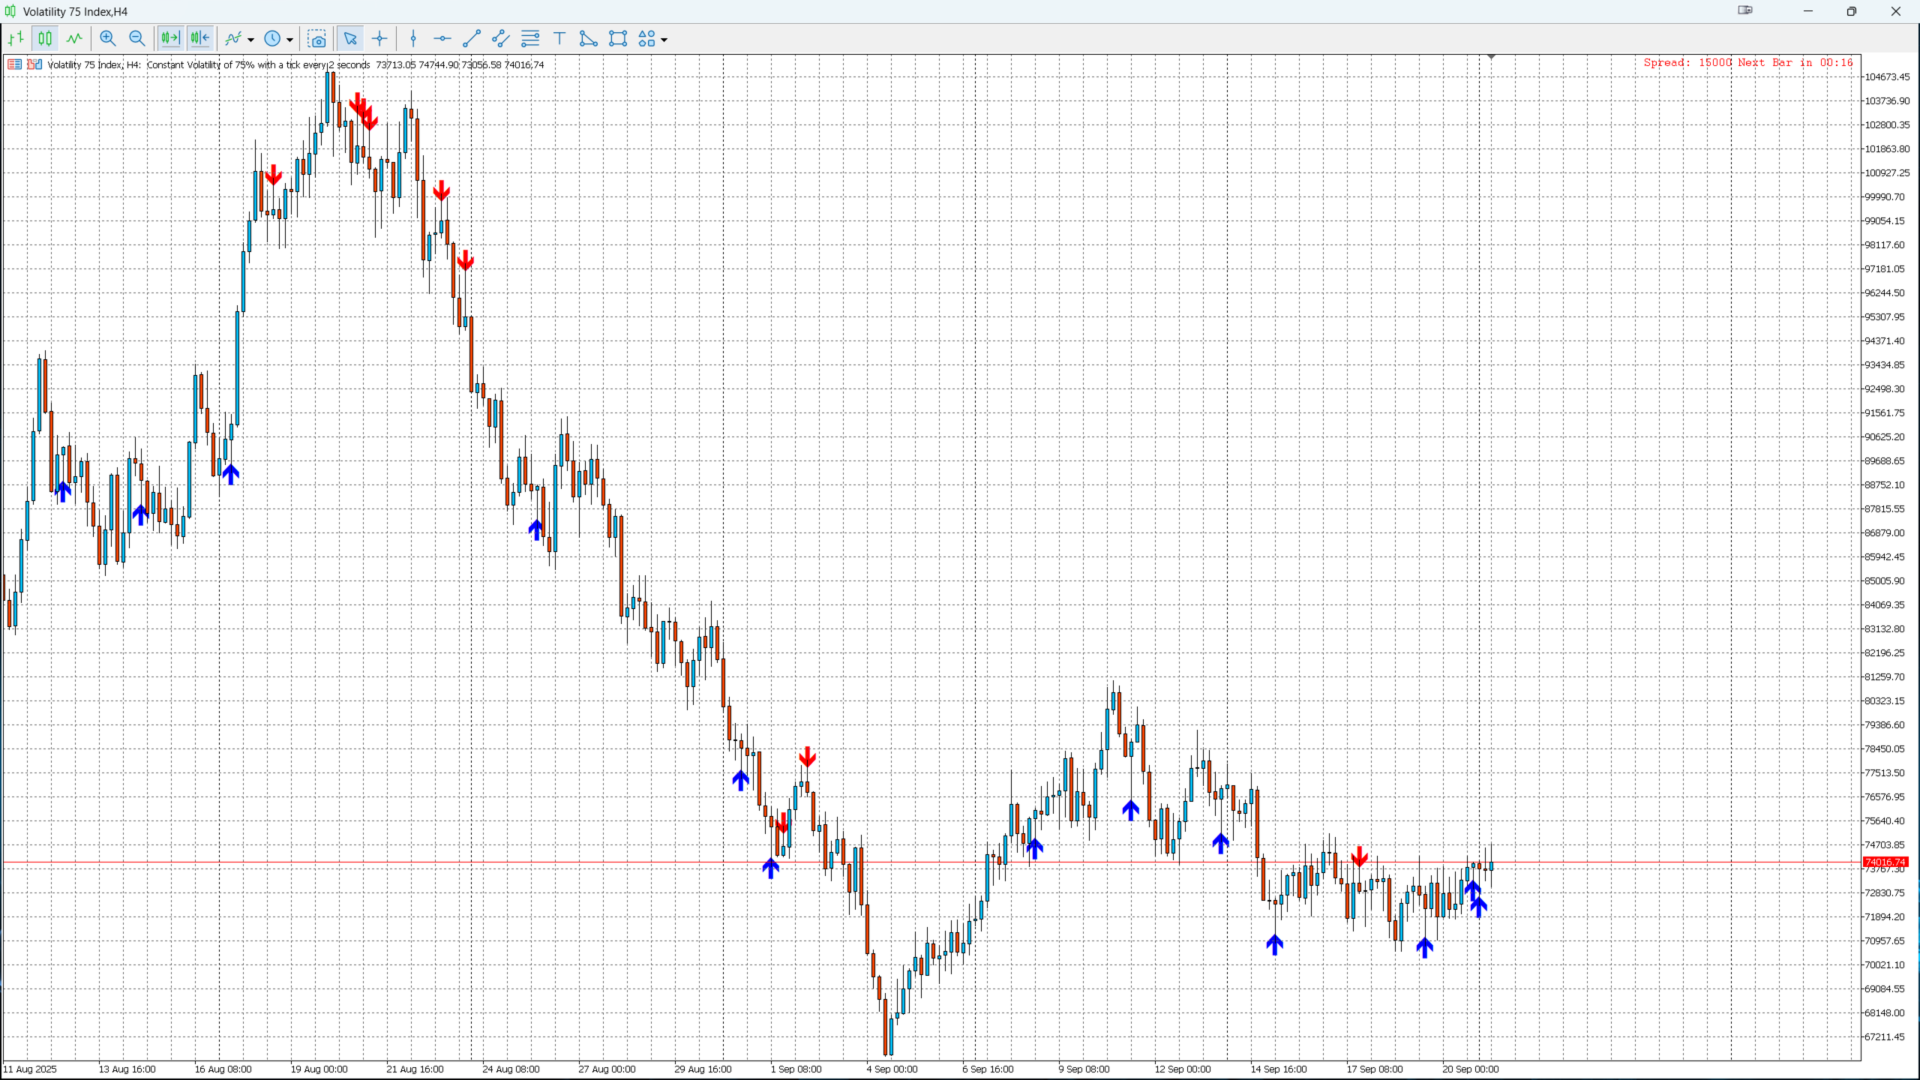
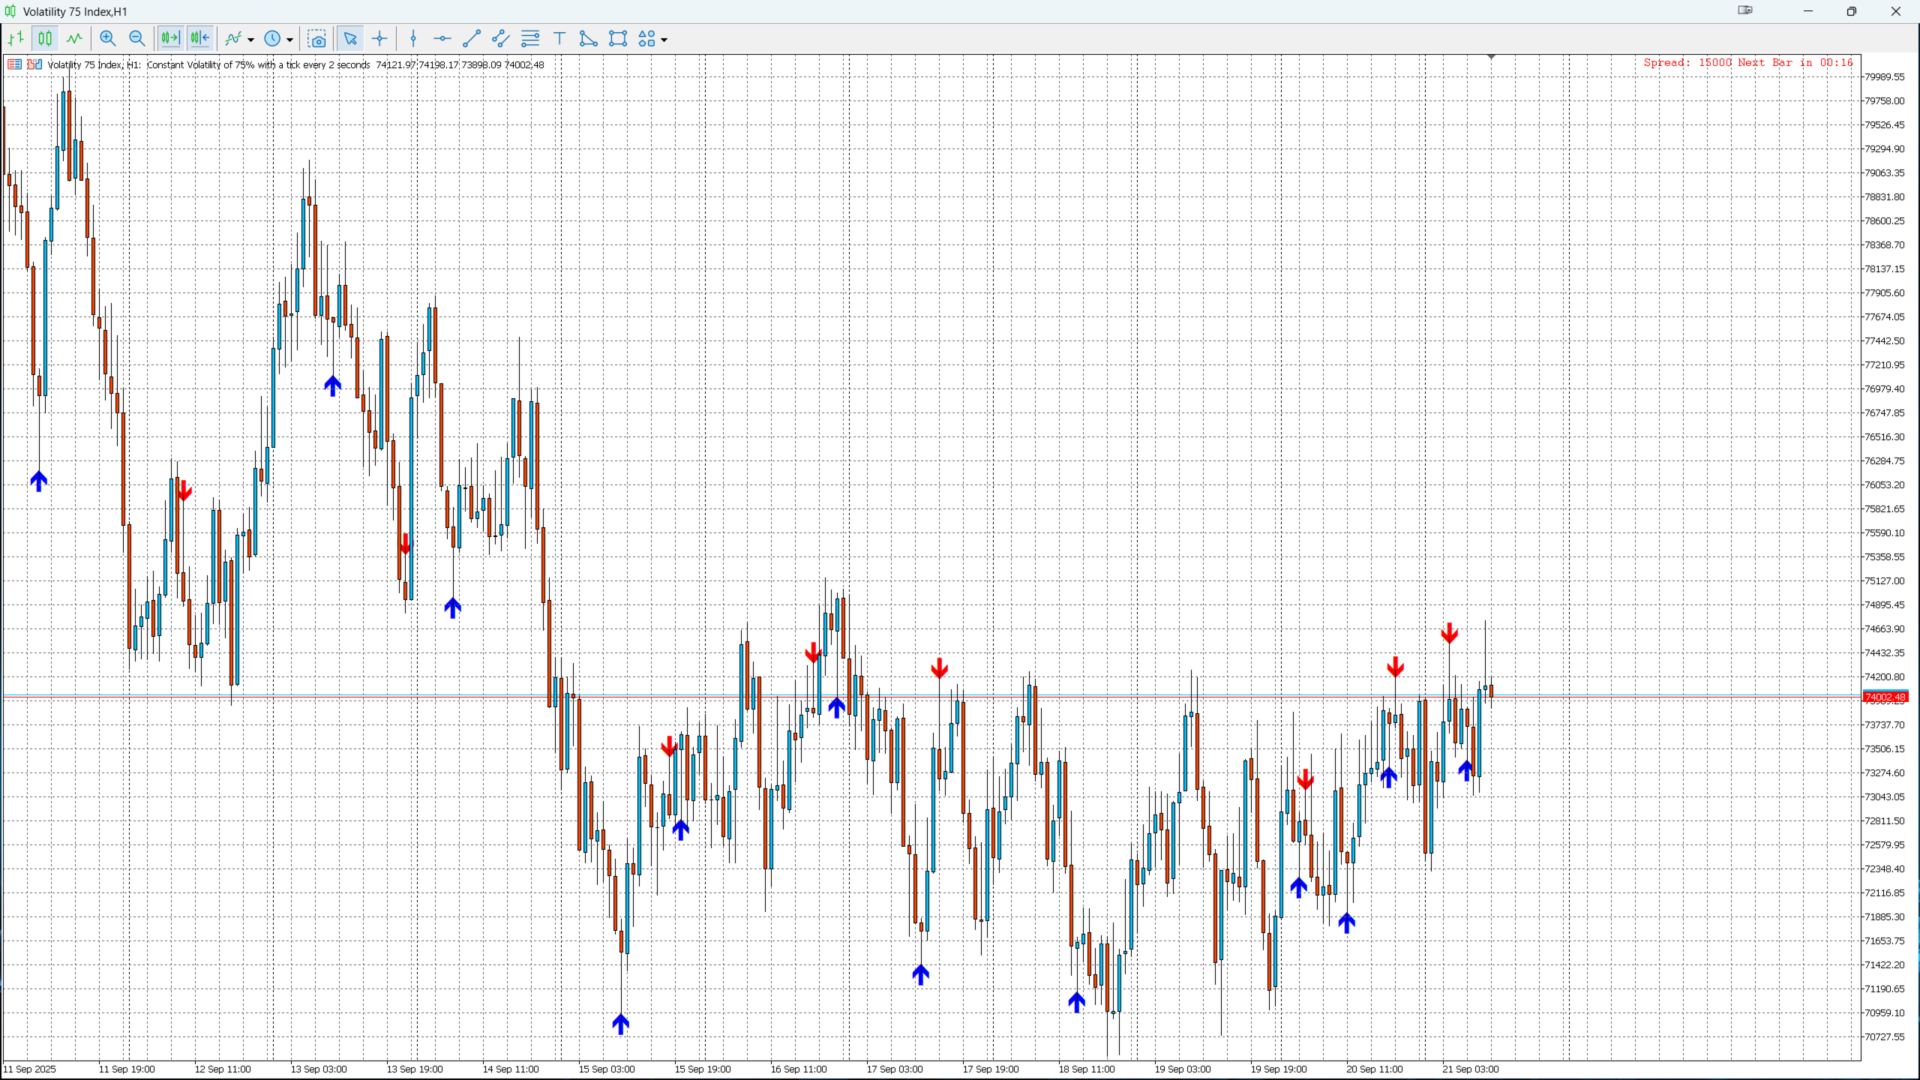
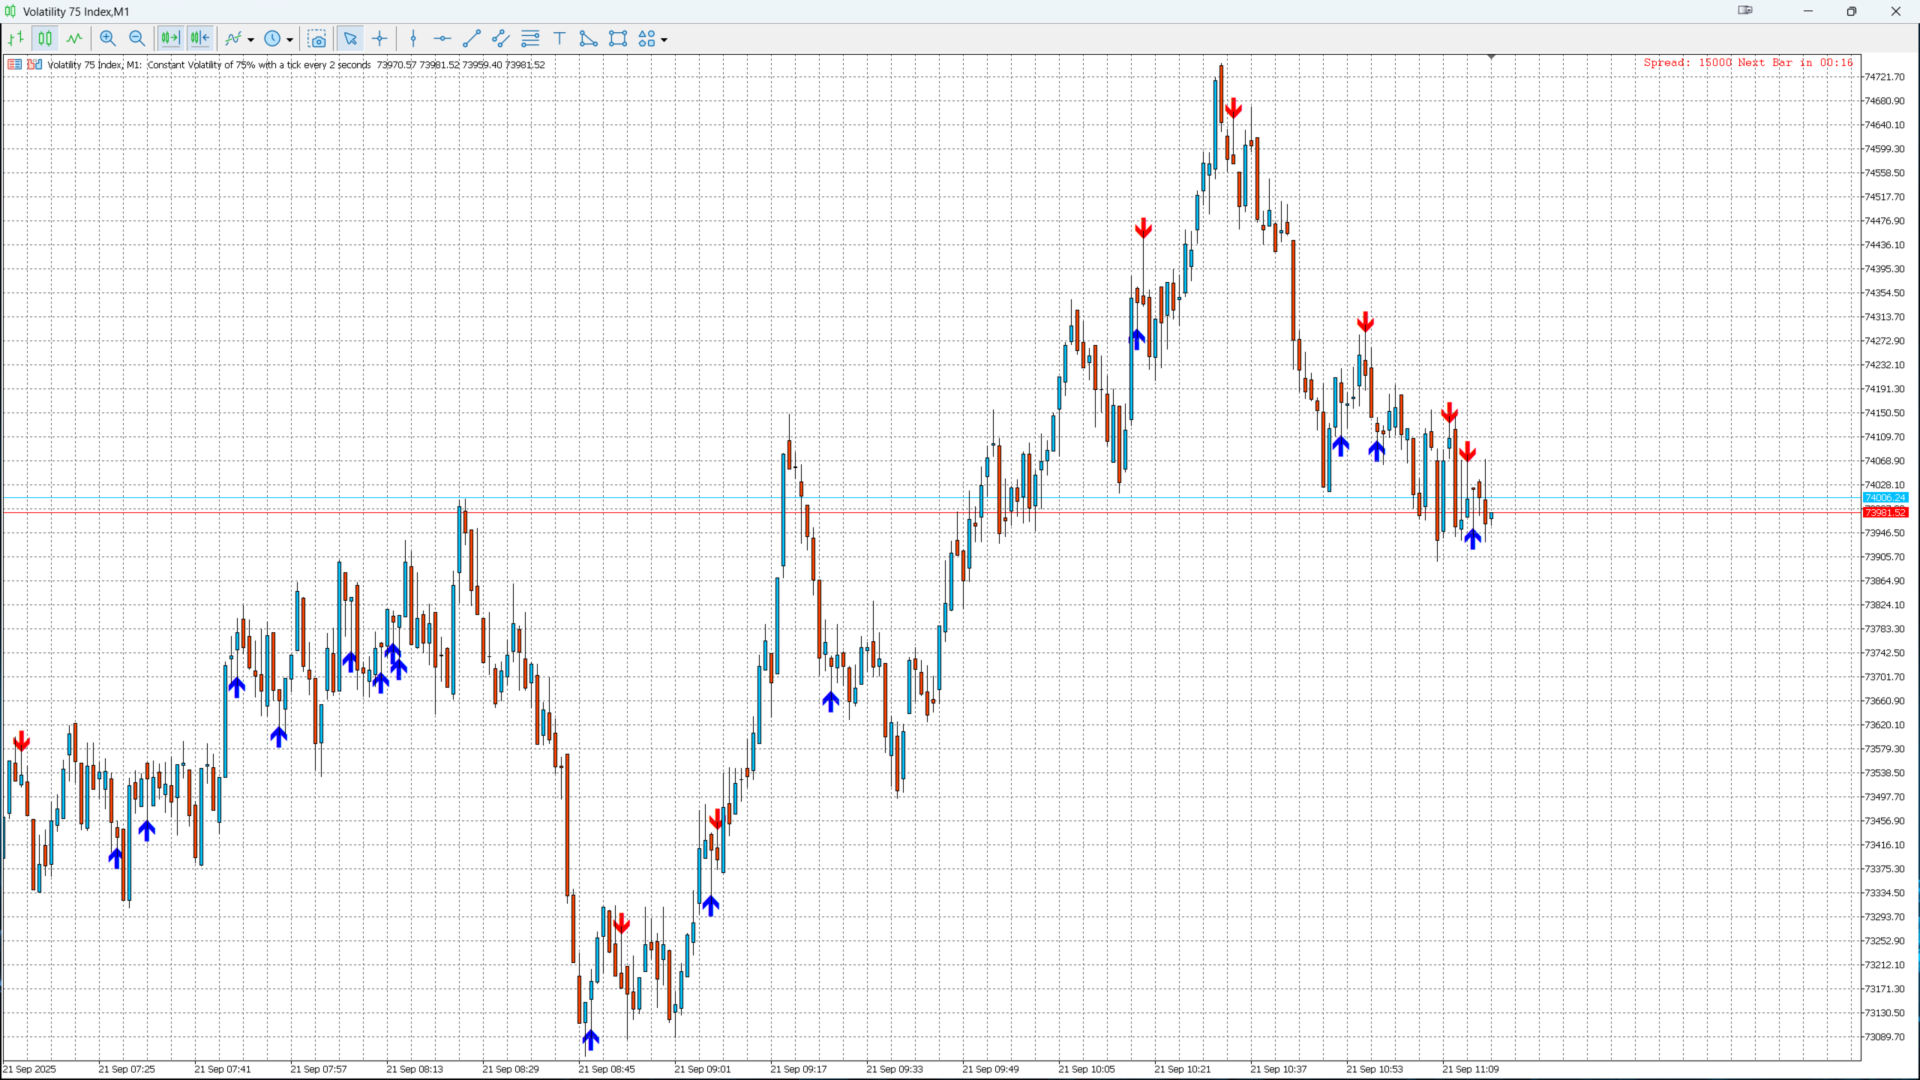
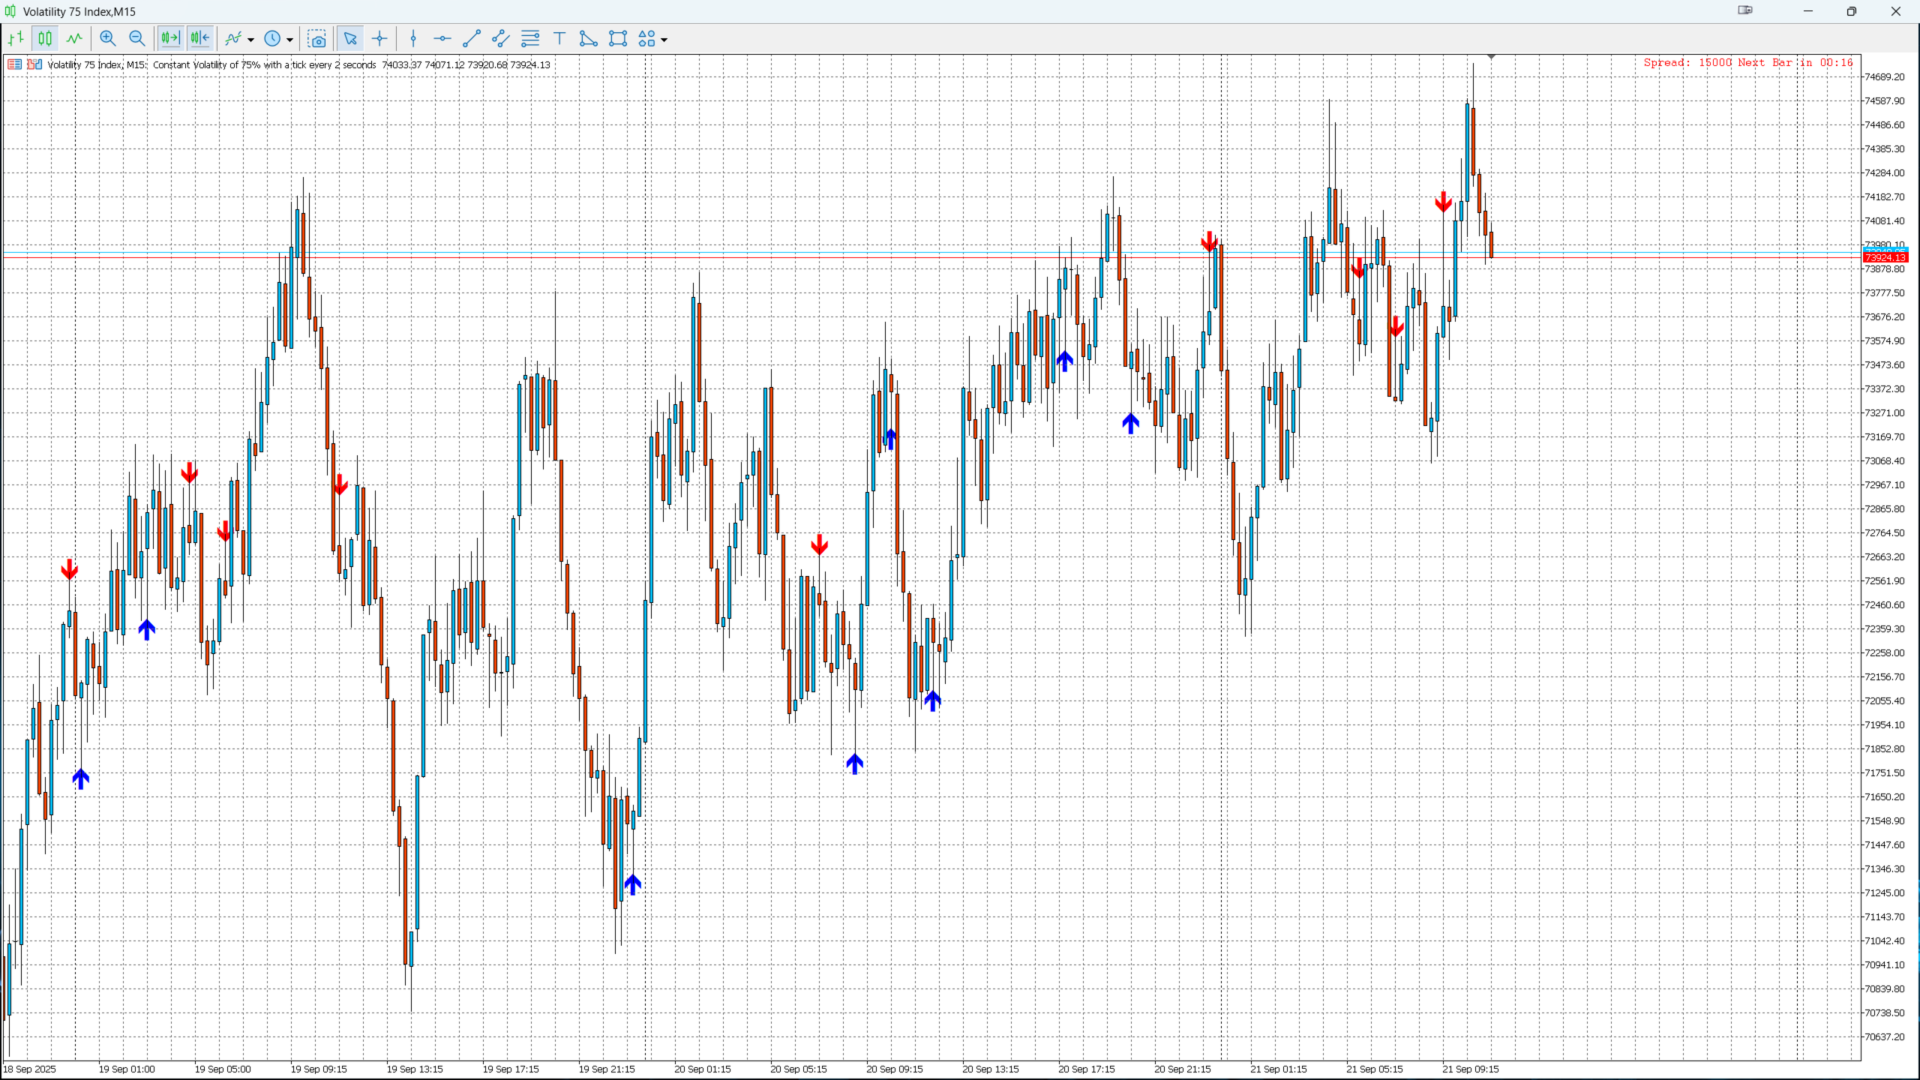
Pin Bar Pro는 MetaTrader 5용 전문 지표로, 핀바(Pin Bar) 를 자동 감지하여 시장 반전을 예측합니다.

  • 파란 화살표 → 매수 신호

  • 빨간 화살표 → 매도 신호

특징:

  • Pin Bar 자동 감지

  • 화살표 커스터마이징 ( Arrow_Up_Code , Arrow_Down_Code )

  • 수직 오프셋 조정 ( Arrow_Offset_Pts )

  • 모든 심볼과 타임프레임 지원

매개변수:

매개변수 설명 기본값
Arrow_Up_Code 매수 화살표 코드 233
Arrow_Down_Code 매도 화살표 코드 234
Arrow_Offset_Pts 수직 오프셋 (포인트) 10

저자: KOUAME N’DA LEMISSA
버전: 1.0 – MQL5용


추천 제품
Ultimate Supply Demand MT5
Ramon Sobrevals Arce
5 (4)
After working during many months, with the help of Neural Networks, we have perfected the ultimate tool you are going to need for identifying key price levels (Supports and Resistances) and Supply and Demand zones. Perfectly suitable to trigger your trades, set up your future actions, decide your Take Profit and Stop Loss levels, and confirm the market direction. Price will always move between those levels, bouncing or breaking; from one zone to another, all the remaining movements are just mark
Liquidity zones Pro
Israr Hussain Shah
Uncover Institutional Footprints with Volume-Based Supply & Demand Liquidity Zones is a sophisticated Price Action and Volume analysis tool designed for MQL5. Unlike standard Support & Resistance indicators that rely solely on price history, this indicator integrates   Volume Volatility Analysis   to identify high-probability reversal levels. It automatically detects key Swing Highs and Swing Lows where significant trading activity (volume) occurred. In Smart Money Concepts (SMC), these areas r
PipFinite Exit EDGE MT5
Karlo Wilson Vendiola
4.88 (32)
Did You Have A Profitable Trade But Suddenly Reversed? In a solid strategy, exiting a trade is equally important as entering. Exit EDGE helps maximize your current trade profit and avoid turning winning trades to losers. Never Miss An Exit Signal Again Monitor all pairs and timeframes in just 1 chart www.mql5.com/en/blogs/post/726558 How To Trade You can close your open trades as soon as you receive a signal Close your Buy orders if you receive an Exit Buy Signal. Close your Sell orders if
Smart Wave Trend Analyzer 스마트 웨이브 트렌드 분석기 웨이브 분석과 프랙탈 패턴을 기반으로 고품질 추세선을 자동으로 식별하고 그리는 고급 추세 감지 시스템입니다. MT4-version:  https://www.mql5.com/en/market/product/164395 주요 구성 요소: 1. 메이저 라인 (파란색/빨간색, 굵은선) SMA(70)와 LWMA(10) 교차를 기반으로 한 장기 추세 가격 움직임에서 주요 고점과 저점을 식별 파란색 선 = 저항 (고점 연결) 빨간색 선 = 지지 (저점 연결) 스윙 트레이딩과 포지션 트레이딩에 적합 2. 마이너 라인 (청록색/주황색, 얇은선) SMA(21)와 LWMA(4) 교차를 기반으로 한 단기 추세 빠른 시장 움직임 포착 청록색 선 = 저항 (고점 연결) 주황색 선 = 지지 (저점 연결) 데이 트레이딩과 스캘핑에 이상적 3. 프랙탈 라인 (녹색/보라색, 중간 굵기) 여러 프랙탈 포인트를 통과하는 추세선의 자동 감지 알
Flow Architect
Alex Amuyunzu Raymond
Flow Architect Lite - Professional Market Structure Toolkit Free Version Features: Core Structure Analysis: Daily VWAP Engine   - Volume-weighted average price for institutional level tracking Standard Deviation Bands (SD1)   - Dynamic support and resistance zones Break of Structure Detection   - Visual markers for market structure shifts Fair Value Gap Identification   - Highlighted imbalance zones on your charts ATR Volatility Context   - Real-time Average True Range measurement Clean Informat
这是一个非常好用的供需指标,具有以下特色: 1、可以精准的识别出供给区和需求区,且不重绘。 2、价格到达供给区或需求区会弹窗报警,且会改变颜色用来和未测试的供需区做区分。 3、价格突破供给区、需求区会弹窗报警并清除该失效的供需区。 4、供给区和需求区的进入边界价格直接标注在图表上,一目了然。 该指标配合均线使用效果更佳,用均线判断方向,用供需区的点位为设定入场位置,用供需区的边界来设定止损位置,便于以损定量,管理资金控制仓位,制定交易计划限价交易。当然也可以根据行情方向,在到达供给区或需求区报警触发后市价进厂做单,但前提是要提前做好计划,判断好方向,不可以盲目开单。关于止盈,使用供需指标来交易的话,盈亏比是比较划算的,保守的可以根据2:1或者3:1的盈亏比设置止盈,也可以把较远的供给区或需求区当作止盈目标。
MT5용 Crypto_Forex 지표 PINBAR 패턴, 재도색 및 지연 없음. - "PINBAR 패턴" 지표는 가격 변동 거래에 매우 강력한 지표입니다. - 이 지표는 차트에서 다음과 같은 핀바를 감지합니다. - 상승 핀바 - 차트에 파란색 화살표 신호(그림 참조). - 하락 핀바 - 차트에 빨간색 화살표 신호(그림 참조). -   PC 및 모바일 알림 기능 포함. - "PINBAR 패턴" 지표는 지지/저항 레벨과 결합하기 매우 좋습니다. ................................................................................ 여기를 클릭하여 고품질 트레이딩 로봇과 지표를 확인하세요! MQL5 웹사이트에서만 제공되는 오리지널 상품입니다.
UPD1 Profile Levels MT5
Vitaliy Kuznetsov
5 (4)
표시기는 지정된 막대 수에 대한 작업 히스토그램에서 최대 및 최소 가격 볼륨(시장 프로필)의 수준을 찾습니다.   복합 프로파일. 히스토그램의 높이는 완전 자동이며 모든 기기 및 기간에 맞게 조정됩니다. 저자의 알고리즘이 사용되며 잘 알려진 아날로그를 반복하지 않습니다. 두 히스토그램의 높이는 촛불의 평균 높이와 거의 같습니다. 스마트 경고는 볼륨 레벨에 관한 가격에 대해 알려 도움이 될 것입니다. 개념Smart Money. Low Volume - Imbalance. ,좋은 시장 상황을 찾아 시장의 구조를 결정하고 바이너리 옵션에 대한 필터로 사용됩니다. 그것은 가격에 대한 자석입니다. High Volume - Liquidity. 는 시험을 위해 축적을 나갈 때 사용됩니다. 입력 매개 변수. 기본. Bars Count - 계산 및 표시 할 막대 수. Signal Fractal = 5 (색상 신호 레벨). 수준은 다음과 같은 조건에서 신호가 될 것입니다:그것을 초과하지 않는 상단
Fibaction
Abdelkhalek Orabi
Indicator Name: Fibaction – price action candle Detector Description: Fibo Signal Boxes is a powerful Smart Money Concept (SMC)-inspired indicator that auto-detects price action candles. bullish hammers and shooting stars, then draws precise Fibonacci entry zones and multiple take-profit levels directly on the chart. as for the SL personally i use 40 pips rules  Key Features: Detects bullish hammer and shooting star reversal candles. Automatically draws Fibonacci entry and TP boxes. as
Delta Profile Volume
Teresinha Moraes Correia
기술 설명 – MetaTrader 5용 Delta Profile Delta Profile 은 MetaTrader 5에서 정의된 캔들 범위 내의 거래량 흐름을 세부적으로 분석하기 위해 설계된 지표입니다. 이 도구는 각 가격 수준에서 양의 거래량(상승과 관련) 과 음의 거래량(하락과 관련) 간의 불균형을 구조화하고 시각화합니다. 이를 통해 사용자는 실제로 거래가 집중되는 가격 영역과 시장 불균형이 형성되는 구간을 명확하게 파악할 수 있습니다. 핵심 개념 지표는 가격 레벨 을 인식하고 이를 양의 거래량, 음의 거래량 및 순 델타(양-음 차이)로 분류합니다. 각 가격 레벨은 수평 막대 로 차트에 표시되며, 거래가 집중되는 구간을 직관적으로 보여줍니다. 사용자는 분석할 캔들의 개수 , 가격 반올림 정밀도 , 최대 표시 레벨 수 , 표시 옵션 등을 직접 설정할 수 있습니다. 주요 기능 가격 레벨 매핑 : 사용자가 지정한 자릿수에 맞게 가격을 반올림하여 거래량을 집계합니다. 순 델타 계산 : 양
Crypto_Forex 지표 "Doji Breakout pattern" for MT5. - 지표 "Doji Breakout pattern"은 순수한 가격 액션 거래입니다. 다시 칠하거나 지연하지 않습니다. - 지표는 Doji 패턴이 패턴의 중간에 있고 마지막 캔들이 첫 번째 브레이크아웃인 추세 방향으로 브레이크아웃되는 것을 감지합니다. - 강세 Doji Breakout 패턴 - 차트에 파란색 화살표 신호(그림 참조). - 약세 Doji Breakout 패턴 - 차트에 빨간색 화살표 신호(그림 참조). -   PC 및 모바일 알림 기능 포함. - 지표 "Doji Breakout pattern"은 지지/저항 수준과 결합하기에 좋습니다. 여기를 클릭하여 고품질 트레이딩 로봇과 지표를 확인하세요! 이 MQL5 웹사이트에서만 제공되는 오리지널 제품입니다.
Supply and Demand MTF MT5
Roman Zhitnik
4.67 (3)
This is a multi timeframe version of the  Supply and Demand indicator . It allows you to analyze a chart using the law of supply and demand on three different timeframes at a time. You will see zones of sales and purchases and determine the most profitable points to open positions. The indicator is based on the principle of market fractality. Supply and demand zones show places where a strong buyer or seller has made the price reverse and change its direction. The indicator has several types of
FREE
No Demand No Supply MT5
Trade The Volume Waves Single Member P.C.
No Demand No Supply   This indicator identifies   No Demand –No Supply candles to your chart and plots volume bars colored according to the signal. It can be applied to all timeframes or to a specific one only. It can also be used as regular volume indicator  with exceptional future of WEIGHTED VOLUME. Furthermore is has an alert notification, sound and email when a signals occurs. The indicator does not repaint but the alert will come on two candles back due to the definition of No Demand No Su
Trade smarter, not harder: Empower your trading with Harmonacci Patterns This is arguably the most complete harmonic price formation auto-recognition indicator you can find for the MetaTrader Platform. It detects 19 different patterns, takes fibonacci projections as seriously as you do, displays the Potential Reversal Zone (PRZ) and finds suitable stop-loss and take-profit levels. [ Installation Guide | Update Guide | Troubleshooting | FAQ | All Products   |  Get Help ] It detects 19 differen
Volume Profile V6
Andrey Kolesnik
4.67 (3)
시장 매물대 지표(Volume Profile) + 스마트 오실레이터. 통화 쌍, 주식, 선물, 암호화폐 등 거의 모든 종목에서 작동하며, 실제 거래량(Real Volume)과 틱 거래량(Tick Volume)을 모두 지원합니다. 프로파일 생성 범위를 일주일이나 한 달 등으로 자동 설정할 수 있을 뿐만 아니라, 두 개의 수직선(빨간색과 파란색)을 이동하여 수동으로 범위를 설정할 수도 있습니다. 히스트그램 형태로 표시되며, 특정 가격 수준의 히스토그램 너비는 해당 가격대에서 발생한 거래량을 의미합니다. Mode level line color 파라미터를 사용하면 가격이 반등할 가능성이 높은 주요 매물대 수준을 자동으로 표시할 수 있으며, Maximum color 파라미터는 설정된 전체 범위에서 거래가장 많이 발생한 최대 거래량 수준을 별도로 보여줍니다. 스마트 오실레이터는 과매수 및 과매도 구간을 표시합니다. 여러 지표로부터 오는 정보를 분석하고, 처리된 데이터를 바탕으로 과매수 및 과매
Harmonic Pattern Hunter
Shingidzano Lesetedi
Harmonic Pattern Hunter Harmonic Pattern Hunter is a technical indicator for MetaTrader 5 that automatically identifies and draws high-probability harmonic patterns directly on the chart. It is designed to assist traders who use harmonic analysis as part of their trading methodology. How It Works The indicator scans historical and live price data for completed XABCD harmonic structures using Fibonacci ratio validation. When a valid pattern is detected, it draws the full pattern geometry, marks t
Smart SD Rectangle Tool
Liam Alex Thomas Webb
스마트 공급 및 수요 사각형 도구 인디케이터는 MT5에서 최고의 동반자로, 주요 공급 및 수요 데이터를 즉시 시각화하여 필요한 곳에서 실시간으로 확인할 수 있습니다. 이 도구는 구역 위에 풍부하고 실행 가능한 데이터를 자동으로 오버레이하여 구역 분류, 핍 거리, 강도, 구역 크기 등을 각 구역 안에 깔끔하게 표시합니다. 더 이상 복잡함이나 추측이 필요 없습니다—명확하고 역동적인 인사이트로 여러분의 결정을 지원합니다. 트레이더를 위해 제작. 정밀함으로 구동. 인트라데이 스캘핑을 하든 일일 차트에서 주요 구역을 분석하든, 이 인디케이터는 수동으로 그린 구역을 즉시 스마트 구역으로 전환하여 작업 흐름을 방해하지 않으면서 차트의 정보 가치를 높입니다. ### 주요 기능 **자동 레벨 감지** - 차트상의 모든 구역을 즉시 인식 - 공급 또는 수요로 자동 분류—수동 태깅 불필요 **풍부한 실시간 메트릭** - 표시 항목:   - 구역 크기   - 현재 가격과의 실시간 핍 거리   -
Hikkake Trading System for MetaTrader 5 Hikkake Trading System is a price action indicator for MT5 designed to detect false breakout trap patterns built from inside bar structure and confirmation logic. A detailed user guide is available on the author’s MQL5 Blog . Additional updates are available through the author’s   MQL5 Channel . Depending on the current support policy, buyers may receive additional access to selected companion tools developed by the author. Overview Hikkake Trading System
Engulfing RSI
Mykhailo Zakervashevych
Engulfing RSI Indicator Category:   Multi-Timeframe, Candlestick Pattern Confirmation Overview: The Engulfing RSI is a powerful confluence tool that combines the classic candlestick reversal pattern (Bullish or Bearish Engulfing) with the momentum readings of the Relative Strength Index (RSI). It doesn't just show the pattern; it validates it with overbought/oversold context, filtering out weak signals and highlighting higher-probability trade setups. Core Logic: The indicator scans for Engulf
Support & Resistance indicator is a modification of the standard Bill Williams' Fractals indicator. The indicator works on any timeframes. It displays support and resistance levels on the chart and allows setting stop loss and take profit levels (you can check the exact value by putting the mouse cursor over the level). Blue dashed lines are support level. Red dashed lines are resistance levels. If you want, you can change the style and color of these lines. If the price approaches a support lev
CvdDeltaVolumes
Parasbhai N Patel
Delta + CVD & CVD Candles Order-flow indicator combining Delta (Ask–Bid), Cumulative Volume Delta (CVD), and a unique CVD-based synthetic candle system. Shows buy/sell pressure, volume aggressiveness, and momentum shifts with optional Delta histogram, CVD line, and CVD+Delta combined candles. Useful for scalping, intraday trading, divergence detection, and understanding buyer/seller dominance. Overview The Delta + CVD & CVD Candles Indicator combines multiple order-flow tools into one clean
CosmiCLab FIBO
Kirils Subins
CosmiCLab SMC FIBO CosmiCLab SMC FIBO is a professional trading indicator designed for traders who use Smart Money Concepts (SMC), market structure analysis and Fibonacci retracement levels. The indicator automatically detects market swings and builds Fibonacci levels based on the latest impulse movement. It also identifies market structure changes such as BOS (Break of Structure) and CHOCH (Change of Character), helping traders understand the current market direction. CosmiCLab SMC FIBO also pr
Awesome Oscillator by Bill Williams with the ability to fine-tune and replace the averaging algorithms of the indicator, which significantly expands the possibilities of using this oscillator in algorithmic trading and brings it closer in its properties to such an indicator as the MACD. To reduce price noise, the final indicator is processed with an additional Smooth averaging. The indicator has the ability to give alerts, send mail messages and push signals when the direction of movement of th
ProEngulfing For MT5
Ashkan Hazegh Nikrou
ProEngulfing 무료 버전은 QualifiedEngulfing으로, 하루에 하나의 신호로 제한되며 기능이 적습니다. 모든 Koala 제품에 대한 최신 정보를 확인하려면 mql5 커뮤니티에서 Koala Trading Solution 채널에 가입하세요. 가입 링크는 아래와 같습니다: https ://www .mql5 .com /en /channels /koalatradingsolution 이 제품의 MT4 버전은 아래 링크에서 다운로드 가능합니다: https ://www .mql5 .com /en /market /product /52023 ProEngulfing 소개 – MT4용 전문가 수준의 Engulf 패턴 지표 정확성을 극대화한 ProEngulfing을 소개합니다. 이 최신 지표는 포렉스 시장에서 신뢰할 수 있는 Engulf 패턴을 식별하고 강조하는 데 중점을 둔 제품입니다. MetaTrader 4에 맞게 개발된 ProEngulfing은 신뢰도 높은 신호를 제공하기 위해
PipFinite Reversal PRO MT5
Karlo Wilson Vendiola
4.73 (26)
The Controversial 5-Step System That Professional Traders Use To Unlock Trading Success! Reversal Pro effectively combines price action, ideal location and reliable statistics in one smart algorithm. Understanding the market in this unique perspective allows you to recognize reversals professionally. Discover The Secret Of Professional Traders Get instant access www.mql5.com/en/blogs/post/716077 Copy & Paste what professional traders are doing right now! How To Trade Step 1: Trade Setup Sta
SMC Buy Sell Indicator SMC Buy Sell Indicator is a price action-based trading tool designed to identify market structure using Smart Money Concepts. It focuses on detecting meaningful swing points, structural breaks, and confirmation signals directly from chart data. The indicator operates using closed candle data and does not rely on future bars. All calculations are performed on confirmed price action, which helps maintain consistent and stable signals. Key Features Market Structure Detection
PZ Support Resistance MT5
PZ TRADING SLU
3.71 (7)
Unlock key market insights with automated support and resistance lines Tired of plotting support and resistance lines? This is a multi-timeframe indicator that detects and plots supports and resistance lines in the chart with the same precision as a human eye would. As price levels are tested over time and its importance increases, the lines become thicker and darker, making price leves easy to glance and evaluate. [ Installation Guide | Update Guide | Troubleshooting | FAQ | All Products  | 
Auto Fab
Thabang John Wotsa
Indicator Overview AUTO FAB   is a professional, fully-automated Fibonacci retracement indicator for MetaTrader 5 that combines advanced technical analysis with an intuitive control panel. It automatically detects significant swing points and draws Fibonacci retracement levels in real-time, giving traders a powerful tool for identifying potential support/resistance levels and market reversal points.   Core Features 1.   AUTOMATIC SWING POINT DETECTION Smart Algorithm : Automatically identifies s
Blahtech Market Profile MT5
Blahtech Limited
5 (10)
Was: $249  Now: $99   Market Profile defines a number of day types that can help the trader to determine market behaviour. A key feature is the Value Area, representing the range of price action where 70% of trading took place. Understanding the Value Area can give traders valuable insight into market direction and establish the higher odds trade. It is an excellent addition to any system you may be using. Inspired by Jim Dalton’s book “Mind Over Markets”, this indicator is designed to suit the
Doctor Edge Strategy Pro – Range & Breakout Zones Doctor Edge Strategy Pro is a professional indicator designed to simplify market reading based on range and breakout zones. It combines concepts of Price Action, ICT, and Smart Money Concepts, providing an automated and precise approach for traders of synthetic indices, cryptocurrencies, and Forex pairs. How It Works Doctor Edge Strategy Pro automatically draws on the chart: The range zone (lateral accumulation); The upper breakout zone (gr
이 제품의 구매자들이 또한 구매함
SignalTech MT5
Yue Wang
5 (12)
SignalTech MT5 is a trading system for EURUSD, USDCHF, USDJPY, AUDUSD, NZDUSD, EURJPY, AUDJPY, NZDJPY, CADJPY H2 and H3 Timeframe.  It can generate signals with Buy/Sell Arrows and Pop-Up/Sound Alerts. Each signal has clear Entry and Stop Loss levels, which should be automatically flagged on the chart, as well as potential Targets 1, 2, and 3. The Entry and TP levels are fixed after the trade is taken. The exit level is dynamic. If there are signs of a potential short-term trend reversal, the
Divergence Bomber
Ihor Otkydach
4.9 (87)
이 지표를 구매하신 분께는 다음과 같은 혜택이 무료로 제공됩니다: 각 거래를 자동으로 관리하고, 손절/익절 수준을 설정하며, 전략 규칙에 따라 거래를 종료하는 전용 도우미 툴 "Bomber Utility" 다양한 자산에 맞게 지표를 설정할 수 있는 셋업 파일(Set Files) "최소 위험", "균형 잡힌 위험", "관망 전략" 모드로 설정 가능한 Bomber Utility의 셋업 파일 이 전략을 빠르게 설치, 설정, 시작할 수 있도록 돕는 단계별 영상 매뉴얼 주의: 위의 모든 보너스를 받기 위해서는 MQL5 개인 메시지 시스템을 통해 판매자에게 연락해 주세요. 독창적인 커스텀 지표인 “Divergence Bomber(다이버전스 봄버)”를 소개합니다. 이 지표는 MACD 다이버전스(괴리) 전략을 기반으로 한 올인원(All-in-One) 거래 시스템입니다. 이 기술 지표의 주요 목적은 가격과 MACD 지표 간의 다이버전스를 감지하고, **향후 가격이 어느 방향으로 움직일지를 알려주는
Grabber System MT5
Ihor Otkydach
4.83 (23)
탁월한 기술적 지표인 Grabber를 소개합니다. 이 도구는 즉시 사용 가능한 “올인원(All-Inclusive)” 트레이딩 전략으로 작동합니다. 하나의 코드 안에 강력한 시장 기술 분석 도구, 매매 신호(화살표), 알림 기능, 푸시 알림이 통합되어 있습니다. 이 인디케이터를 구매하신 모든 분들께는 다음의 항목이 무료로 제공됩니다: Grabber 유틸리티: 오픈 포지션을 자동으로 관리하는 도구 단계별 영상 매뉴얼: 설치, 설정, 그리고 실제 거래 방법을 안내 맞춤형 세트 파일: 인디케이터를 빠르게 자동 설정하여 최고의 성과를 낼 수 있도록 도와줍니다 다른 전략은 이제 잊어버리세요! Grabber만이 여러분을 새로운 트레이딩의 정점으로 이끌어 줄 수 있습니다. Grabber 전략의 주요 특징: 거래 시간 프레임: M5부터 H4까지 거래 가능한 자산: 어떤 자산이든 사용 가능하지만, 제가 직접 테스트한 종목들을 추천드립니다 (GBPUSD, GBPCAD, GBPCHF, AUDCAD, AU
Btmm state engine pro
Garry James Goodchild
5 (4)
BTMM State Engine Pro is a MetaTrader 5 indicator for traders who use the Beat The Market Maker approach: Asian session context, kill zone timing, level progression, peak formation detection, and a multi-pair scanner from a single chart. It combines cycle state logic with a built-in scanner dashboard so you do not need the same tool on many charts at once. What it does Draws the Asian session range; session times can follow broker server offset or be set in inputs. Tracks level progression (L
Quantum TrendPulse
Bogdan Ion Puscasu
5 (23)
SuperTrend   ,   RSI   ,   Stochastic   의 힘을 하나의 포괄적인 지표로 결합하여 트레이딩 잠재력을 극대화하는 궁극의 트레이딩 도구   인 Quantum TrendPulse를   소개합니다. 정밀성과 효율성을 추구하는 트레이더를 위해 설계된 이 지표는 시장 추세, 모멘텀 변화, 최적의 진입 및 종료 지점을 자신 있게 식별하는 데 도움이 됩니다. 주요 특징: SuperTrend 통합:   주요 시장 추세를 쉽게 따라가고 수익성의 물결을 타세요. RSI 정밀도:   매수 과다 및 매도 과다 수준을 감지하여 시장 반전 시점을 파악하는 데 적합하며 SuperTrend 필터로 사용 가능 확률적 정확도:   변동성이 큰 시장에서 숨겨진 기회를 찾기 위해 확률적 진동   을 활용하고 SuperTrend의 필터로 사용 다중 시간대 분석:   M5부터 H1 또는 H4까지 다양한 시간대에 걸쳐 시장을 최신 상태로 유지하세요. 맞춤형 알림:   맞춤형 거래 조건이 충족되면
Meridian Pro
Ottaviano De Cicco
5 (1)
Meridian Pro 2.00: Professional Multi-Timeframe Trend Matrix for MT5 Meridian Pro 2.00 is a professional adaptive trend matrix for MetaTrader 5. It combines the original Meridian trend engine, a clean chart ribbon, closed-bar signal arrows, an 8-timeframe dashboard, Fuel momentum, weighted consensus, synthetic HTF processing and chart-native higher-timeframe context lines. The goal is simple: read current trend, multi-timeframe structure, strength, momentum and EA-ready state from one discipline
소개       Quantum Breakout PRO   , 브레이크아웃 존 거래 방식을 변화시키는 획기적인 MQL5 지표! 13년 이상의 거래 경험을 가진 숙련된 트레이더 팀이 개발한       퀀텀 브레이크아웃 PRO       혁신적이고 역동적인 브레이크아웃 존 전략으로 거래 여정을 새로운 차원으로 끌어올리도록 설계되었습니다. Quantum Breakout Indicator는 5개의 이익 목표 영역이 있는 브레이크아웃 영역의 신호 화살표와 브레이크아웃 상자를 기반으로 한 손절 제안을 제공합니다. 초보자 거래자와 전문 거래자 모두에게 적합합니다. Quantum EA 채널:       여기를 클릭하세요 중요한! 구매 후 설치 매뉴얼을 받으려면 개인 메시지를 보내주십시오. 추천: 기간: M15 통화쌍: GBPJPY, EURJPY, USDJPY,NZDUSD, XAUUSD 계정 유형: 스프레드가 매우 낮은 ECN, Raw 또는 Razor 브로커 시간: GMT +3 중개인 :
OmniSync Projection
Antonio-alin Teculescu
5 (1)
Chronos Fractal Engine is an innovative price projection indicator for MetaTrader 5, designed to transform your technical analysis by intelligently identifying and projecting historical price patterns. Built upon an advanced correlation algorithm and the fractal principles of the market, this powerful tool visualizes potential future price movements, giving you a unique edge in your trading decisions. What is Chronos Fractal Engine? At its core, the Chronos Fractal Engine employs a sophisticat
Azimuth Pro
Ottaviano De Cicco
5 (7)
Azimuth Pro V2: Synthetic Fractal Structure and Confirmed Entries for MT5 Overview Azimuth Pro is a multi-level swing structure indicator by Merkava Labs . Four nested swing layers, swing-anchored VWAP, ABC pattern detection, three-timeframe structural filtering, and closed-bar confirmed entries — one chart, one workflow from micro-swings to macro-cycles. This is not a blind signal product. It is a structure-first workflow for traders who care about location, context, and timing. V2 Launch Offe
우선적으로, 이 거래 도구는 전문적인 거래에 이상적인 비-다시 그리기 및 지연되지 않는 지표입니다.  온라인 강좌, 사용자 매뉴얼 및 데모. 스마트 가격 액션 컨셉트 인디케이터는 신규 및 경험 많은 트레이더 모두에게 매우 강력한 도구입니다. Inner Circle Trader Analysis 및 Smart Money Concepts Trading Strategies와 같은 고급 거래 아이디어를 결합하여 20가지 이상의 유용한 지표를 하나로 결합합니다. 이 인디케이터는 스마트 머니 컨셉트에 중점을 두어 대형 기관의 거래 방식을 제공하고 이동을 예측하는 데 도움을 줍니다.  특히 유동성 분석에 뛰어나 기관이 어떻게 거래하는지 이해하는 데 도움을 줍니다. 시장 트렌드를 예측하고 가격 변동을 신중하게 분석하는 데 탁월합니다. 귀하의 거래를 기관 전략에 맞추어 시장의 동향에 대해 더 정확한 예측을 할 수 있습니다. 이 인디케이터는 시장 구조를 분석하고 중요한 주문 블록을 식별하고 다양
RelicusRoad Pro MT5
Relicus LLC
5 (24)
RelicusRoad Pro: 퀀트 시장 운영 체제 70% 할인 평생 이용권 (한정 시간) - 2,000명 이상의 트레이더와 함께하세요 왜 대부분의 트레이더는 "완벽한" 지표를 가지고도 실패할까요? 진공 상태에서 단일 개념 만으로 거래하기 때문입니다. 문맥 없는 신호는 도박입니다. 지속적인 승리를 위해서는 컨플루언스(중첩) 가 필요합니다. RelicusRoad Pro는 단순한 화살표 지표가 아닙니다. 완전한 퀀트 시장 생태계 입니다. 독점적인 변동성 모델링을 사용하여 가격이 이동하는 "공정 가치 로드"를 매핑하고, 단순 노이즈와 실제 구조적 돌파를 구분합니다. 추측은 그만두세요. 기관급 로드 로직으로 거래를 시작하세요. 핵심 엔진: "Road" 알고리즘 시스템의 중심에는 시장 상황에 실시간으로 적응하는 동적 변동성 채널인 Road Algo 가 있습니다. 세이프 라인(평형) 과 가격이 수학적으로 반전될 가능성이 높은 확장 레벨 을 투영합니다. Simple Road: 일반적인 시장을 위
Entry Points Pro for MT5
Yury Orlov
4.48 (138)
다시 색을 칠하지 않고 거래에 진입할 수 있는 정확한 신호를 제공하는 MT5용 지표입니다. 외환, 암호화폐, 금속, 주식, 지수 등 모든 금융 자산에 적용할 수 있습니다. 매우 정확한 추정값을 제공하고 매수와 매도의 가장 좋은 시점을 알려줍니다. 하나의 시그널로 수익을 내는 지표의 예와 함께 비디오 (6:22)시청하십시오! 대부분의 거래자는 Entry Points Pro 지표의 도움으로 첫 거래 주 동안 트레이딩 결과를 개선합니다. 저희의   Telegram Group 을 구독하세요! Entry Points Pro 지표의 좋은점. 재도색이 없는 진입 신호 신호가 나타나고 확인되면(시그널 캔들이 완성된 경우) 신호는 더 이상 사라지지 않습니다. 여타 보조지표의 경우 신호를 표시한 다음 제거되기 때문에 큰 재정적 손실로 이어집니다. 오류 없는 거래 게시 알고리즘을 통해 트레이드(진입 또는 청산)를 할 이상적인 순간을 찾을 수 있으며, 이를 통해 이를 사용하는 모든 거래자의 성공률이
ARICoins
Temirlan Kdyrkhan
ARICoin is a powerful trading companion designed to generate high-probability entry signals with dynamic TP/SL/DP levels based on volatility. Built-in performance tracking shows win/loss stats, PP1/PP2 hits, and success rates all updated live. Key Features: Buy/Sell signals with adaptive volatility bands Real-time TP/SL/DP levels based on ATR Built-in MA Filter with optional ATR/StdDev volatility Performance stats panel (Success, Profit/Loss, PP1/PP2) Alerts via popup, sound, push, or email Cust
Advanced Supply Demand MT5
Bernhard Schweigert
4.53 (15)
현재 33% 할인! 초보자나 전문 트레이더를 위한 최고의 솔루션! 이 보조지표는 우리가 다수의 독창적 기능과 새로운 공식을 통합한 독특하고 고품질이며 저렴한 거래 도구입니다. 이 업데이트를 통해 이중 시간대를 표시할 수 있습니다. 더 높은 TF를 표시할 수 있을 뿐만 아니라 차트 TF와 더 높은 TF 모두를 표시할 수 있습니다: 중첩 영역 표시. 모든 Supply Demand 트레이더들이 좋아할 것입니다. :) 중요한 정보 공개 Advanced Supply Demand의 잠재력을 극대화하려면 다음을 방문하십시오. https://www.mql5.com/ko/blogs/post/720245   진입 또는 목표의 명확한 트리거 포인트를 정확히 찾아냄으로 해서 거래가 어떻게 개선될지 상상해 보십시오. 새로운 알고리즘을 기반으로 매수자와 매도자 간의 잠재적인 불균형을 훨씬 더 쉽게 분간할 수 있습니다. 왜냐하면 가장 강한 공급영역과 가장 강한 수요 영역과 과거에 어떻게 진행 되었는지를(이전
Current event:  https://c.mql5.com/1/326/A2SR2025_NoMusic.gif MT5용 A2SR 지표: 자동화된 실제 수요 및 공급(S/R). + 거래 상품. Product description in English here. --   Guidance   : -- at   https://www.mql5.com/en/blogs/post/734748/page4#comment_16532516 -- and  https://www.mql5.com/en/users/yohana/blog 더욱 스마트한 거래 결정을 위한 강력하고, 정확하며, 시간 절약적인 기능 + EA 호환 객체. 주요 장점 선행 실제 SR 레벨(지연 또는 재표시 없음) 2014년부터 MT4 에서 수년간 입증된 신뢰성을 바탕으로 A2SR이 이제 MetaTrader 5에서도 사용 가능합니다. 가격이 도달하기 전에 실제 지지선과 저항선을 식별하는 선행적이고 재표시 없는 지표를 통해 트레이더에
KT Alpha Hunter Arrows MT5
KEENBASE SOFTWARE SOLUTIONS
대부분의 화살표 인디케이터는 신호만 보여주고, 나머지 판단은 모두 트레이더에게 맡깁니다. KT Alpha Hunter Arrows는 완성된 트레이딩 플랜을 제공합니다. 각 신호 화살표가 표시될 때마다 진입선, 손절선, 네 개의 익절 목표, 그리고 현재 심볼과 시간대가 지금 거래할 가치가 있는지 알려주는 실시간 엣지 판정이 함께 그려집니다. 포함된 Trade Manager EA는 사용자가 직접 진입한 뒤의 실행 관리를 맡아, 시장이 흔들리고 감정이 개입되기 쉬운 상황에서도 거래 원칙을 유지할 수 있도록 도와줍니다. 리페인트 없음. 종가 확정 후 신호만 표시. Forex, Gold, Indices 및 사용자가 거래하는 다양한 MT5 지원 상품에 맞게 설계되었습니다. 주요 기능 캔들이 마감된 후에만 표시되는 리페인트 없는 매수 및 매도 화살표. 각 신호마다 진입선, 구조적 손절선, 네 개의 익절 목표 표시. 현재 차트에서 매수와 매도 셋업을 별도로 평가하는 Edge Dashboard.
META Points PRO MT5
Polina Balahura
5 (1)
META 포인트 PRO       — 는 추세 추종 도구로, 거래에서 추측을 배제하고 시장이 이미 결정을 내린 지점을 보여줍니다. 이 지표는 추세, 추세선 및 구조가 변화하는 주요 지점을 식별하고 주요 참여자들이 포지션을 취할 수 있도록 가격이 되돌아오는 영역을 강조합니다. 단순히 가격 움직임만 보는 것이 아니라, 그 이면에 숨겨진 논리까지 이해할 수 있습니다. 모든 신호는 캔들 마감 후 기록되며, 다시 그려지지 않고 차트에 저장되므로 상황을 확실하게 분석하고 결정을 내릴 수 있습니다. 거래 목표(이익 실현) 또한 표시됩니다. 이 지표의 효과에 대해 완벽한 확신을 가지실 수 있도록 자동 통계 자료를 제공해 드립니다. 방향 전환 후에는 손절매 수준과 해당 수준이 지능적으로 점진적으로 이동하는 모습(Move SL)을 표시해주는데, 이는 매우 중요합니다.       감소시킨다       위험       위치별로. 손절매/이익실현/RR 오른쪽에 내장된 패널은 현재 글로벌 추세 방향의 시장
Bill Williams Advanced
Siarhei Vashchylka
5 (11)
Bill Williams Advanced is designed for automatic chart analysis using Bill Williams' "Profitunity" system. The indicator analyzes four timeframes at once. Manual (Be sure to read before purchasing) Advantages 1. Analyzes the chart using Bill Williams' "Profitunity" system. Signals are displayed in a table in the corner of the screen and on the price chart. 2. Finds all known AO and AC signals, as well as zone signals. Equipped with a trend filter based on the Alligator. 3. Finds "Divergence Bar
" Dynamic Scalper System MT5 " 지표는 추세 파동 내에서 스캘핑 방식으로 거래하도록 설계되었습니다. 주요 통화쌍 및 금에서 테스트되었으며, 다른 거래 상품과의 호환성이 가능합니다. 추가적인 가격 변동 지원을 통해 추세에 따라 단기 포지션 진입 신호를 제공합니다. 지표의 원리 큰 화살표는 추세 방향을 결정합니다. 작은 화살표 형태의 스캘핑 신호를 생성하는 알고리즘은 추세 파동 내에서 작동합니다. 빨간색 화살표는 상승 방향을, 파란색 화살표는 하락 방향을 나타냅니다. 민감한 가격 변동선은 추세 방향으로 그려지며, 작은 화살표의 신호와 함께 작용합니다. 신호는 다음과 같이 작동합니다. 적절한 시점에 선이 나타나면 진입 신호가 형성되고, 선이 있는 동안 미결제 포지션을 유지하며, 완료되면 거래를 종료합니다. 권장되는 작업 시간대는 M1~H4입니다. 화살표는 현재 캔들에 형성되며, 다음 캔들이 이미 시작되었더라도 이전 캔들의 화살표는 다시 그려지지 않습니다. 입
Meravith MT5
Ivan Stefanov
5 (1)
마켓 메이커를 위한 도구. Meravith는 다음과 같은 기능을 제공합니다: 모든 타임프레임을 분석하고 현재 유효한 추세를 표시합니다. 강세와 약세 거래량이 동일한 유동성 구간(거래량 균형 구간)을 강조 표시합니다. 서로 다른 타임프레임의 모든 유동성 레벨을 차트에 직접 표시합니다. 텍스트 기반 시장 분석을 생성하여 참고용으로 제공합니다. 현재 추세를 기반으로 목표가, 지지선 및 손절가를 계산합니다. 거래의 위험 대비 보상 비율(Risk/Reward)을 계산합니다. 계좌 잔고에 따라 포지션 크기를 산출하고 잠재 수익을 추정합니다. 시장에 중대한 변화가 발생할 경우 경고도 제공합니다. 지표의 주요 라인: 강세/약세 거래량 소진 라인 — 목표가로 사용됩니다. 시장 추세를 나타내는 라인. 시장이 강세인지 약세인지에 따라 색상이 변경되며 추세 지지선 역할을 합니다. 색상은 주로 시장 심리를 보여줍니다. 거래량 균형선(Eq). Eq(Volume Equilibrium) 라인은 시스템의 핵심입니
Fusion Monthly Levels + PinBar + Marubozu 설명 이 독특한 지표는 세 가지 강력한 기술 분석 도구를 하나로 결합합니다: 월간 레벨 (High, Low, Open, Close) – 주요 지지 및 저항 구간을 식별하기 위해. PinBar 감지 – 가격 반전을 신호하는 신뢰할 수 있는 캔들 패턴. Marubozu 감지 – 강한 추세 캔들로 방향성 모멘텀을 나타냅니다. 이 결합을 통해 시각적이고, 종합적이며 반응 속도가 빠른 시장 예측 도구를 사용할 수 있습니다. 장점 기관 레벨 + 가격 행동(Price Action) 결합. 명확한 시각 신호: PinBar는 파랑/빨강 화살표, Marubozu는 파랑/빨강 사각형. 모든 자산에 사용 가능 (외환, 지수, 암호화폐, 원자재, 주식). 사용자 정의 가능한 매개변수 (참조 기간, 꼬리 길이, 화살표 스타일). 최적화된 코드, 여러 차트에서도 지연 없음. MetaTrader 5 완전 호환. 신호 강
Berma Bands
Muhammad Elbermawi
5 (8)
Berma Bands(BBs) 지표는 시장 동향을 파악하고 이를 활용하려는 트레이더에게 귀중한 도구입니다. 가격과 BBs 간의 관계를 분석함으로써 트레이더는 시장이 추세 단계인지 범위 단계인지를 분별할 수 있습니다. 자세한 내용을 알아보려면 [ Berma Home Blog ]를 방문하세요. 버마 밴드는 세 개의 뚜렷한 선으로 구성되어 있습니다. 어퍼 버마 밴드, 미들 버마 밴드, 로어 버마 밴드입니다. 이 선들은 가격 주위에 그려져 전체 추세에 대한 가격 움직임을 시각적으로 표현합니다. 이 밴드들 사이의 거리는 변동성과 잠재적인 추세 반전에 대한 통찰력을 제공할 수 있습니다. 버마 밴드 라인이 각각에서 분리될 때, 그것은 종종 시장이 횡보 또는 범위 이동 기간에 접어들고 있음을 시사합니다. 이는 명확한 방향 편향이 없음을 나타냅니다. 트레이더는 이러한 기간 동안 추세를 파악하기 어려울 수 있으며 더 명확한 추세가 나타날 때까지 기다릴 수 있습니다. 버마 밴드 라인이 단일 라인으로
Gartley Hunter Multi
Siarhei Vashchylka
5 (11)
Gartley Hunter Multi - An indicator for searching for harmonic patterns simultaneously on dozens of trading instruments and on all possible timeframes. Manual (Be sure to read before purchasing) | Version for MT4 Advantages 1. Patterns: Gartley, Butterfly, Shark, Crab. Bat, Alternate Bat, Deep Crab, Cypher 2. Simultaneous search for patterns on dozens of trading instruments and on all possible timeframes 3. Search for patterns of all possible sizes. From the smallest to the largest 4. All fou
Weltrade Spike Sentinel
Batsirayi L Marango
5 (1)
Introducing Indicator for PainX and GainX Indices Traders on Weltrade Get ready to experience the power of trading with our indicator, specifically designed for Weltrade   broker's PainX and GainX Indices.  Advanced Strategies for Unbeatable Insights Our indicator employs sophisticated strategies to analyze market trends, pinpointing optimal entry and exit points.  Optimized for Maximum Performance To ensure optimal results, our indicator is carefully calibrated for 5-minute timeframe charts on
CRT Multi-Timeframe Market Structure & Liquidity Sweep Indicator Non-Repainting | Multi-Asset | MT4 Version Available MT4 Version: https://www.mql5.com/en/market/product/162556 Full Setup Guide: https://www.mql5.com/en/blogs/post/767525 Indicator Overview CRT Ghost Candle HTF Fractal is a complete institutional-grade market structure toolkit for MetaTrader 5. It projects higher-timeframe candle structure, CRT trap levels, session levels, previous period highs and lows, pivot points, and a real
CGE Trading Suite
Carl Gustav Johan Ekstrom
5 (2)
Institutional-Grade Analytics for MT5 C GE Trading Suite delivers the analytical edge typically reserved for professional trading desks. The platform integrates a full suite of analytical tools into one seamless workflow: dynamic grid mapping, liquidity behavior analysis, ECM, trend lines, MIDAS, trade cycles, and directional channel projections. Together, these provide a unified view of market structure and momentum. Directional clarity is further enhanced by the capital flow index, which meas
AriX
Temirlan Kdyrkhan
1 (4)
AriX Indicator for MT5 A powerful trend-following and signal-evaluation tool AriX is a custom MT5 indicator that combines Moving Averages and ATR-based risk/reward logic to generate clear buy/sell signals. It visualizes dynamic SL/TP levels, evaluates past trade outcomes, and displays win/loss statistics in a clean on-chart panel. Key features include: Buy/Sell signals based on MA crossovers ATR-based SL/TP1/TP2/TP3 levels with visual lines and labels Signal outcome tracking with real-time stat
The Propfolio Master Suite is the ultimate all-in-one analytical workstation for professional traders. Combining the power of the Beat The Market Maker (BTMM) methodology, Smart Money Concepts (SND/Liquidity), and Advanced Volume Profile, this suite replaces a dozen different indicators with one heavily optimized, beautifully designed engine. Monitor up to 14 pairs simultaneously from a single chart, instantly identify market cycles, and seamlessly map institutional footprints with the click of
Daily Zone Breaker
Alex Amuyunzu Raymond
5 (1)
Daily Zone Breaker - MT5 Indicator  Overview Daily Zone Breaker is an advanced multi-kernel regression indicator that identifies critical price zones and breakthrough moments with surgical precision. Using sophisticated kernel smoothing algorithms, it filters out market noise to reveal true directional momentum and key trading zones where price is most likely to break through resistance or support levels.  What It Does Core Functionality Daily Zone Breaker analyzes price action through 17 differ
RFI levels PRO MT5
Roman Podpora
3.67 (3)
이 지표는 추세 반전 지점과 가격 반등 영역을 정확하게 보여줍니다.       주요 투자자들   . 새로운 트렌드가 형성되는 곳을 파악하고 최대한 정확하게 의사결정을 내리며 모든 거래를 완벽하게 통제합니다. TREND LINES PRO   지표와 함께 사용할 때 최대의 잠재력을 발휘합니다.  VERSION MT4 지표가 보여주는 내용: 새로운 추세의 시작 시 활성화되는 반전 구조 및 반전 수준. 최소한의 위험 대비 수익률을 갖는 이익 실현   (TAKE PROFIT)   및   손절매(STOP LOSS)   레벨 표시       RR 1:2   . 지능형 손실 감소 로직이 적용된 손절매 기능. 지정된 지표에서 두 가지 추세 유형에 대한 반전 패턴을 표시합니다. 지표: 트렌드를 따라   트렌드 라인 프로   (글로벌 트렌드 변화) 트렌드 프로   (빠른 트렌드 변화) 간단하고 효과적입니다       스캐너       실시간 추세 (신규). 다중 시간 프레임 도구 필터링. 표시하다  
제작자의 제품 더 보기
Fusion Monthly Levels + PinBar + Marubozu 설명 이 독특한 지표는 세 가지 강력한 기술 분석 도구를 하나로 결합합니다: 월간 레벨 (High, Low, Open, Close) – 주요 지지 및 저항 구간을 식별하기 위해. PinBar 감지 – 가격 반전을 신호하는 신뢰할 수 있는 캔들 패턴. Marubozu 감지 – 강한 추세 캔들로 방향성 모멘텀을 나타냅니다. 이 결합을 통해 시각적이고, 종합적이며 반응 속도가 빠른 시장 예측 도구를 사용할 수 있습니다. 장점 기관 레벨 + 가격 행동(Price Action) 결합. 명확한 시각 신호: PinBar는 파랑/빨강 화살표, Marubozu는 파랑/빨강 사각형. 모든 자산에 사용 가능 (외환, 지수, 암호화폐, 원자재, 주식). 사용자 정의 가능한 매개변수 (참조 기간, 꼬리 길이, 화살표 스타일). 최적화된 코드, 여러 차트에서도 지연 없음. MetaTrader 5 완전 호환. 신호 강
Order Block Pro MT5
N'da Lemissa Kouame
Order Block Pro (MQL5) – 버전 1.0 작성자: KOUAME N'DA LEMISSA 플랫폼: MetaTrader 5 설명: Order Block Pro 는 차트에서 **강세 및 약세 오더 블록(Order Blocks)**을 자동으로 감지하는 고급 지표입니다. 횡보 캔들 이후 강한 상승/하락 캔들을 분석하여 가격이 급격히 움직일 가능성이 있는 주요 구간을 표시합니다. 트레이더에게 적합: 정확한 진입 및 청산 지점을 찾고 싶은 경우 동적 지지 및 저항 구간을 파악하고 싶은 경우 리스크 관리 및 거래 전략을 향상시키고 싶은 경우 주요 기능: 강세 OB 감지: 횡보 캔들 후 강한 상승이 발생하면 차트에 녹색 화살표 표시 약세 OB 감지: 횡보 캔들 후 강한 하락이 발생하면 차트에 빨간 화살표 표시 완전한 사용자 정의 가능: 횡보 캔들의 최대 실체 비율 ( BodyMaxRatio ) 다음 캔들의 최소 비율로 움직임 확인 ( NextCandleMinPct ) 차트 화살표
Canal H Pro
N'da Lemissa Kouame
NuageTrend Pro
N'da Lemissa Kouame
Nuage Trend Pro – 추세 추적 및 Kijun 신호 Nuage Trend Pro 는 MetaTrader 5 용 고급 지표로, 강력한 시장 추세 를 빠르게 파악하고 Kijun 교차를 통해 최적의 진입 지점 을 찾아줍니다. 차트를 명확한 시각적 지도 로 변환하여 정확하고 자신감 있는 트레이딩 을 지원합니다. 주요 기능 자동 Kijun 교차 감지 : 가격이 기준선을 넘는 중요한 순간을 즉시 표시. 동적 추세 구름 : 시장 방향에 따라 차트 색상이 변경됩니다 – 상승은 녹색, 하락은 빨강. 명확한 매수/매도 신호 : 거래 기회를 빠르게 식별 가능. 사용자 설정 가능 : Kijun 기간, 구름 색상, 표시 스타일을 전략에 맞게 조정 가능. Nuage Trend Pro를 선택해야 하는 이유 간단하고 직관적인 시장 추세 시각화 다용도 : 모든 타임프레임과 거래 상품(Forex, 지수, 원자재)에서 사용 가능 초보자부터 전문가까지 진입 및 청산 최적화 가능 다른 지표나
Monthly Levels Pro
N'da Lemissa Kouame
ENGLISH – Monthly Levels Pro v1.0 The Ultimate Monthly Market Levels Indicator Master key market zones at a glance. Monthly Levels Pro helps you analyze long-term trends and spot essential support and resistance levels by automatically displaying the High, Low, Open, and Close of a monthly candle. Why Choose Monthly Levels Pro? Instant Analysis – See monthly levels immediately without checking candles manually. Smarter Trading – Spot reversal or breakout zones at a glance. Clear Visuals –
지표 Monthly Levels + Pin Bar Pro 설명 Monthly Levels + Pin Bar Pro 지표는 월간 주요 레벨 (고가, 저가, 시가, 종가) 과 가격 행동 반전 패턴 (Pin Bar) 의 자동 감지를 결합합니다. 기술적 트레이더와 기관 투자자를 위해 설계되었으며, 시장 반응 구역을 예측하고 차트에 명확한 시그널을 표시합니다. 주요 기능 자동 월간 레벨 : 고가, 저가, 시가, 종가. 실시간 Pin Bar 탐지 (강세 & 약세). 시각적으로 명확한 표시 : 수평선 + 신호 화살표. ️ 사용자 정의 가능 : 타임프레임, 화살표 코드, 크기, 오프셋. 최적화됨 : 낮은 리소스 사용, 스캘핑 & 스윙에 적합. ️ EA 호환 : 자동매매 전략에 통합 가능. ️ 사용 방법 원하는 차트에 지표를 추가합니다. 월간 고가, 저가, 시가, 종가 가 자동으로 표시됩니다. 화살표 확인: 파란색 화살표 → 강세 Pin Bar (월간 지지선
Yearly Levels Pro
N'da Lemissa Kouame
8️⃣ 한국어 (Korean) 버전: 1.0 개발자: KOUAME N'DA LEMISSA 플랫폼: MetaTrader 5 (MT5) 종류: 기술 지표 / 연간 가격 수준 설명: Yearly Levels Pro v1.0는 KOUAME N'DA LEMISSA가 개발한 강력한 지표로, 연간 주요 가격 수준을 빠르게 식별할 수 있습니다. 특정 연도의 시가, 고가, 저가, 종가 를 자동으로 계산하여 차트에 색상 수평선으로 표시합니다. 주요 기능: High(빨강), Low(파랑), Open(녹색), Close(주황) Year_Shift 로 연도 선택 가능 모든 상품과 시간 프레임 호환 실시간 자동 업데이트 매개변수: Year_Shift : 0 = 올해, 1 = 작년, 등 특징: 간단하고 직관적 연간 지지/저항 수준 확인 가능 장기 트레이딩 분석에 최적 사용 팁: High/Low 라인으로 지지/저항 영역 확인 현재 가격과 Open/Close 비교로 추세 분석 캔들 패턴 또는 다른 지표와 결합
Quarterly Levels Pro
N'da Lemissa Kouame
Korean Version (한국어) Quarterly Levels Pro v1.0 – 상업 공지 제품명: Quarterly Levels Pro v1.0 개발자: KOUAME N'DA LEMISSA 버전: 1.0 설명: Quarterly Levels Pro 는 KOUAME N'DA LEMISSA 가 개발한 MetaTrader 5 용 전문 지표로, 분기별 High, Low, Open, Close 레벨을 자동으로 표시합니다. 트레이더는 차트에서 주요 지지 및 저항 구간을 명확히 시각화하여 중기 거래 의사결정을 용이하게 할 수 있습니다. 주요 기능: 분기별 High, Low, Open, Close 레벨 자동 표시 각 레벨 색상 사용자 지정 가능: High: 빨강 Low: 파랑 Open: 초록 Close: 주황 시각적 구분을 위한 선 굵기 조절 가능 Quarter_Shift 파라미터를 사용하여 현재, 이전 또는 이전 분기 레벨 표시 가능 MT5의 모든 통화쌍 및 금융상품과 호환 파라
한국어 (Coréen) 설명 Multi-Timeframe Levels Pro v1.0 은 차트에 자동으로 일간, 월간, 분기, 연간 고점, 저점, 시가, 종가를 표시합니다. 주요 지지/저항 구역 및 돌파 지점을 확인하는 데 이상적입니다. 주요 기능 자동 표시: Daily / Monthly / Quarterly / Yearly 레벨 고점/저점/시가/종가 색상 구분 이전 기간 분석을 위한 Shift 설정 모든 시장 지원: 외환, 지수, 원자재, 주식, 암호화폐 가볍고 빠른 동작, 프라이스 액션, 스윙, 스캘핑 최적화 파라미터 DailyShift → 현재 또는 이전 일 MonthlyShift → 현재 또는 이전 월 QuarterlyShift → 현재 또는 이전 분기 YearlyShift → 현재 또는 이전 년도 추천 사용법 연간/분기 레벨은 주요 지지/저항 확인, 일간/월간은 단타 및 인트라데이 매매에 활용하세요.
Marubozu Pro MT5
N'da Lemissa Kouame
Commercial Description – Marubozu Pro (MT5) Description Marubozu Pro is a professional indicator for MetaTrader 5 that automatically detects Marubozu candles (bullish and bearish) directly on your chart. It helps traders identify strong market momentum where buyers or sellers take full control, by displaying clear visual arrows for buy and sell signals. This tool is designed to be simple, effective, and fast , perfect for manual trading or as a filter in automated strategies. Key Features
ETE Detector – Head & Shoulders Indicator Turn your charts into clear and actionable trading opportunities! About the Indicator The ETE Detector automatically identifies Head & Shoulders (H&S) and Inverse Head & Shoulders (IH&S) patterns — classic trend reversal formations. No more spending hours searching manually: your analysis becomes fast, accurate, and visual . What You Get Automatic detection of trend reversal patterns Colored arrows : green for buys (Inverse H&S), red for sell
ABCD Lemissa + 월간 레벨 + 핀바 + 마루보즈 지표 설명 이 지표는 여러 강력한 도구를 통합 하여 시장 전체를 시각적으로 분석할 수 있도록 설계되었습니다. ABCD Lemissa – ABCD 패턴 을 자동으로 감지하고 A, B, C, D 지점, 지지/저항 구역 및 매수/매도 화살표를 표시합니다. 월간 레벨 (Monthly Levels) – 월간 캔들의 High, Low, Open, Close 레벨을 표시하여 중요한 구역을 식별합니다. 핀바 & 마루보즈 – 핀바 캔들 (반전 신호)과 마루보즈 캔들 (강력한 추세 캔들)을 자동으로 감지하며, 커스터마이즈 가능한 화살표 및 심볼을 제공합니다. 이 지표는 완전히 시각적 이며, 라인, 화살표, 사각형을 결합하여 시장 분석과 거래 결정을 지원합니다. 주요 기능 ABCD Lemissa A, B, C, D 포인트 자동 감지 BUY 및 SELL 신호 화살표 표시 X1 / X2 사각형으로 지지 및 저항 구역 강조 월간 레벨 월간
ETE Detector v4.0 (Head & Shoulders) Author: KOUAME N’DA LEMISSA Version: 4.0 Platform: MetaTrader 5 Indicator Type: Chart / Visual Trading Signals Overview The ETE Detector v4.0 is a technical indicator designed to automatically detect classic and inverse Head & Shoulders patterns (H&S) on MT5 charts. These patterns are widely used to anticipate trend reversals. With this tool, traders can: Detect sell signals (classic H&S) and buy signals (inverse H&S) with accuracy. Easily visualize patterns
ETE Detector puissant
N'da Lemissa Kouame
Aperçu – ETE DETECTOR POWER v5.0 (pour plus d'informations) "헤드 앤 숄더" 패턴 자동 감지 ETE DETECTOR POWER v5.0 est maintenant disponible en ligne . 도구입니다. Il s'agit d'une question de santé et de sécurité . 최적화된 객체 관리 시스템(MaxObjects) 덕분에, 바쁜 차트나 다중 시간 프레임에서도 지표가 C'est vrai. 주요 기능 Nom du produit :  H&S(매도) et H&S(매수) 어깨, 머리, 넥라인 명확하게 표시 반전 구간 자동 표시 (빨강=매도, 초록=매수) ACHETER/VENDRE 화살표 로 즉시 기회 표시 순환 객체 풀 로 스마트 관리 완전 사용자 설정 가능: 분석 캔들 수, 최소 거리, 대칭 허용 범위, 최대 패턴 수, 직사각형 스타일, 마커 크기 및 색상 트레이더 장점 시간 절약:
Dynamique mensuelle des plages hautes et basses v1.0 Auteur : KOUAME N'DA LEMISSA Description : L' indicateur dynamique mensuel de fourchette haute et basse affiche les niveaux mensuels clés sur votre graphique grâce à des fonctionnalités avancées de suivi dynamique. Il permet aux traders de visualiser facilement les zones de support et de résistance mensuelles, ainsi que les zones où le prix tend à dépasser ou à tester ces niveaux, offrant ainsi des opportunités de trading précises. P
Monthly High & Low Dynamic Range + Liquidity Zones v1.2 Author: KOUAME N'DA LEMISSA Description: Transform your market analysis with this powerful indicator that combines: Key Monthly Levels: High, Low, Open, and Close to identify the most important support and resistance zones. Dynamic High/Low Range: Automatically tracks extreme price movements to detect significant market shifts. Liquidity Zones: Visual rectangles showing areas where liquidity is concentrated (Buy/Sell). The thickness and c
Booster Trading Pro V
N'da Lemissa Kouame
한국어 (coréen / 한국어) Booster Trading Pro Modèle  : KOUAME N'DA LEMISSA Modèle : MetaTrader 5 Modèle : 다기능 기술 지표 설명 Booster Trading Pro est également disponible en ligne. Il s'agit d'un sujet d'intérêt général : 월간 주요 레벨: 최고가, 최저가, 시가, 종가로 지지 및 저항 구역을 빠르게 식별. 동적 고저 범위: 월간 레벨 상하에서 가격의 극단적 움직임을 추적. 동적 시가 범위: 월간 시가 기준으로 중요한 가격 수준을 탐지. 자동 유동성 영역: 동적 색상 직사각형으로 잠재적 매수/매도 영역 시각화. 주요 특징 C'est vrai, c'est vrai. Je suis en train de le faire. Il s'agit d'une personne qui s'est occupée de lui. Il s'agit d'
StructureBlocksAuto + MensuelOU La puissance de la structure rencontre la précision mensuelle Description Fusion StructureBlocksAuto + MonthlyOR est un indicateur tout-en-un avancé combinant la détection de la structure du marché (swings automatiques, plus hauts/plus bas et blocs de structure) avec le système Monthly Open Range (MOR) . Il offre une combinaison professionnelle d'analyse de la structure institutionnelle et de niveaux clés mensuels pour vous aider à détecter les zones de tradi
Channel Ultima
N'da Lemissa Kouame
Channel Ultima – Indicateur Multi-Canal Dynamique Description courte Channel Ultima est un indicateur avancé qui trace automatiquement trois canaux dynamiques du marché. Il offre une lecture claire des zones de support, de résistance et d'équilibre , idéale pour les traders techniques et structurels. Présentation détaillée Channel Ultima détecte et affiche trois canaux indépendants associés sur les pivots majeurs et mineurs du marché. Chaque canal représente une zone de pression sur le p
Carte de liquidité institutionnelle Pro Voyez ce que voient les institutions — avant tout le monde Aperçu Institutional Liquidity Map Pro est un indicateur professionnel conçu pour cartographier les zones de liquidité institutionnelle à l'aide des niveaux mensuels les plus hauts et les plus bas . Il détecte automatiquement les zones de stop-hunt , les zones de retournement potentiel et les zones d'accumulation/distribution institutionnelles . L'indicateur suit dynamiquement jusqu'à trois ni
SMXZones
N'da Lemissa Kouame
SMXZones – Zones de liquidité pour investisseurs avertis Liquidités institutionnelles • Biais de marché • Signaux PinBar Auteur : KOUAME N'DA LEMISSA Investissez comme un investisseur avisé SMXZones est un indicateur de trading puissant conçu pour révéler les zones de liquidité institutionnelle, la structure du marché et la tendance directionnelle du marché . Cet outil aide les traders à voir clairement où les institutions accumulent des liquidités et où les mouvements de prix importants sont su
ICT Smart Pro
N'da Lemissa Kouame
ICT Smart Pro Argent intelligent – ​​Déséquilibre des TIC – Limites de temps institutionnelles – Structure du marché 설명 ICT Smart Pro propose Smart Money et ICT (Inner Circle Trader) pour votre entreprise . C'est vrai. 이 지표는 여러 기관용 도구를 하나로 통합하여, 대형 금융 기관이 시장에 진입하는 Il s'agit d'une personne qui s'est occupée de lui . ICT Smart Pro est actuellement disponible en ligne : TIC 불균형 영역 (BISI / SIBI) 기관 시간 사이클 월별 주요 가격 수준 시장 구조 영역 Il s'agit d'une personne qui s'est retrouvée dans une situation
Time Box Pro
N'da Lemissa Kouame
Logiciel MQL5 – TIME BOX PRO v2.0 개요 TIME BOX PRO v2.0 et MetaTrader 5 sont également disponibles en ligne . C'est vrai . Nombre de personnes : ANNÉE, SEMESTRE, TRIMESTRE , MOIS , SEMAINE, JOUR Les valeurs (HB 90 %, 50 %, 10 %) sont définies comme étant les mêmes que celles des autres. 전략 테스터, 모든 핵심 기간을 빠르고 C'est vrai. 주요 기능 멀티 타임프레임 : ANNÉE, SEMESTRE, TRIMESTRE, MOIS, SEMAINE, JOUR ️ 타임프레임별 컬러 박스 로 가격 범위 시각화 사용자 정의 HB 레벨 (90%, 50%, 10%) ️ 동적 레이블 로 기간 표시 (ANNÉE, S1, Q1, M1, SEMAINE,
Marubozu Pro SUP
N'da Lemissa Kouame
Marubozu Pro ELITE X v3.100 – Market Description Overview Marubozu Pro ELITE X is an advanced price action indicator designed to automatically detect optimized Marubozu candlestick patterns combined with a dynamic EMA trend filter . It provides clear BUY / SELL signals along with structured market levels (High, Low, Mid), helping traders make faster and more accurate decisions.  Key Features  1. Automatic Signal Detection BUY signal (blue arrow) when a strong bullish candle with minimal wick is
Tweezer pro
N'da Lemissa Kouame
TWEEZER PRO SUP v4.0 Advanced Price Action Reversal Indicator DESCRIPTION TWEEZER PRO SUP v4.0 is a next-generation professional trading indicator designed to accurately detect strong market reversals using powerful Tweezer Bottom and Tweezer Top patterns. It combines advanced price action + smart EMA trend filter + dynamic market structure zones , delivering clear, reliable, and ready-to-use trading signals. WHY CHOOSE TWEEZER PRO SUP? Automatic reversal detection Reduced false signal
Marubozu Multi Engulfing PRO Professional Trading Indicator for MetaTrader 5 Overview Marubozu Multi Engulfing PRO is a powerful price action indicator designed for traders who want high-probability entries with precision and clarity . It combines two of the most reliable candlestick patterns: Marubozu candles Multiple Engulfing patterns Enhanced with a trend filter (EMA) and dynamic market levels , this indicator helps you identify strong momentum moves and institutional activity in real-ti
필터:
리뷰 없음
리뷰 답변