Monthly Levels et Pin Bar Pro
- 지표
- 버전: 1.0
- 활성화: 5

Monthly Levels + Pin Bar Pro (MQL5) – 간단 설명
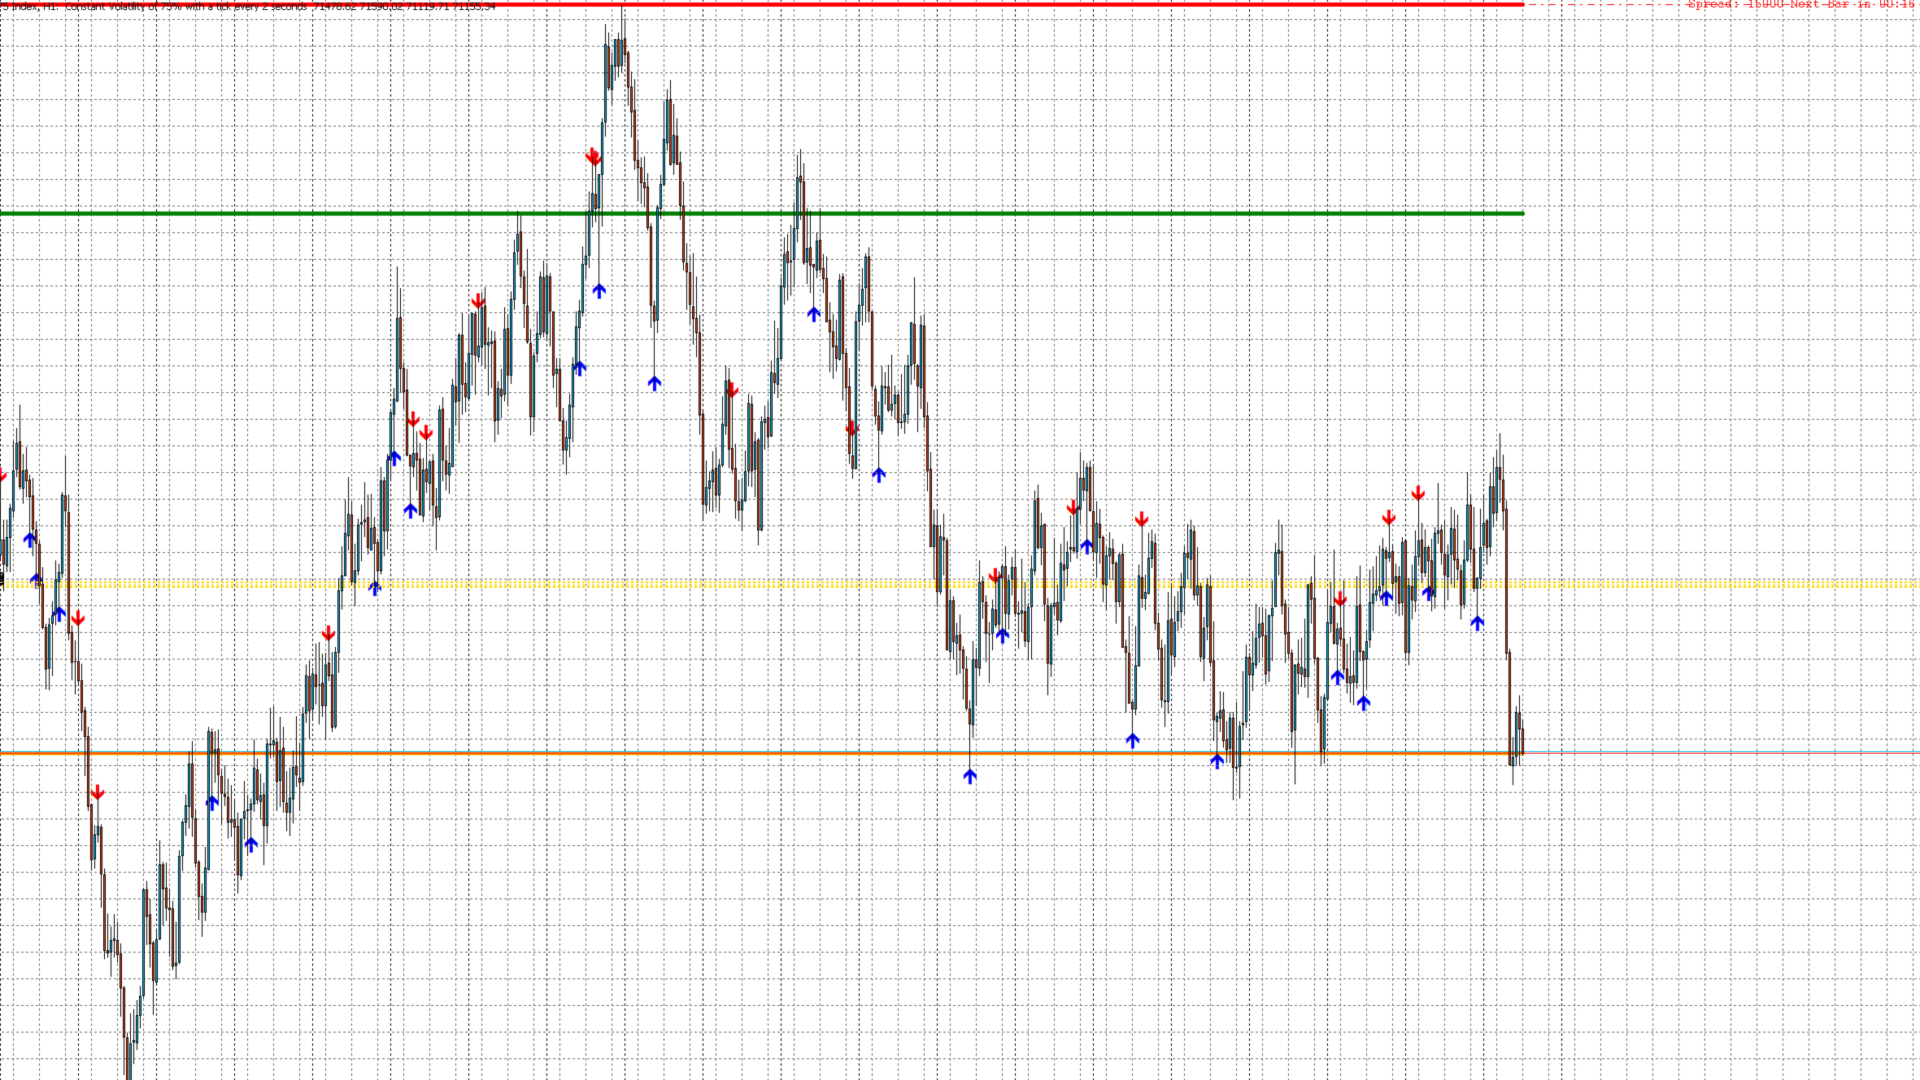
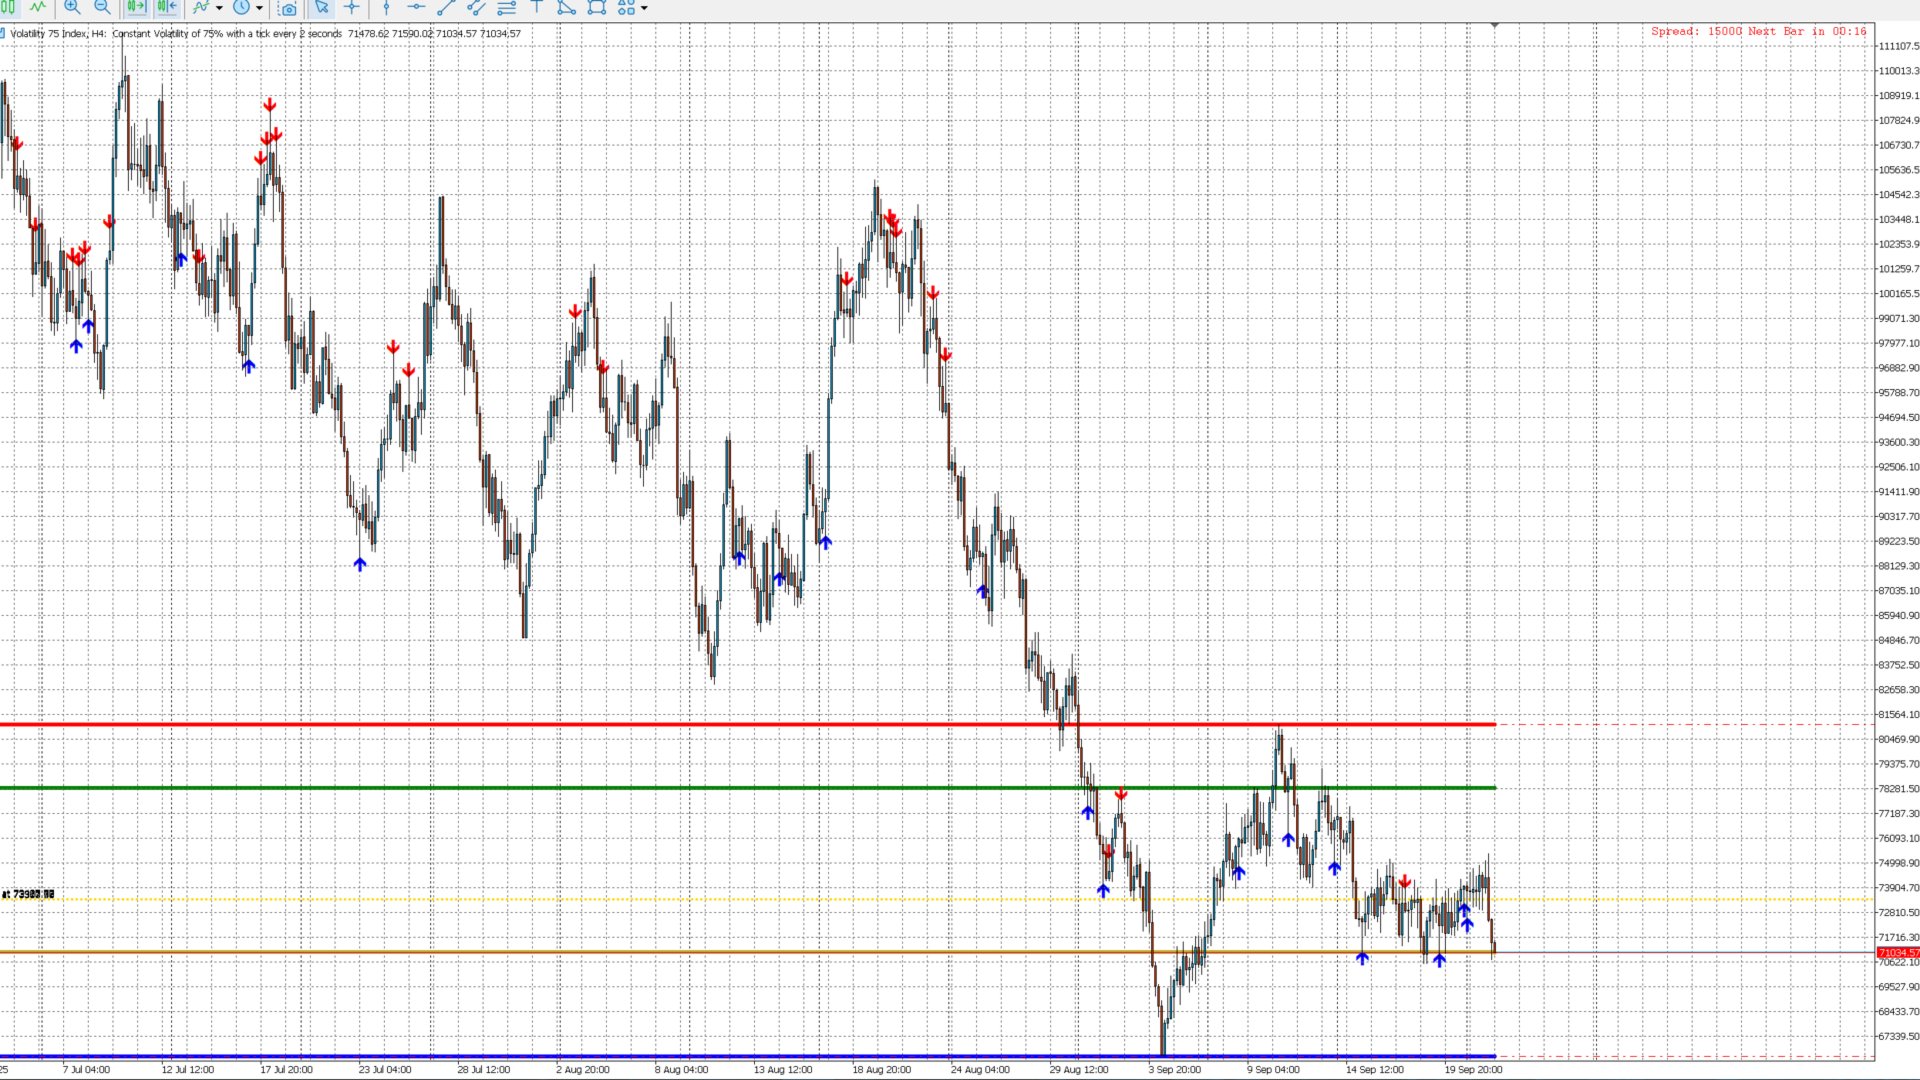
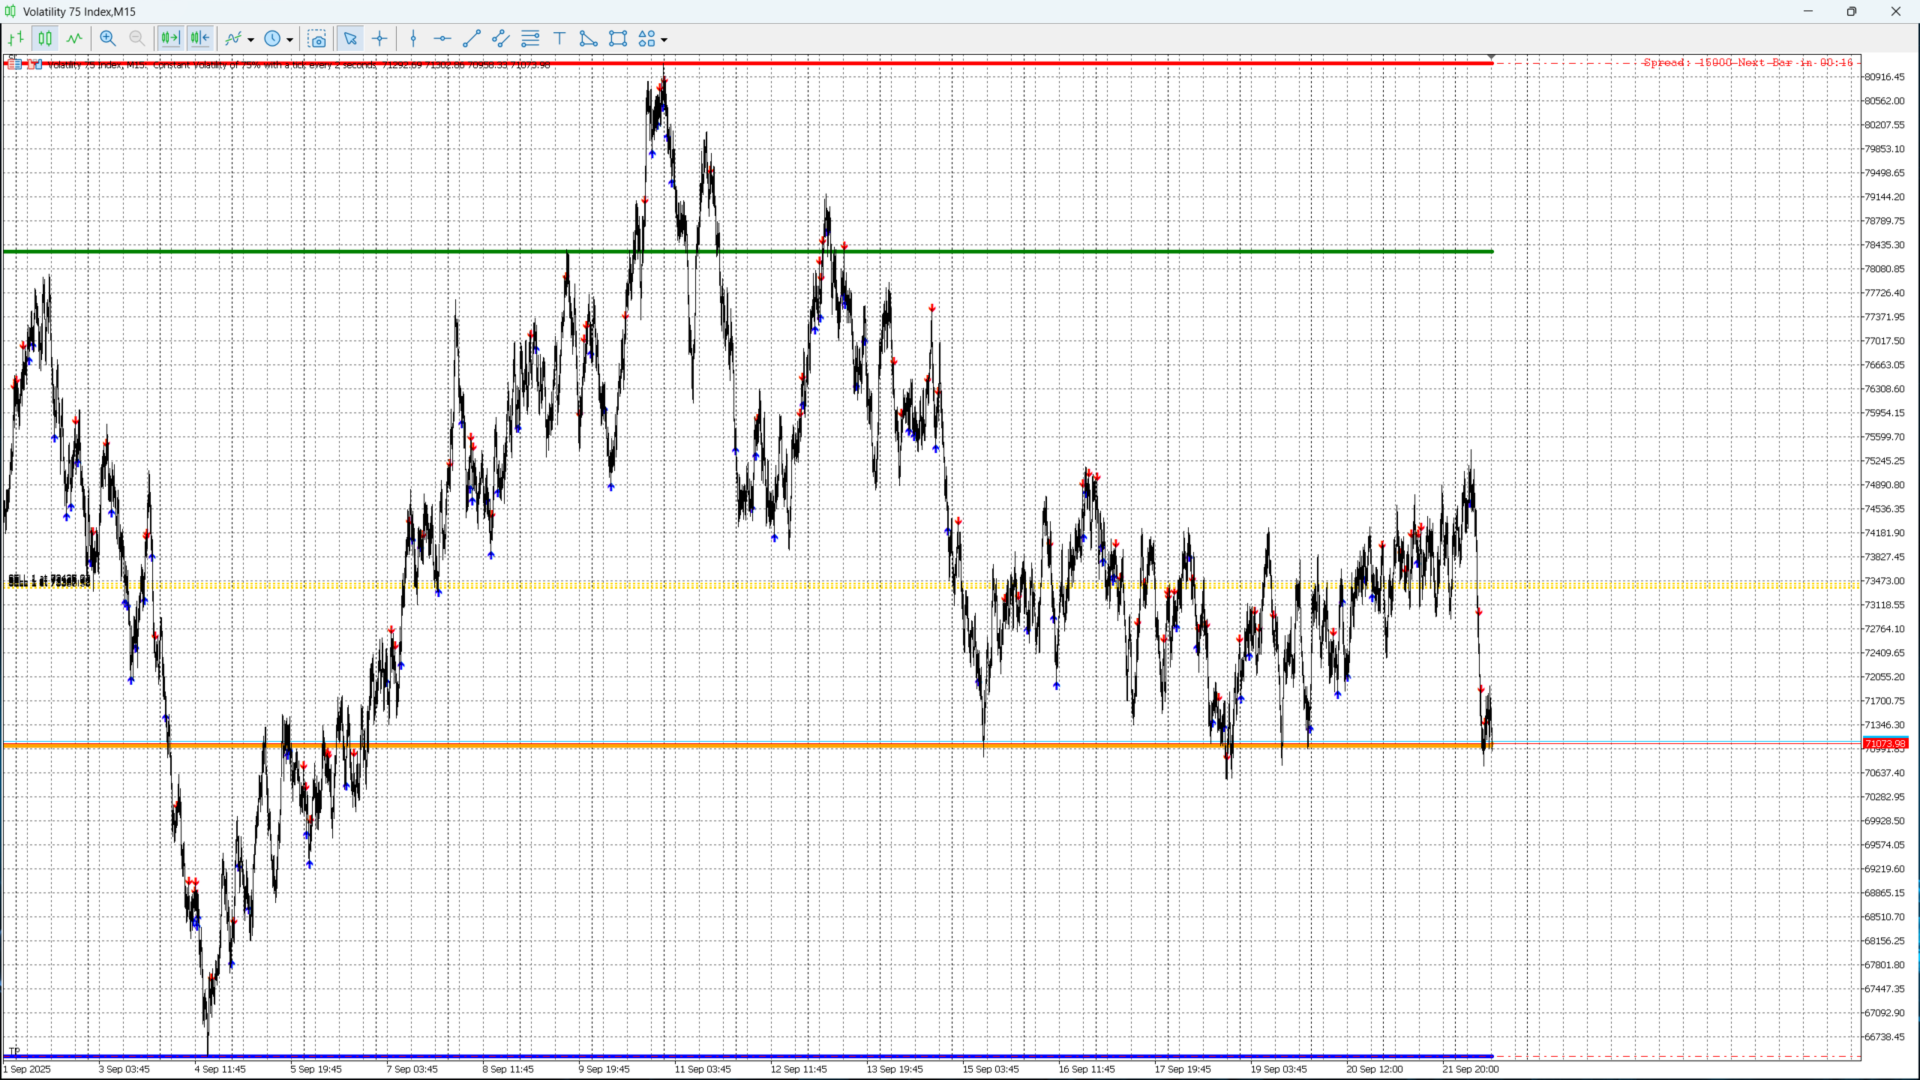
Monthly Levels + Pin Bar Pro는 MetaTrader 5용 경량 지표로, **월간 주요 가격 레벨 (High, Low, Open, Close)**과 핀 바(Pin Bar) 자동 감지 기능을 결합한 도구입니다.
이 인디케이터는 차트에서 다음과 같이 잠재적인 반전 구간을 시각적으로 표시합니다:
- 월간 레벨을 나타내는 수평선
- 파란 화살표: 상승 Pin Bar (지지)
- 빨간 화살표: 하락 Pin Bar (저항)
주요 기능
- 자동 월간 레벨 표시 (MN1)
- 실시간 Pin Bar 감지
- BUY / SELL 시각 신호
- 낮은 CPU 사용량
- 사용자 설정 가능
- EA (자동매매) 호환
사용 방법
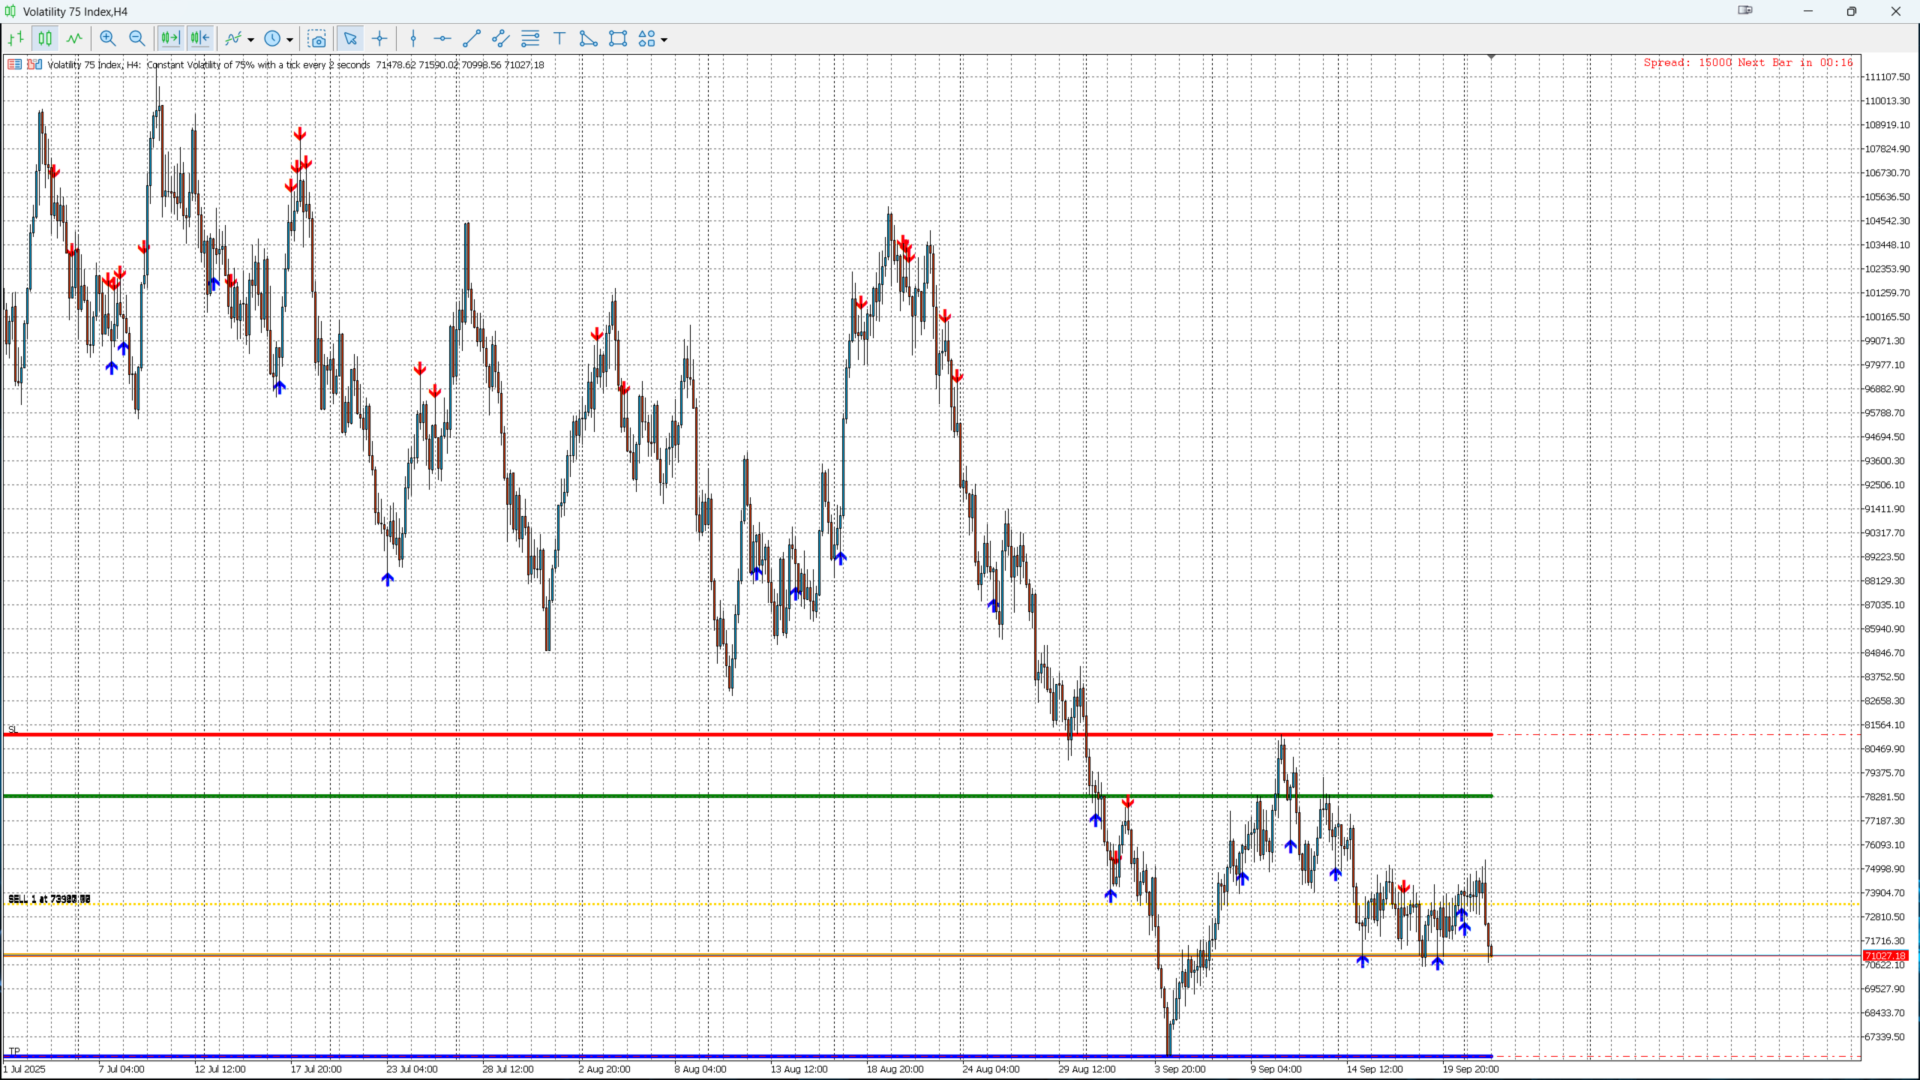
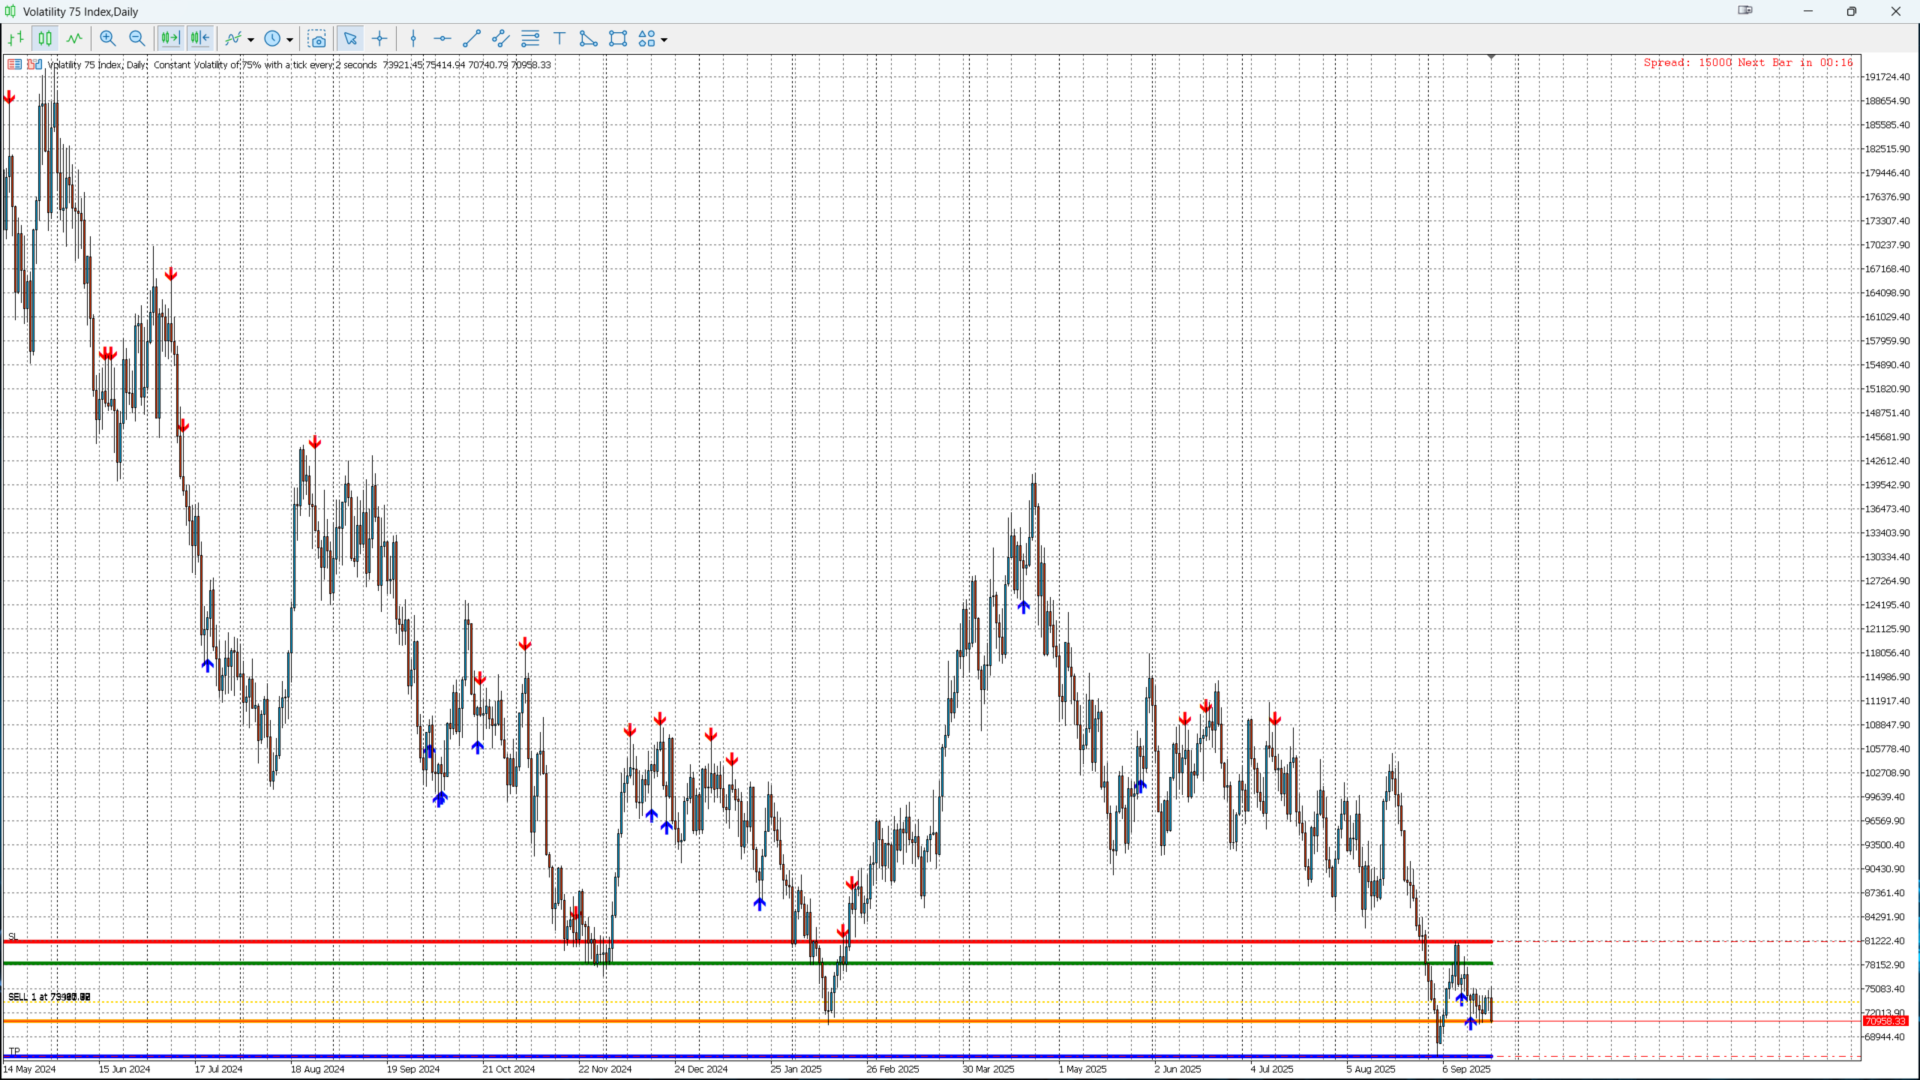
- 매수: 월간 저점 근처의 파란 화살표
- 매도: 월간 고점 근처의 빨간 화살표
- 추세 분석과 함께 사용하면 정확도 향상
기관 레벨과 Price Action을 기반으로 고확률 반전 구간을 찾는 간단하고 효율적인 도구입니다.
Monthly Levels + Pin Bar Pro (MQL5) – 간단 설명
Monthly Levels + Pin Bar Pro는 MetaTrader 5용 경량 지표로, **월간 주요 가격 레벨 (High, Low, Open, Close)**과 핀 바(Pin Bar) 자동 감지 기능을 결합한 도구입니다.
이 인디케이터는 차트에서 다음과 같이 잠재적인 반전 구간을 시각적으로 표시합니다:
- 월간 레벨을 나타내는 수평선
- 파란 화살표: 상승 Pin Bar (지지)
- 빨간 화살표: 하락 Pin Bar (저항)
주요 기능
- 자동 월간 레벨 표시 (MN1)
- 실시간 Pin Bar 감지
- BUY / SELL 시각 신호
- 낮은 CPU 사용량
- 사용자 설정 가능
- EA (자동매매) 호환
사용 방법
- 매수: 월간 저점 근처의 파란 화살표
- 매도: 월간 고점 근처의 빨간 화살표
- 추세 분석과 함께 사용하면 정확도 향상
기관 레벨과 Price Action을 기반으로 고확률 반전 구간을 찾는 간단하고 효율적인 도구입니다.
추천 제품
Fx Levels Premium Indicator Support and Resistance are important concepts in trading. Fx Levels Premium was created to easily draw important levels of support and resistance for the active trader.
The indicator will give you all important levels (support/resistance) to watch for a wide range of assets.
Trading without these levels on your chart is like driving a car for a long journey without a roadmap. You would be confused and blind.
Support and resistance levels should be used as guideline
시각적 추세 화살표, 유효 피벗 마커, 선택 가능한 구조 영역을 제공하는 깔끔한 MT5 시장 구조 기반 추세 감지 지표입니다. STS Structure Trend Detector는 가격 구조를 기반으로 시장 추세 방향을 감지하기 위한 깔끔한 MetaTrader 5 지표입니다. STS Structure Trend Detector는 현재 시장 구조를 차트에서 직접 확인하고 싶은 트레이더를 위해 설계되었습니다. 이 지표는 유효한 고점과 저점을 분석하고, 구조적인 추세 변화를 감지하며, 명확한 화살표, 피벗 마커, 선택 가능한 구조 구역으로 결과를 표시합니다. 이것은 Expert Advisor가 아니며, 거래를 열거나 닫거나 관리하지 않습니다. 이 지표는 시각적인 시장 구조 분석 지표일 뿐입니다. 재량 거래, 수동 분석 또는 트레이더 개인 전략의 추가 확인 도구로 사용할 수 있습니다. 주요 기능 시장 구조 기반 추세 감지 상승 추세와 하락 추세를 나타내는 시각적 화살표 차트 위의 유효 고점
POC + TMA SCALPER GOLD - Expert Advisor Professional
DESCRIPTION: Automated trading system designed specifically for XAU/USD, combining Point of Control (POC) with Triangular Moving Average (TMA) to identify high-volume and trending zones. It uses advanced risk management with dynamic trailing stops and an intelligent grid system.
TECHNICA
Fibonacci retracement is a method of technical analysis for determining support and resistance levels. The TSO Fibonacci Chains Indicator is different from a simple Fibonacci Retracements indicator in that it provides the targets for each retracement level. In other words, there is an Extension Level (D) for every Retracement Level (C). In addition, if an Extension Level is reached, then a new Fibonacci setup is created automatically. These consecutive Fibonacci setups create a chain that reveal
Are you ready to take your trading journey to new heights? Look no further than MarketMagnet, this groundbreaking indicator designed to propel your trading success with excitement and accuracy. Powered by the convergence of Momentum and CCI (Commodity Channel Index), MarketMagnet equips traders with the ultimate tool to determine direction and entry prices for a wide range of recommended currency pairs and instruments. It is designed for traders seeking to scalp for a few pips on lower timeframe
Solidus Signal — Premium Multi-Factor Trend & Momentum Indicator for MT5 Solidus Signal is a professional-grade, non-repainting signal indicator built for traders who are done guessing and ready to trade with a system. Named after the solidus — the gold coin that anchored empires for centuries — this tool is engineered to bring the same discipline and reliability to your charts: solid signals, built on solid logic, with nothing hidden and nothing repainted. Why Solidus Signal is different Most s
Crystal Ball – Trend-Backed Mean Reversion EA for MT5 Crystal Ball is not just another trading robot—it's a precision engine designed to capture the market’s natural rhythm. By combining the pullback-catching power of Mean Reversion with the momentum-following logic of Trend Trading , Crystal Ball enters trades with intention and exits with purpose. It’s built to avoid random noise, capitalize on structure, and adapt as the market moves. How It Works Wait for Deviation:
Crystal Ball wat
This expert is based on patterns
The main patterns of this specialist are candlestick patterns
Detects trends with candlestick patterns
It has a profit limit and a loss limit, so it has a low risk
The best time frame to use this expert is M30 time frame
The best currency pairs to use with this expert is the EURUSD, GBPUSD, AUDUSD, USDCAD currency pairs
Attributes: Can be used in the EURUSD, GBPUSD, AUDUSD, USDCAD currency pairs Can be used in M30, H1, H4 time frames Has profit limit and loss
Gold EA: Proven Power for 1-Minute Gold Trading Transform your trading with our Gold EA, meticulously crafted for 1-minute charts and delivering over 2000% growth in 5 years from just $100-$1000 . No Martingale, No AI Gimmicks : Pure, time-tested strategies with robust money management, stop loss, and take profit for reliable performance across multiple charts. Flexible Trading Modes : Choose Fixed Balance for safe profits, Mark IV for bold growth, or %Balance for high rewards—combine Mark IV an
Overview The Market Perspective Structure Indicator is a comprehensive MetaTrader indicator designed to provide traders with a detailed analysis of market structure across multiple timeframes. It identifies and visualizes key price action elements, including swing highs and lows, Break of Structure (BOS), Change of Character (CHOCH), internal structures, equal highs/lows, premium/discount levels, previous levels from higher timeframes, and trading session zones. With extensive customization opt
Gold Trader Pro is an advanced analytical tool specifically engineered for professional trading on XAUUSD (Gold). It provides an immediate comprehensive overview of market structure across 7 different timeframes, allowing traders to identify flow direction and signal strength through a modern, draggable, and interactive interface.
Key Features
Multi-Timeframe Analysis: Real-time monitoring of M1, M5, M15, M30, H1, H4, and D1.
Two Operational Modes: MODE_SCALPING: Optimized for fast-paced analys
FREE
GannTools Indicator
The GannTools Indicator is a powerful trading tool inspired by W.D. Gann's strategies. This indicator provides traders with dynamic support and resistance levels, trend analysis, and key price patterns using Gann angles and cycles. Key Features: Customizable Gann Fans, Angles, and Cycles for precise market analysis. Automatic identification of key price levels and trend directions. Works on all timeframes and instruments for flexible trading strategies. Integrated visualiza
CDS Fractal Blade Session - AIO A precision-engineered, all-in-one custom dynamic system designed to identify and exploit high-probability breakouts during key market trading sessions. The CDS Fractal Blade Session is moves beyond simple session boxes, integrating a sophisticated multi-layered approach to define the most critical price levels with surgical accuracy. This premium indicator serves as the core engine for the CDS Asian Fakeout EA and other automated systems developed b
MSnR Lines 는 차트에 서포트 및 저항 수준을 표시하기 위한 사용자 정의 지표입니다. 이러한 수준은 말레이시아 서포트 및 저항 이론에 기반하여 영역이 아닌 선 차트의 피크와 밸리에서 유도된 특정 가격 수준으로 정의됩니다. 특징: A-Level, V-Level 및 갭 레벨의 세 가지 유형의 수준. 수준에 대한 신선도 표시: 신선한 수준은 신선하지 않은 수준보다 중요합니다. 신선한 및 신선하지 않은 수준을위한 사용자 정의 가능한 색상 및 스타일. 신선한 수준 또는 모든 수준만 표시하는 옵션. 조정 가능한 회고 기간 및 현재 가격 위 아래의 수준 수. 다중 시간 프레임 지원. 사용 방법:
트레이더는 거래 결정을 위해 잠재적인 지원 및 저항 수준을 식별하기 위해 MSnR Lines를 사용할 수 있습니다. 신선한 수준은 보다 중요하며 더 나은 거래 기회를 제공할 수 있습니다.
# RSI Pro Alert - Advanced RSI Indicator
A powerful professional-grade RSI indicator with intelligent alerts, scheduled snapshots, and multi-dimensional notifications to help you capture market opportunities with precision!
---
## Key Features
### Smart Signal Detection - **Precision Cross Detection** : Automatically identifies critical moments when RSI crosses overbought/oversold levels - **State Tracking Mechanism** : Real-time monitoring of market state changes (Overbought/Overso
Somewhere over the rainbow It is a system that tries to operate the market from the exhaustion of the trend with a correction algorithm that tries to cut losses at the cost of increasing the margin
This system makes all the adjustments automatically, analyzing the pair and the market to decide which is the most efficient step to reach your destination. Somewhere over the rainbow is a multiple trade and multi lot system(The maximum batch can be up to 5 times the initial batch distributed in mult
CosmiCLab SMC FIBO CosmiCLab SMC FIBO is a professional trading indicator designed for traders who use Smart Money Concepts (SMC), market structure analysis and Fibonacci retracement levels. The indicator automatically detects market swings and builds Fibonacci levels based on the latest impulse movement.
It also identifies market structure changes such as BOS (Break of Structure) and CHOCH (Change of Character), helping traders understand the current market direction. CosmiCLab SMC FIBO also pr
RBreaker Gold Indicators는 금 선물을 위한 단기 데이 트레이딩 전략으로, 추세 추종과 데이 내 반전의 두 가지 거래 방식을 결합합니다. 추세 장에서 수익을 포착할 수 있을 뿐만 아니라, 시장이 반전될 때 적시에 이익을 확정하고 추세에 맞춰 반대 포지션을 잡을 수 있습니다.
이 전략은 미국 잡지 Futures Truth에서 15년 연속으로 가장 수익성 높은 트레이딩 전략 상위 10위 안에 선정되었습니다. 긴 라이프사이클을 자랑하며, 현재까지 국내외에서 널리 사용되고 연구되고 있습니다.
본 지표는 2026년 금 선물의 움직임을 반영하여 14일 ATR 지표를 기반으로 돌파 계수 A, 관찰 계수 B, 반전 계수 R을 보다 합리적인 값으로 정의했습니다. 매우 훌륭한 지표이며, 안정적인 연간 수익성을 달성했습니다. 강력히 추천합니다~
위 지표는 변동성이 높은 상품에 적합하며, 매개변수는 금 선물, 주가 지수 선물 등에 적합합니다. 다른 상품이 필요한 경우 돌파 계수 A
지표에 대하여 이 지표는 금융 상품의 종가에 대한 몬테카를로 시뮬레이션을 기반으로 합니다. 몬테카를로는 통계적 기법으로, 이전에 관찰된 결과에 기반한 랜덤 숫자를 사용하여 다양한 결과가 나올 확률을 모델링하는 데 사용됩니다.
어떻게 작동하나요? 이 지표는 과거 데이터를 바탕으로 시간에 따른 랜덤 가격 변화를 모델링하여 특정 종목에 대한 여러 가격 시나리오를 생성합니다. 각 시뮬레이션은 종가 변동을 반영하기 위해 랜덤 변수를 사용하여, 주어진 기간 동안 미래 시장 움직임을 효과적으로 모방합니다.
몬테카를로 시뮬레이션의 장점 - 몬테카를로 시뮬레이션은 다양한 미래 시나리오에 대한 테스트를 통해 여러 거래 전략의 리스크를 분석하는 데 도움을 줍니다. - 희귀한 극단적 사건(꼬리 위험)을 포함하여 다양한 시장 상황에서 전략의 성과를 확인할 수 있습니다. - 단일 예측에 의존하지 않고, 몬테카를로는 관련 확률과 함께 잠재적 결과의 범위를 제공합니다. 이는 수익 또는 손실 가능성을 이해하는
TL Method — Automatic Trendline Detection & Strength Indicator Tired of drawing trendlines manually? TL Method does it for you — automatically detecting, drawing, and scoring trendlines in real time. What it does: Scans up to 1000 bars to find valid support and resistance trendlines Scores each trendline by counting confirmed anchor touches Generates buy/sell signal arrows when price approaches strong trendlines Alerts you via popup, push notification, or sound — with smart cooldown to avoid spa
SMC OrderFlow Indicator v1.79 Pro Let’s be upfront: no single indicator can guarantee profitability on its own. Trading results depend on the trader's judgment, risk management, market conditions, and execution discipline.
The SMC OrderFlow Indicator v1.79 Pro is neither an "automated money-making" tool nor a simple signal system that merely displays arrows. Instead, it is designed to help traders gain a clearer understanding of market structure, order flow zones, and the relationships between
LT Support Resistance - 지지와 저항을 100% 자동으로 식별 수동으로 지지와 저항선을 그리느라 귀중한 시간을 낭비하는 데 지치셨나요? 아니면 매번 중요한 레벨을 놓쳐서 답답하셨나요? LT Support Resistance는 이러한 번거로운 작업을 없애기 위해 개발되었습니다. 여러 타임프레임(시간족)을 동시에 분석하여, 거래 중인 자산의 가장 중요한 구역을 자동으로 식별하고 차트에 표시해 줍니다. == 중요 레벨의 스마트 자동화 == 주관적이고 시간이 오래 걸리는 수동 라인 작도 대신, 본 지표는 과거 가격 데이터를 분석하여 유의미한 반전 포인트를 식별하고, 가격이 '실제'로 신뢰하고 반응하는 지지 및 저항선을 그려줍니다. 그 결과 데이터에 기반한 객관적이고 신속한 분석이 가능해집니다. == 주요 특징 == 100% 자동 감지: 수동 분석 없이도 지지/저항 레벨 식별 멀티 타임프레임(MTF): M5 차트에서 H1, H4, D1, W1 레벨을 동시에 시각화 스마트 알
Zone Structure Scanner Panel for MT5 Find better setups faster — without scanning charts for hours.
The Zone Structure Scanner Panel for MT5 helps you automatically scan multiple symbols, detect key weekly and daily support/resistance zones, read market structure, highlight confluence, and flag H4 rejection-confirmed setups from one powerful panel.
Instead of jumping from chart to chart, you get ranked opportunities in one place so you can focus on the setups that matter most.
Why it stands
[iVISTscalp5]: 시간을 통한 시장 행동 연구소
TLV Framework | Liquidity Activation Points
⸻
개요
iVISTscalp5는 VISTmany 프로젝트 내에서 개발된 다중 레벨 타이밍 및 가격 구조 인디케이터입니다.
이 시스템은 Liquidity Activation Points(타이밍)를 통해:
움직임이 발생하는 시간
방향
가격 움직임의 범위
를 예측합니다.
iVISTscalp5 인디케이터는 기본 설정만으로도 모든 금융상품에 사용할 수 있습니다.
⸻
실질적 가치
iVISTscalp5는 일반적인 기술적 지표로 만들어진 것이 아닙니다.
개발의 핵심 아이디어는 다음과 같습니다.
누구나 시간을 통해 시장 행동을 연구할 수 있도록 하는 것.
⸻
Time Language VISTmany (TLV) — 프로젝트의 핵심 개념
t(p)
t(p)는 타이밍이 활성화되는 가격 레벨입니다.
⸻
p(p)
p(
Support & Resistance indicator is a modification of the standard Bill Williams' Fractals indicator. The indicator works on any timeframes. It displays support and resistance levels on the chart and allows setting stop loss and take profit levels (you can check the exact value by putting the mouse cursor over the level). Blue dashed lines are support level. Red dashed lines are resistance levels. If you want, you can change the style and color of these lines. If the price approaches a support lev
MQL5용 계절 분해 지표 는 트레이더가 금융 시계열 데이터 내에서 기본 추세 및 계절적 패턴을 식별하고 분석하는 데 도움이 되도록 설계된 강력한 도구입니다. 가격 움직임을 핵심 구성 요소로 분해함으로써 이 지표는 시장 역학에 대한 더 명확한 그림을 제공하여 더 현명한 거래 결정을 내릴 수 있도록 합니다. 주요 기능: 추세선: 단기 변동을 완화하면서 시장의 장기적인 방향을 명확하게 시각화합니다. 계절선: 일별, 주별 또는 월별 주기와 같이 정기적인 간격으로 발생하는 반복적인 패턴을 강조합니다. 사용자 정의 가능한 기간: 사용자는 특정 상품 및 거래 전략에 맞게 분해를 조정하기 위해 추세 기간 과 계절 기간 을 모두 정의할 수 있습니다. 이 유연성을 통해 다양한 시간대와 시장 행동에 걸쳐 분석할 수 있습니다. 향상된 시장 통찰력: 예측 가능한 계절적 영향을 기본 추세 움직임과 분리하여 가격 행동에 대한 더 깊은 이해를 얻을 수 있습니다. 이 지표는 기술 분석을 개선하고 순환 패턴을 거
Market Trend Indicator Analog
저작권 2025, Jose María Molina Sánchez
molinatrader67@gmail.com | 버전 1.00 소개 Market Trend Indicator Analog 는 시장의 트렌드 강도와 방향을 실시간으로 측정하도록 설계된 고급 지표입니다. 전통적인 오실레이터와 달리 이 지표는 시장 상황에 동적으로 반응하는 적응형 필터링 시스템을 사용하여 -100에서 +100 사이의 정확한 아날로그 표현을 제공합니다. 이 설계는 트레이더가 트렌드의 시작과 끝뿐만 아니라 그 강도까지 식별할 수 있도록 하여 더 정보 기반의 결정을 내리고 과도하거나 지연된 진입을 피할 수 있도록 도와줍니다. 지표 작동 방식 이 지표는 가격 변동성에 민감한 연속 신호를 생성하기 위해 여러 분석 기법을 결합한 독자적인 알고리즘을 기반으로 합니다. 결과는 세 가지 방식으로 표시됩니다: 별도 창에서: -100(최대 약세 강도)
RAD CRITICAL LEVES RAD indicator tracks “Relevant Volume” in real time, identifying accumulation and distribution processes, projecting them in the chart as SUPPORT or RESISTANCE zones. Natural support and resistance levels are generated by Volume Accumulation and Distribution processes. As these processes evolve, levels at which the relevant volume in the market place is positioned, become difficult areas to cross upwards or downwards. By using this information, traders can identify very s
멀티 타임프레임 지원, 맞춤형 시각 신호 및 구성 가능한 알림 시스템을 갖춘 Balance of Power(BOP) 지표.
프리랜서 프로그래밍 서비스, 업데이트 및 기타 TrueTL 제품은 제 MQL5 프로필 에서 이용하실 수 있습니다.
피드백과 리뷰를 대환영합니다!
BOP란 무엇인가요? Balance of Power(BOP)는 가격 변화를 바의 범위와 비교하여 매수자 대 매도자의 강도를 측정하는 오실레이터입니다. 지표는 (종가 - 시가) / (고가 - 저가)로 계산된 후 단순 이동 평균(SMA)으로 평활화됩니다. BOP 값은 -1과 +1 사이에서 변동합니다. 양수 값은 매수자가 더 강함을 나타내고(종가가 시가보다 높음), 음수 값은 매도자가 더 강함을 나타냅니다(종가가 시가보다 낮음). 값의 크기는 움직임의 강도를 나타냅니다. BOP는 매수 압력과 매도 압력 사이의 균형을 보여줌으로써 시장 강도와 잠재적인 반전을 식별하는 데 도움이 됩니다. 특징: 화살표 및 수직선을 이용한
FREE
이 제품의 구매자들이 또한 구매함
UZFX {SSS} 스캘핑 스마트 시그널 v4.0 MT5는 급변하는 시장에서 정확한 실시간 시그널을 필요로 하는 스캘퍼, 데이 트레이더, 스윙 트레이더를 위해 설계된 리페인팅이 없는 고성능 트레이딩 지표입니다. (UZFX-LABS)에서 개발한 이 지표는 가격 움직임 분석, 추세 확인 및 스마트 필터링을 결합하여 모든 통화 쌍과 시간대에서 높은 확률의 매수 및 매도 신호, 경고 신호, 추세 지속 기회를 생성합니다.
거래에 대한 의구심을 떨쳐버리고, 명확성, 정밀성, 그리고 규율 있는 시장 실행을 원하는 트레이더를 위해 설계된 체계적인 신호 시스템을 따르기 시작하세요. 제 추천* 최적의 시간대: 15분 이상. {H1}이 제가 가장 선호하는 시간대입니다. 그리고 그 결과는 정말 놀라울 정도입니다...!!
주요 기능 업데이트
• 자동 매수 및 매도 신호 감지 • 고급 반전 인식 로직 • 잠재적인 시장 반전 전 조기 경고 신호 • 추세 지속 확인 신호 • 진입, 손절, TP1, TP2,
ARIPoint is a powerful trading companion designed to generate high-probability entry signals with dynamic TP/SL/DP levels based on volatility. Built-in performance tracking shows win/loss stats, PP1/PP2 hits, and success rates all updated live. Key Features: Buy/Sell signals with adaptive volatility bands Real-time TP/SL/DP levels based on ATR Built-in MA Filter with optional ATR/StdDev volatility Performance stats panel (Success, Profit/Loss, PP1/PP2) Alerts via popup, sound, push, or email Cu
PrimeScalping is a powerful trading companion designed to generate high-probability entry signals with dynamic TP/SL/DP levels based on volatility. Built-in performance tracking shows win/loss stats, PP1/PP2 hits, and success rates — all updated live.
Key Features: Buy/Sell signals with adaptive volatility bands Real-time TP/SL/DP levels based on ATR Built-in MA Filter with optional ATR/StdDev volatility Performance stats panel (Success, Profit/Loss, PP1/PP2) Alerts via popup, sound, push, or e
이 지표는 시장에서 관심이 나타나는 영역 을 강조 표시한 후, 주문이 누적되는 영역 을 보여줍니다.
이는 **대규모 오더북(호가창)**처럼 작동합니다.
이것은 거대한 자금 을 위한 인디케이터입니다. 성능은 탁월하며,
시장에서 어떤 관심이 있든 반드시 포착할 수 있습니다 . (이것은 완전히 새로 작성되고 자동화된 버전 입니다 – 이제 수동 분석은 필요하지 않습니다.)
**거래 속도(Transaction Speed)**는 새로운 개념의 인디케이터로,
시장에 대규모 주문이 언제, 어디에 쌓이는지를 보여주며 , 그 이점을 분석합니다.
매우 초기 단계에서 트렌드 전환 을 감지할 수 있습니다.
FX 시장에서 흔히 사용하는 "거래량(volume)"은 오해입니다. 실제로는 시간당 가격 변화량 이므로, 올바른 용어는 거래 속도 입니다.
우리가 어떻게 사고하고, 행동하며, 분석하느냐 가 가장 중요합니다.
분석 패러다임의 전환 은 필수적입니다.
이 인디케이터는 외환 시장에서의 볼륨 개념을 논리적으로
시장이 진짜로 무엇을 하고 있는지 보십시오.
세 가지 시장 국면(수축, 확장, 추세)을 눈앞에서 실시간으로 지켜보고, 추세 국면의 초기 단계에서 더 나은 진입을 잡으십시오.
추측을 멈추십시오. 기관과 스마트 머니가 하는 것처럼 시장을 읽기 시작하십시오.
MT5용 Apex Market Structure Pro는 노이즈를 걷어내고 모든 캔들 아래에 있는 진짜 구조를 보여 주는 정밀 스마트 머니 분석 도구입니다. 유동성, 구조 전환, 매집 구간, 추세 편향을 하나의 깔끔하고 전문적인 오버레이에 담았습니다. 후행 지표에 지쳐 명확함으로 매매할 준비가 된 진지한 트레이더를 위해 만들어졌습니다. 중요: 이 지표는 Heikin Ashi(하이킨 아시) 캔들에서 작동하도록 설계되었습니다. 사용 전 차트를 Heikin Ashi로 설정하여 그 잠재력을 온전히 끌어내십시오. 모든 분석은 Heikin Ashi 가격 흐름을 중심으로 설계되었습니다. Apex Market S
SmartScalping is a powerful trading companion designed to generate high-probability entry signals with dynamic TP/SL/DP levels based on volatility. Built-in performance tracking shows win/loss stats, PP1/PP2 hits, and success rates — all updated live.
Key Features: Buy/Sell signals with adaptive volatility bands Real-time TP/SL/DP levels based on ATR Built-in MA Filter with optional ATR/StdDev volatility Performance stats panel (Success, Profit/Loss, PP1/PP2) Alerts via popup, sound, push, or e
ScalpPoint is a powerful trading companion designed to generate high-probability entry signals with dynamic TP/SL/DP levels based on volatility. Built-in performance tracking shows win/loss stats, PP1/PP2 hits, and success rates — all updated live. Key Features: Buy/Sell signals with adaptive volatility bands Real-time TP/SL/DP levels based on ATR Built-in MA Filter with optional ATR/StdDev volatility Performance stats panel (Success, Profit/Loss, PP1/PP2) Alerts via popup, sound, push, or emai
Chronos Fractal Engine is an innovative price projection indicator for MetaTrader 5, designed to transform your technical analysis by intelligently identifying and projecting historical price patterns. Built upon an advanced correlation algorithm and the fractal principles of the market, this powerful tool visualizes potential future price movements, giving you a unique edge in your trading decisions. What is Chronos Fractal Engine? At its core, the Chronos Fractal Engine employs a sophisticat
MasterTrend Indicator for MT5
A powerful trend-following and signal-evaluation tool MasterTrend is a custom MT5 indicator that combines Moving Averages and ATR-based risk/reward logic to generate clear buy/sell signals. It visualizes dynamic SL/TP levels, evaluates past trade outcomes, and displays win/loss statistics in a clean on-chart panel. Key features include: Buy/Sell signals based on MA crossovers ATR-based SL/TP1/TP2/TP3 levels with visual lines and labels Signal outcome tracking wit
MERAVITH SCANNER는 MetaTrader 5용 전문 금융 시장 지표로, 여러 분석 도구를 하나의 통합 시스템으로 결합합니다. 독점적인 거래량 가중 평균 가격(VWAP) 방법론을 사용하여 모든 계산을 자동으로 수행하며, 주관적인 해석을 완전히 배제합니다. 이 지표는 모든 자산 클래스(Forex, 주식, 지수, 상품, 암호화폐)와 M1부터 월간 차트까지 모든 시간 프레임에서 작동합니다. 기본 원리는 “가격은 거래량을 따른다”입니다. MERAVITH는 기관 거래량이 집중되는 위치를 식별하고, 그 집중에서 수학적으로 정확한 가격 수준을 도출합니다. 예측이나 투기를 하지 않으며, 계산만 수행합니다. MERAVITH SCANNER를 사용하면 28개의 주요 Forex 통화쌍을 모든 시간 프레임에서 단 2~3분 만에 스캔할 수 있습니다. 또한 원하는 시장을 스캔할 수도 있으며, 예를 들어 약 100개의 주식을 약 10분 안에 스캔할 수 있습니다. 지표는 소진 레벨, 균형선, 편차, 통계
MasterTrend Indicator for MT5
A powerful trend-following and signal-evaluation tool MasterTrend is a custom MT5 indicator that combines Moving Averages and ATR-based risk/reward logic to generate clear buy/sell signals. It visualizes dynamic SL/TP levels, evaluates past trade outcomes, and displays win/loss statistics in a clean on-chart panel. Key features include: Buy/Sell signals based on MA crossovers ATR-based SL/TP1/TP2/TP3 levels with visual lines and labels Signal outcome tracking wit
마켓 메이커를 위한 도구. Meravith는 다음과 같은 기능을 제공합니다: 모든 타임프레임을 분석하고 현재 유효한 추세를 표시합니다.
강세와 약세 거래량이 동일한 유동성 구간(거래량 균형 구간)을 강조 표시합니다.
서로 다른 타임프레임의 모든 유동성 레벨을 차트에 직접 표시합니다.
텍스트 기반 시장 분석을 생성하여 참고용으로 제공합니다.
현재 추세를 기반으로 목표가, 지지선 및 손절가를 계산합니다.
거래의 위험 대비 보상 비율(Risk/Reward)을 계산합니다.
계좌 잔고에 따라 포지션 크기를 산출하고 잠재 수익을 추정합니다. 시장에 중대한 변화가 발생할 경우 경고도 제공합니다. 지표의 주요 라인: 강세/약세 거래량 소진 라인 — 목표가로 사용됩니다.
시장 추세를 나타내는 라인. 시장이 강세인지 약세인지에 따라 색상이 변경되며 추세 지지선 역할을 합니다. 색상은 주로 시장 심리를 보여줍니다.
거래량 균형선(Eq). Eq(Volume Equilibrium) 라인은 시스템의 핵심입니
OrderFlow Absorption – MT5용 전문 델타 & 흡수 신호 인디케이터 OrderFlow Absorption으로 진정한 오더플로우 분석의 힘을 경험하세요. MetaTrader 5를 위한 궁극의 델타 히스토그램 및 흡수 신호 인디케이터입니다. 가격 움직임의 이면에서 실제로 무슨 일이 일어나는지 알고 싶은 트레이더를 위해 설계된 이 도구는, 시장을 움직이는 숨겨진 매수/매도 압력과 흡수 이벤트를 드러냅니다. 주요 기능 델타 히스토그램 시각화: 매수와 매도 압력을 색상별 히스토그램으로 즉시 확인할 수 있습니다. 흡수 신호 감지: 고급 로직으로 강세 및 약세 흡수 이벤트를 식별하여 반전 신호를 미리 알려줍니다. 차트 마커: 흡수 신호가 차트에 직접 표시되어 시각적으로 쉽게 확인할 수 있습니다. 팝업 알림: 새로운 흡수 신호가 발생하면 실시간으로 알림을 받을 수 있습니다. 사용자 지정 임계값: 약한 신호는 필터링하고, 확률이 높은 기회에 집중할 수 있습니다.
MetaTrader 5용 스마트 다층 브레이크아웃 및 풀백 탐지기 "스마트하고, 간단하고, 빠르게!" 고확률 브레이크아웃 진입을 놓치는 것에 지치셨나요? 여러 차트를 몇 시간씩 스캔하면서 브레이크아웃을 추세 방향과 통화 모멘텀에 맞추려고 하지만 — 결국 움직임을 놓치고 마나요? Break Pullback은 하나의 지표로 이 모든 문제를 해결합니다.
Break Pullback이란 무엇인가요? Break Pullback은 시장 구조, 브레이크아웃, 추세 지속 설정을 거래하는 트레이더를 위해 특별히 설계된 전문가급 MetaTrader 5 지표입니다. 실시간으로 여러 통화 쌍에 걸쳐 Break와 Pullback 형성을 자동으로 감지하고 — 세 가지 확인 레이어를 통해 모든 신호를 필터링합니다: 구조적 브레이크아웃 탐지 — 차트의 주요 브레이크 레벨 식별 HTF 일봉 바이어스 — 진입을 지배적인 일봉 추세 방향에 맞춤 통화 강도 지수 — 쌍을 이룬 통화 간의 모멘텀 불균형 확인 결과: 오
Route Lines Prices MT5 - 는 잠재적인 거래 신호를 찾는 데 사용되는 지표입니다. 간단한 인터페이스에는 다양한 가격 움직임 알고리즘과 신호 종점 감지, 완료된 궤적 계산 기능이 포함되어 있습니다. 알고리즘에는 사용된 시간대에 따라 변동성 및 가격 평활화 계산이 포함됩니다.
이 지표는 " Calculating price values "이라는 기본 매개변수를 통해 값을 변경할 수 있습니다. 기본값인 1은 균형 잡힌 자동 계산 형태를 제공하며,
별도의 설정 없이 바로 사용할 수 있습니다. 2에서 500 사이의 값을 수동으로 변경하여 자신만의 거래 시스템에 맞게 지표를 조정할 수 있습니다.
이 지표에는 빠른 이동평균선과 느린 이동평균선의 교차점으로 표시되는 시장 방향 지표가 내장되어 있으며, 추세를 직접 설정할 때는 이 기능을 비활성화할 수 있습니다.
이 지표는 M1부터 H4까지의 시간대에서 사용을 권장하며, 모든 거래 상품에 적용 가능합니다.
신호 화살표는 캔들 종
" Dynamic Scalper System MT5 " 지표는 추세 파동 내에서 스캘핑 방식으로 거래하도록 설계되었습니다.
주요 통화쌍 및 금에서 테스트되었으며, 다른 거래 상품과의 호환성이 가능합니다.
추가적인 가격 변동 지원을 통해 추세에 따라 단기 포지션 진입 신호를 제공합니다.
지표의 원리
큰 화살표는 추세 방향을 결정합니다.
작은 화살표 형태의 스캘핑 신호를 생성하는 알고리즘은 추세 파동 내에서 작동합니다.
빨간색 화살표는 상승 방향을, 파란색 화살표는 하락 방향을 나타냅니다.
민감한 가격 변동선은 추세 방향으로 그려지며, 작은 화살표의 신호와 함께 작용합니다.
신호는 다음과 같이 작동합니다. 적절한 시점에 선이 나타나면 진입 신호가 형성되고, 선이 있는 동안 미결제 포지션을 유지하며, 완료되면 거래를 종료합니다.
권장되는 작업 시간대는 M1~H4입니다.
화살표는 현재 캔들에 형성되며, 다음 캔들이 이미 시작되었더라도 이전 캔들의 화살표는 다시 그려지지 않습니다.
입
VTrende Pro - MTF indicator for trend trading with a display panel for MT5 *** Videos can be translated into any language using subtitles (video language - Russian)
Although the signals of the VTrende Pro indicator can be used as signals of a full-fledged trading system,
it is recommended to use them in conjunction with the Bill Williams TS.
VTrende Pro is an extended version of the VTrende indicator. Difference between Pro version and VTrende:
- Time zones
- Signal V - signal 1-2 waves
- S
==================================================================== SMC Pro v6.1 APEX AI — XAUUSD Gold Empire MetaTrader 5 지표 · Smart Money Concepts · 예측 인텔리전스 엔진 ====================================================================
SMC Pro v6.1 APEX AI는 MetaTrader 5의 XAUUSD(골드) 전용으로 제작된 전문 Smart Money Concepts 지표 시스템입니다.
완전한 SMC 프레임워크 — Order Blocks, Liquidity sweeps(유동성 스윕), Fair Value Gaps, Break of Structure, Change of Character — 에 AI 기반의 8개 신규 모듈을 결합하여, 정밀한 시각적 신호, 예측 궤적선, 색상으로 구분된 SL/T
ARICoin is a powerful trading companion designed to generate high-probability entry signals with dynamic TP/SL/DP levels based on volatility. Built-in performance tracking shows win/loss stats, PP1/PP2 hits, and success rates all updated live. Key Features: Buy/Sell signals with adaptive volatility bands Real-time TP/SL/DP levels based on ATR Built-in MA Filter with optional ATR/StdDev volatility Performance stats panel (Success, Profit/Loss, PP1/PP2) Alerts via popup, sound, push, or email Cust
Euro Escalper — Peulopesyeoneol Gigugeup Seukael-ping Jipyo Euro Escalper eun mobeun jingib-eseo gigugeub jeongmilseong-eul yoguhaneun teuleideoui goseongneung georae jipyo. Hapseong Jisu (Deriv), Forex mich MetaTrader 5 eseo sayong ganeunghan modeun jasan-e jeogyong. Fibonacci giban yudongseong jiyeog, naejang SuperTrend enjin mich silsigan jeonmun daesiboeleu-leul gyeolhap. Juyo Jangjeom Jaegeurim Eobseum: Signal hwasalpyo-neun bong maegam si-eman natanago jeoldae umjigiji ankeo sarajiji anhs
Premium level is a unique indicator with more than 80% accuracy of correct predictions!
This indicator has been tested for more than two months by the best Trading Specialists!
The author's indicator you will not find anywhere else!
From the screenshots you can see for yourself the accuracy of this tool!
1 is great for trading binary options with an expiration time of 1 candle.
2 works on all currency pairs, stocks, commodities, cryptocurrencies
Instructions:
As soon as the red arrow app
ZIVA Signal Intelligence
An Adaptive, Modular Market Intelligence System ZIVA Signal Intelligence is not positioned as a conventional trading indicator. It is a fully integrated, proprietary market intelligence system engineered to deliver structured, high-precision interpretation of price behavior within a controlled analytical environment. Developed through an independent architectural approach, ZIVA does not rely on, derive from, or replicate existing indicators.
It represents a standalone
TraderHUD v2 — 전문 트레이더를 위한 완벽한 대시보드 TraderHUD v2 는 MetaTrader 5용 가장 완벽한 시각적 지표의 진화 버전입니다. 트레이더가 더 현명한 결정을 내리기 위해 차트에서 봐야 할 모든 것을 하나의 도구에 통합합니다: 시간적 맥락, 달러 강도, 통계적 범위, 피벗 레벨, 움직임 속도, 매크로 트렌드 — 모두 통합되고 설정 가능하며 차트를 어지럽히지 않습니다. 이 버전은 실제 라이브 트레이딩 사용 경험을 바탕으로 제작되었으며, 명확한 철학을 따릅니다: 더 많은 맥락, 더 적은 노이즈 . v2의 새로운 기능 8개 모듈을 단일 지표로 완전 통합 DayRange와 DollarFlow가 자동 연결된 설정 가능한 사이드 패널 정시 표시와 함께 시장 세션 마킹 레벨 간 평균선 옵션이 있는 클래식 피벗 포인트 베타로 표시된 두 개의 실험적 모듈: 변동성 및 매크로 트렌드 평균 완전히 설정 가능한 레이아웃 — 코너, 너비, 색상 및 글꼴 모듈 타이머 및 스
BigPlayerRange – MT5 최고의 지표 BigPlayerRange 는 MetaTrader 5에서 미니 인덱스와 미니 달러를 위한 최고의 지표 로 평가받고 있습니다. 이 도구는 주요 기관 투자자들의 전략적 영역을 강조하여 높은 정확도의 기관 기술 분석을 제공합니다. BigPlayerRange 사용법: 이 지표는 매수 구간(녹색선)과 매도 구간(빨간선)을 표시합니다. 가격이 이 구간 밖에서 마감되면 추세 움직임이 예상됩니다. 녹색선 위에서 마감: 강한 매수세와 상승 추세 가능성. 빨간선 아래에서 마감: 매도 압력과 하락 가능성. 범위 내에서 마감: 횡보 시장, 돌파 신호 대기. 주요 혜택: 기관 투자자 영역 매핑: 주요 투자자들의 활동 구간을 식별합니다. 자동 목표 지점 산출: 거래 종료에 적합한 목표 지점을 제공합니다. 풀백 분석: 리스크 관리를 위한 가격 반등 가능성 평가. 활용 방법: BigPlayerRange와 함께 Imba
[Special Limited Price] Release Commemoration Sale! Currently available at a special price to celebrate its release. The price will revert to normal without notice after a certain period or sales volume. Don't miss this chance to get a pro-level trading environment at the lowest price! Quasar Edge & Dual Dashboard ~ Transform the "chaos" of 28 pairs into "confident profits" with the ultimate MT5 market structure system ~ The reason many traders lose isn't due to indicator performance, but
MATADOR GOLD XAUUSD M5 Scalp Signals for MT5 MATADOR GOLD is a decision-support indicator for MetaTrader 5, designed for traders who analyze short-term Gold movement on the M5 timeframe. The indicator does not open, close, or manage trades automatically. It provides buy and sell signal guidance so the user can make their own trading decisions according to their risk plan, broker conditions, and trade management rules. Main purpose MATADOR GOLD is built to help traders avoid noisy signal flow and
FX Analysis is an all-in-one MT5 indicator dashboard that combines eight analytical tools in a single panel, helping traders identify high-probability setups without switching between charts or indicators. Designed for standard forex pairs on MetaTrader 5. Best results on M15 - H4 timeframes when all components are used together as part of the included workflow.
Components Volatility Analyzer Displays historical average movement by hour and by day of the week. A real-time Pip Balance shows the
First time on MetaTrader, introducing IQ Star Lines - an original Vedic Astrology based indicator. "Millionaires don't use astrology, billionaires do" . - J.P. Morgan, Legendary American financier and banker.
Welcome to the new and updated IQ Star Lines , the ultimate fusion of ancient planetary harmonic cycles and modern quantitative trading. published for the first time on Metatrader. This is an indicator built by the developer, who has spent almost 2 decades trading while studying Vedic
+++++++++++++++++++++++++++++++++++++++++++++++++++++++++++++++++++++++++++++++++++++++++++++++++ +++ Link to EURUSD Only Free Version --> https://www.mql5.com/en/market/product/156904?source=Unknown +++++++++++++++++++++++++++++++++++++++++++++++++++++++++++++++++++++++++++++++++++++++++++++++++ Hallo Trader, This is a traditional GANN & FIBONACCI strategy based on detection of an impulsive move in the opposite direction. This is called a Breakout. At the moment of Breakout, the indicator draw
SunSignal ML — AI Gold Signals with Multi-Timeframe Confluence SunSignal ML is an advanced AI-powered signal indicator purpose-built for XAUUSD gold trading. It combines a proprietary adaptive trend algorithm with six machine learning models trained on confirmed price pivots to produce high-confidence entry signals with multi-timeframe validation. The indicator runs efficiently on M1, M5 and M15 timeframes and is designed for traders who want precision entries guided by data rather than guesswor
제작자의 제품 더 보기
Niveaux mensuels + PinBar + Marubozu + ALERTES (MQL5) Version : 2.0 FINAL
Auteur : KOUAME N'DA LEMISSA See More Description du produit Cet indicateur avancé pour MetaTrader 5 combine l'analyse des niveaux mensuels, la reconnaissance des modèles de chandeliers japonais (PinBar et Marubozu) et un système d'alerte en temps réel. Il aide les traders à identifier rapidement les zones clés du marché et les opportunités de trading à forte probabilité. Caractéristiques principales Affichage automatiqu
Pin Bar Pro v1.0 – MQL5 지표 설명:
Pin Bar Pro는 MetaTrader 5용 전문 지표로, 핀바(Pin Bar) 를 자동 감지하여 시장 반전을 예측합니다. 파란 화살표 → 매수 신호 빨간 화살표 → 매도 신호 특징: Pin Bar 자동 감지 화살표 커스터마이징 ( Arrow_Up_Code , Arrow_Down_Code ) 수직 오프셋 조정 ( Arrow_Offset_Pts ) 모든 심볼과 타임프레임 지원 매개변수: 매개변수 설명 기본값 Arrow_Up_Code 매수 화살표 코드 233 Arrow_Down_Code 매도 화살표 코드 234 Arrow_Offset_Pts 수직 오프셋 (포인트) 10 저자: KOUAME N’DA LEMISSA
버전: 1.0 – MQL5용
Marubozu Pro (MT5) – Description Marubozu Pro is a lightweight MetaTrader 5 indicator that automatically detects bullish and bearish Marubozu candles, highlighting strong market momentum directly on your chart. It displays clear buy/sell arrows: Blue = Buy (bullish Marubozu) Red = Sell (bearish Marubozu) Designed for speed and simplicity, it helps traders quickly identify powerful price action for entries, confirmations, or trend filtering. Key Features: Real-time Marubozu candle detection
Order Block Pro (MQL5) – 버전 1.0 작성자: KOUAME N'DA LEMISSA
플랫폼: MetaTrader 5 설명: Order Block Pro 는 차트에서 **강세 및 약세 오더 블록(Order Blocks)**을 자동으로 감지하는 고급 지표입니다. 횡보 캔들 이후 강한 상승/하락 캔들을 분석하여 가격이 급격히 움직일 가능성이 있는 주요 구간을 표시합니다. 트레이더에게 적합: 정확한 진입 및 청산 지점을 찾고 싶은 경우 동적 지지 및 저항 구간을 파악하고 싶은 경우 리스크 관리 및 거래 전략을 향상시키고 싶은 경우 주요 기능: 강세 OB 감지:
횡보 캔들 후 강한 상승이 발생하면 차트에 녹색 화살표 표시 약세 OB 감지:
횡보 캔들 후 강한 하락이 발생하면 차트에 빨간 화살표 표시 완전한 사용자 정의 가능: 횡보 캔들의 최대 실체 비율 ( BodyMaxRatio ) 다음 캔들의 최소 비율로 움직임 확인 ( NextCandleMinPct ) 차트 화살표
Aperçu – ETE DETECTOR POWER v5.0 (pour plus d'informations) "헤드 앤 숄더" 패턴 자동 감지 ETE DETECTOR POWER v5.0 est maintenant disponible en ligne . 도구입니다. Il s'agit
d'une question de santé et de sécurité . 최적화된 객체 관리 시스템(MaxObjects) 덕분에, 바쁜 차트나 다중 시간 프레임에서도 지표가 C'est vrai. 주요 기능 Nom du produit : H&S(매도) et H&S(매수) 어깨, 머리, 넥라인 명확하게 표시 반전 구간 자동 표시 (빨강=매도, 초록=매수) ACHETER/VENDRE 화살표 로 즉시 기회 표시 순환 객체 풀 로 스마트 관리 완전 사용자 설정 가능: 분석 캔들 수, 최소 거리, 대칭 허용 범위, 최대 패턴 수, 직사각형 스타일, 마커 크기 및 색상 트레이더 장점 시간 절약:
Monthly High & Low Dynamic Range + Liquidity Zones v1.2
Author: KOUAME N'DA LEMISSA Description:
Transform your market analysis with this powerful indicator that combines: Key Monthly Levels: High, Low, Open, and Close to identify the most important support and resistance zones. Dynamic High/Low Range: Automatically tracks extreme price movements to detect significant market shifts. Liquidity Zones: Visual rectangles showing areas where liquidity is concentrated (Buy/Sell). The thickness and c
한국어 (coréen / 한국어) Booster Trading Pro Modèle
: KOUAME N'DA LEMISSA
Modèle : MetaTrader 5
Modèle : 다기능 기술 지표 설명 Booster Trading Pro est également disponible en ligne. Il s'agit d'un sujet d'intérêt général : 월간 주요 레벨: 최고가, 최저가, 시가, 종가로 지지 및 저항 구역을 빠르게 식별. 동적 고저 범위: 월간 레벨 상하에서 가격의 극단적 움직임을 추적. 동적 시가 범위: 월간 시가 기준으로 중요한 가격 수준을 탐지. 자동 유동성 영역: 동적 색상 직사각형으로 잠재적 매수/매도 영역 시각화. 주요 특징 C'est vrai, c'est vrai. Je suis en train de le faire. Il s'agit d'une personne qui s'est occupée de lui. Il s'agit d'
Channel Ultima – Indicateur multicanal dynamique
Auteur : KOUAME N'DA LEMISSA
Plateforme : MetaTrader 5 (MT5) Description: Channel Ultima est un indicateur de structure de marché avancé qui trace automatiquement trois canaux dynamiques multi-temporels.
Il permet une analyse précise de la structure des prix, des zones de support et de résistance, ainsi que des zones d'équilibre, offrant ainsi une vision claire et professionnelle du marché. Cet outil est conçu pour les traders techniques, le
Institutional Liquidity Map Pro is a professional MetaTrader 5 indicator designed to map institutional liquidity zones using monthly highs and lows. It automatically detects stop-hunt areas, potential reversal zones, and institutional accumulation/distribution levels. The indicator dynamically tracks up to three liquidity levels on both buy and sell sides, updated in real time. Key Features: Automatic detection of monthly high/low levels Real-time institutional liquidity zones (buy/sell) Dynamic
SMXZones – Zones de liquidité pour investisseurs avertis Liquidités institutionnelles • Biais de marché • Signaux PinBar Auteur : KOUAME N'DA LEMISSA Investissez comme un investisseur avisé SMXZones est un indicateur de trading puissant conçu pour révéler les zones de liquidité institutionnelle, la structure du marché et la tendance directionnelle du marché . Cet outil aide les traders à voir clairement où les institutions accumulent des liquidités et où les mouvements de prix importants sont su
ICT Smart Pro Argent intelligent – Déséquilibre des TIC – Limites de temps institutionnelles – Structure du marché 설명 ICT Smart Pro propose Smart Money et ICT (Inner Circle Trader) pour votre entreprise . C'est vrai. 이 지표는 여러 기관용 도구를 하나로 통합하여, 대형 금융 기관이 시장에 진입하는 Il s'agit d'une personne qui s'est occupée de lui . ICT Smart Pro est actuellement disponible en ligne : TIC 불균형 영역 (BISI / SIBI)
기관 시간 사이클
월별 주요 가격 수준
시장 구조 영역 Il s'agit d'une personne qui s'est retrouvée dans une situation
Logiciel MQL5 – TIME BOX PRO v2.0 개요 TIME BOX PRO v2.0 et MetaTrader 5 sont également disponibles en ligne . C'est vrai . Nombre de personnes : ANNÉE, SEMESTRE, TRIMESTRE
, MOIS , SEMAINE, JOUR Les valeurs (HB 90 %, 50 %, 10 %) sont définies comme étant les mêmes que celles des autres. 전략 테스터, 모든 핵심 기간을 빠르고 C'est vrai. 주요 기능 멀티 타임프레임 : ANNÉE, SEMESTRE, TRIMESTRE, MOIS, SEMAINE, JOUR 타임프레임별 컬러 박스 로 가격 범위 시각화 사용자 정의 HB 레벨 (90%, 50%, 10%) 동적 레이블 로 기간 표시 (ANNÉE, S1, Q1, M1, SEMAINE, JOUR) CPU et p
Marubozu Pro ELITE X v3.100 – Market Description Overview Marubozu Pro ELITE X is an advanced price action indicator designed to automatically detect optimized Marubozu candlestick patterns combined with a dynamic EMA trend filter . It provides clear BUY / SELL signals along with structured market levels (High, Low, Mid), helping traders make faster and more accurate decisions. Key Features 1. Automatic Signal Detection BUY signal (blue arrow) when a strong bullish candle with minimal wick is
TWEEZER PRO SUP v4.0 – Price Action Reversal Indicator Author: KOUAME N’DA LEMISSA
Platform: MetaTrader 5 Description TWEEZER PRO SUP v4.0 is a professional next-generation trading indicator designed to accurately detect strong market reversals using the powerful Tweezer Top and Tweezer Bottom candlestick patterns. It combines advanced price action analysis, an intelligent EMA trend filter, and dynamic market structure zones, delivering clear, reliable, and trade-ready signals for all types of t
STRUCTURE DU MART SR ULTIMA Structure ultime du marché et indicateur intelligent de support/résistance SMART STRUCTURE SR ULTIMA est une solution de trading avancée conçue pour fournir une lecture claire, précise et professionnelle de la structure du marché. Conçu pour les traders modernes, cet indicateur combine une structure intelligente (DER/DES) , des niveaux de support et de résistance dynamiques et un système unique de Structure Fan qui visualise la force du marché, son expansion et ses z
INTERACTIVE RISK BOX EA MT5 – MANUEL UNIQUEMENT 설명 BOÎTE DE RISQUE INTERACTIVE EA – MANUEL UNIQUEMENT pour MetaTrader 5 et Expert Advisor (EA), 100 % pour tous les utilisateurs C'est vrai. 이 버전은 자동 매매 없이 트레이더가 모든 진입을 완전히 직접 통제 할 수 있도록 Il s'agit d'une personne qui s'est occupée de lui. 레벨을 직접 설정 하고, 그에 Entrée, Stop Loss, Take Profit Il s'agit d'une personne qui s'est occupée de lui. 주요 기능 100 % d'amour 자동 매매 없음 모든 포지션 완전 수동 관리 인터랙티브 라인 ENTRÉE (진입 가격) STOP LOSS (손절SL) PRENDRE DES PROFITS (TP) 동적
MASTER DYNAMICS CHANNEL PRO MASTER DYNAMICS CHANNEL PRO is a professional multi-timeframe channel indicator that automatically displays Weekly, Monthly, Quarterly, and Yearly trend channels on a single chart. Designed for institutional market structure analysis, it helps traders identify major support and resistance zones, trend direction, breakout opportunities, and long-term market cycles . Lightweight, non-repainting , and fully customizable, it is suitable for Forex, Gold, Indices, Stocks, C
Monthly Open Liquidity Tracker Description Monthly Open Liquidity Tracker is a professional MetaTrader 5 indicator designed to monitor Monthly Open levels and automatically detect Liquidity Sweeps occurring around these key institutional price zones. The indicator displays the most recent Monthly Open and Monthly Close levels, calculates the distance between them in points, and highlights areas where market liquidity has been captured before a directional move. Features Display of Monthly O