PW Oscillator
- 지표
- 버전: 1.0
- 활성화: 5

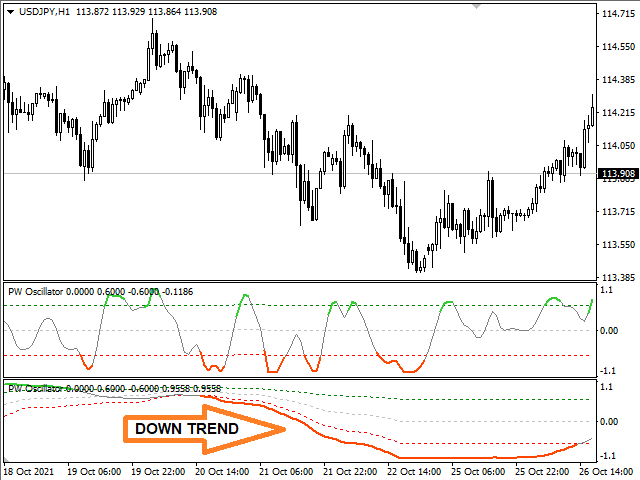
PW Oscillator - индикатор предназначенный для поиска локальных экстремумов, определения текущей тенденции. В расчетах индикатора используется авторская методика.
С помощью индикатора можно определять места возможного разворота цены желательно в направлении тенденции, но также с достаточной точностью и против нее. Также с помощью индикатора можно определять текущую тенденцию. Индикатор подходит для любых валютных пар, но для адекватного отображения показания необходимо, чтобы было достаточно исторических данных для таймфрейма, на который устанавливается индикатор.
Параметры индикатора
- Основные настройки (Main Settings):
- HistoryBars - количество баров для отображения.
- CalculationPeriod - период для расчета индикатора.
- LevelType - тип уровней
- StaticLevelValue - значение для уровней..
- DynamicLevelPeriod - период для расчетов динамических уровней.
- ShiftDynamicLevel - сдвиг динамических уровней.
- Настройки оповещения (Alert Settings):
- Alerts - при true включается оповещение.
- AMessage - отображение диалогового окна.
- ASound - воспроизведение звукового файла.
- AEmail - отправка электронного письма по адресу, указанному в окне настроек на закладке "Почта".
- ANotificaton - отправка уведомления на мобильные терминалы.
- soundfile - название звукового файла.
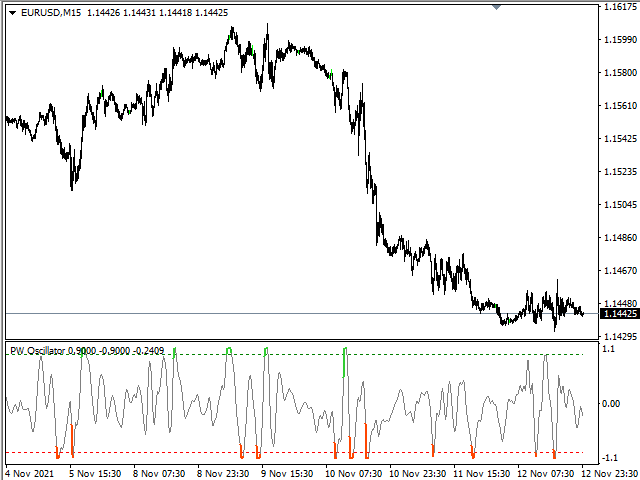
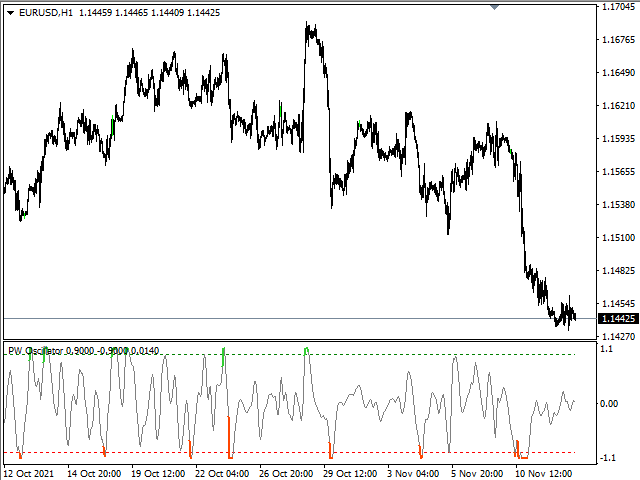
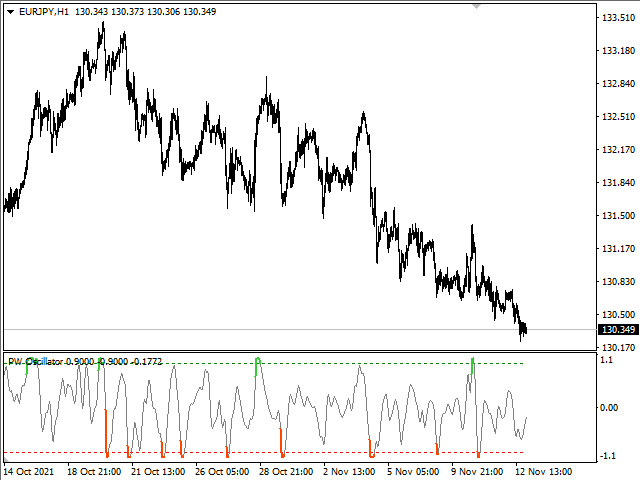
Extreme points... good measurement