IQ FX Strength MT5
- 지표
-
INTRAQUOTES
 ➡️ All Indicator & Script List: https://www.mql5.com/en/users/somfx/seller
 - 버전: 1.2
- 업데이트됨: 9 3월 2026
- 활성화: 5
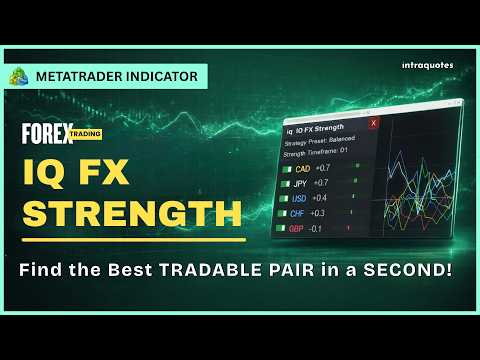
IQ FX Strength answers the single most important question in trading: "Who is truly driving the market right now?"
Designed with a stunning Hybrid UI, this tool separates true trend moves from market noise, allowing you to catch "Explosive" moves before the crowd sees them.
System Requirement: For higher accurate signal and optimal, smoother performance of this indicator without any lag, a good CPU (with RAM of atleast 8GB or above) and fast internet connection is highly recommended.
- Designed for new-gen traders
- Delivers smarter, data-driven strength analysis with improved clarity and reduced noise.
- The clean, ADHD-friendly dashboard focuses only on what matters most, keeping your workspace efficient and distraction-free.
- With a one-click button, instantly show or hide currencies for full control and flexibility.
- Premium performance, currently offered at a standard launch price, grab it before it’s too late.
- High-Speed Sync Engine: Indicator uses a premium loading architecture. It monitors 84 data streams simultaneously using a smart synchronization cycle that prevents terminal crashes and optimizes data caching.
Download MT4 Version here.
Indicator User Manual (with Trading Strategy) - Read here.
Follow our MQL5 channel for daily market insights, chart, indicator updates and offers! Join here.
Disclaimer:
- Due to regulatory and compliance restrictions, our service, including personalized technical support and one-on-one troubleshooting, is unavailable in India, Pakistan, and Bangladesh. Products purchased from these regions are ineligible for these services after purchase.
- Our products are available only on mql5.com.
- We never contact anyone or sell our products privately.
- We do not provide any personal trading advice.
- We do not sell any of the Intraquotes products on Telegram or any other platform, or website.
- This product operates only on standard MetaTrader 4 / MetaTrader 5 platforms. Third-party or modified environments are not supported.
- Not compatible with offline charts or custom/synthetic symbols.
- Does not provide Data Window values or buffers for EA integration.
- Intended strictly for manual trading; automated or algorithmic usage is not supported.
Key Features
1. Multi-Timeframe "Power" Algorithm
Most indicators look at one timeframe. IQ FX Strength calculates a weighted composite strength from M5 (Entry), H1 (Trend), and H4 (Bias) simultaneously. This creates a smooth, reliable signal that doesn't jitter with every tick.
2. Interactive "Command Center" Dashboard
Live Strategy Status:The dashboard now displays your active calculation mode (Balanced, Scalper, or Swing) in bold at the top of the panel for instant verification.
Live Rankings: Instantly see the strongest (Top) and weakest (Bottom) currencies.
Strength Bars: Visual "Power Meters" show you momentum intensity at a glance.
One-Click Show/Hide Button: Click any currency name to Hide/Show its line on the chart. Focus only on the pairs you are trading.
Transparent Overlay: A beautiful, modern interface that floats over your chart without obstructing the view.
3. "Explosive Cross" Signal
The indicator detects when two currencies diverge rapidly. It monitors Velocity. When the Strongest currency accelerates UP and the Weakest accelerates DOWN, it triggers an Explosive Alert, often signaling a high-momentum breakout.
4. Professional Visuals
Customizable Line Thickness:input to choose between "Normal" or "Thicker" lines for better visibility on high-resolution monitors.
Note: Graph History Bar- Optimized to display a high-performance graph of the recent bars, ensuring the smoothest possible UI updates and reduced CPU load.
Dynamic Auto-Scaling: The indicator automatically expands the vertical scale based on volatility; no more "flat lines" during quiet markets.
Smart Grid: Includes a dynamic right-side scale to read precise strength values.
5. Prop-Firm Ready
Automatically detects broker Suffixes and Prefixes (e.g., EURUSD.pro or xEURUSD). Plug and play on any broker.
User Manual Explains the following topics in full details:
1. Input Parameters:- System Settings
- Calculation Weights/Strategy Presets for Scalper, Swing Traders, Day Traders
- Alert Management
- Interface Settings with Dashboard and Color customization options.
2. Trading Strategy:
How to Use IQ FX Strength? Explained in the User Manual (check above for the link)
3. Understanding the Timeframe Weights:
The Calculation Weights section gives you full control over how the "Total Strength" is calculated. Think of these inputs like a Volume Mixer on a sound system. You decide which timeframe should be "loudest" in the final signal.
4. How it works (The Ratio Logic):
The weights work as a Ratio, not a fixed number. The indicator sums up your weights and calculates the percentage influence of each.
5. Visual Behavior Explained: Zoom vs. Squeeze
- How it Works:
- Why is this better?
- What You Will Receive:
- How This Helps You Trade?
8. Alert Sensitivity Guide: Setting Your Explosion Threshold
Bonus: A Quick Reference Table
Frequently Asked Questions (FAQ)
Q: Do I need to open all 28 charts manually for this indicator to work?
A: No, you do not need to open 28 separate charts. IQ FX Strength is engineered to do the heavy lifting for you by automatically adding all 28 required currency pairs to your Market Watch and requesting the data in the background. You only need to open a specific chart if the indicator identifies a symbol as "STUCK ON BROKER" during the preloading phase. This is a rare occurrence that happens when a broker’s server is slow to respond. In such cases, please follow the Detailed Fast Sync Guide provided below to "wake up" the data feed for those specific symbols instantly.
Important Note Regarding Strategy Tester Please Note
Due to the advanced nature of the IQFXS, backtesting in the Strategy Tester is disabled.
Why?
This indicator analyzes 28 Currency Pairs across 3 Timeframes simultaneously (Totaling 84 data streams) to calculate true currency strength. The Strategy Tester environment is designed to simulate only one pair at a time and cannot handle this massive multi-currency data load without freezing or crashing.
How to Test?
To see the indicator in action, simply drag and drop it onto any Live or Demo trading account chart after purchase. It will instantly calculate history and display the strength lines for you to review. Make sure you have a proper high-speed internet connection to load the data.
Troubleshoot:
Pro-Tip: How to Resolve "Stuck" Data (Fast Sync Guide):
Because IQ FX Strength calculates data across 28 symbols and 3 different timeframes, your MetaTrader terminal must sometimes be "nudged" to download this massive amount of history from the broker’s server.
If your preloading screen shows symbols under the "STUCK ON BROKER" list, follow these 3 simple steps to reach 100% instantly:
1. Open the Stuck Chart: Click the OPEN STUCK CHART button on the preloader (or manually open a new chart for the symbol listed in red).
2. Trigger the History Download: On that new chart, simply click through the M5, H1, and H4 timeframe buttons at the top of your terminal.
- Why? Clicking the timeframes forces MetaTrader to "demand" that specific history from the broker immediately.
3. Return & Refresh: Go back to the chart where IQ FX Strength is attached and click the FORCE REFRESH button.
The indicator will perform a fresh scan, recognize the newly downloaded data, and immediately move the progress bar to 100%.
Note: You only need to do this once. After the data is stored on your computer, the indicator will load nearly instantly every time you open it in the future.
Note on Symbol Switching & Data Synchronization:
"IQ FX Strength utilizes a sophisticated 28-symbol matrix calculation. When switching between different currency charts, your MetaTrader terminal must re-prioritize data streams from the broker's server.
What to expect: You may notice the currency rankings shift for 1–3 seconds immediately after changing a chart. This is a standard procedure while the terminal performs a 'Data Handshake' to ensure all 28 symbols are perfectly aligned with the new chart’s timeline.
Pro-Tip: For the most stable experience, keep your 'Market Watch' window open with the Major Forex pairs visible. This forces MetaTrader to keep the data feed active and ensures instant, flicker-free updates when switching symbols.
Support & Updates:
- For assistance, send us a direct message on MQL5.
- Follow our new channel (link given above) for updates and market insights.
- If you encounter any technical issues with the indicator, contact us directly on MQL5.