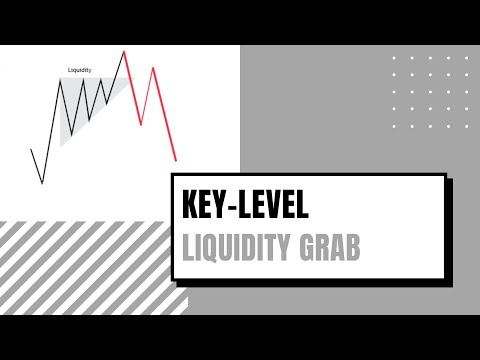
Key level liquidity grab
- 지표
- 버전: 1.1
- 업데이트됨: 11 4월 2024
- 활성화: 10

For a bullish move to occur for example, there should be alot of buying power. but you cannot buy if there is no sell on the other side, so the big players usually tend to manipulate the market in order to create available positions on the other side and be able to open their positions and one of the ways is by creating a fake breakout/ a liquidity grab.
Before majority of big reversal moves and trends are formed, a liquidty grab would have occured in order to have enough orders to push for the new move hence the importance of being able to identify the pattern.
The liquidty grab is also a major part of a lot of famous strategies the likes of The Wyckoff trading method, ICT, Quasimodo pattern, Smart money concept (SMC), BTMM just to name the few.
And if you have a diffuclt time trying to identify the direction of the market or a new trend, the Key level liquidty grab will make it easy for you because after most liquidty grabs, there are huge moves in the opposite direction removing the guess work in picking the direction of the trend.
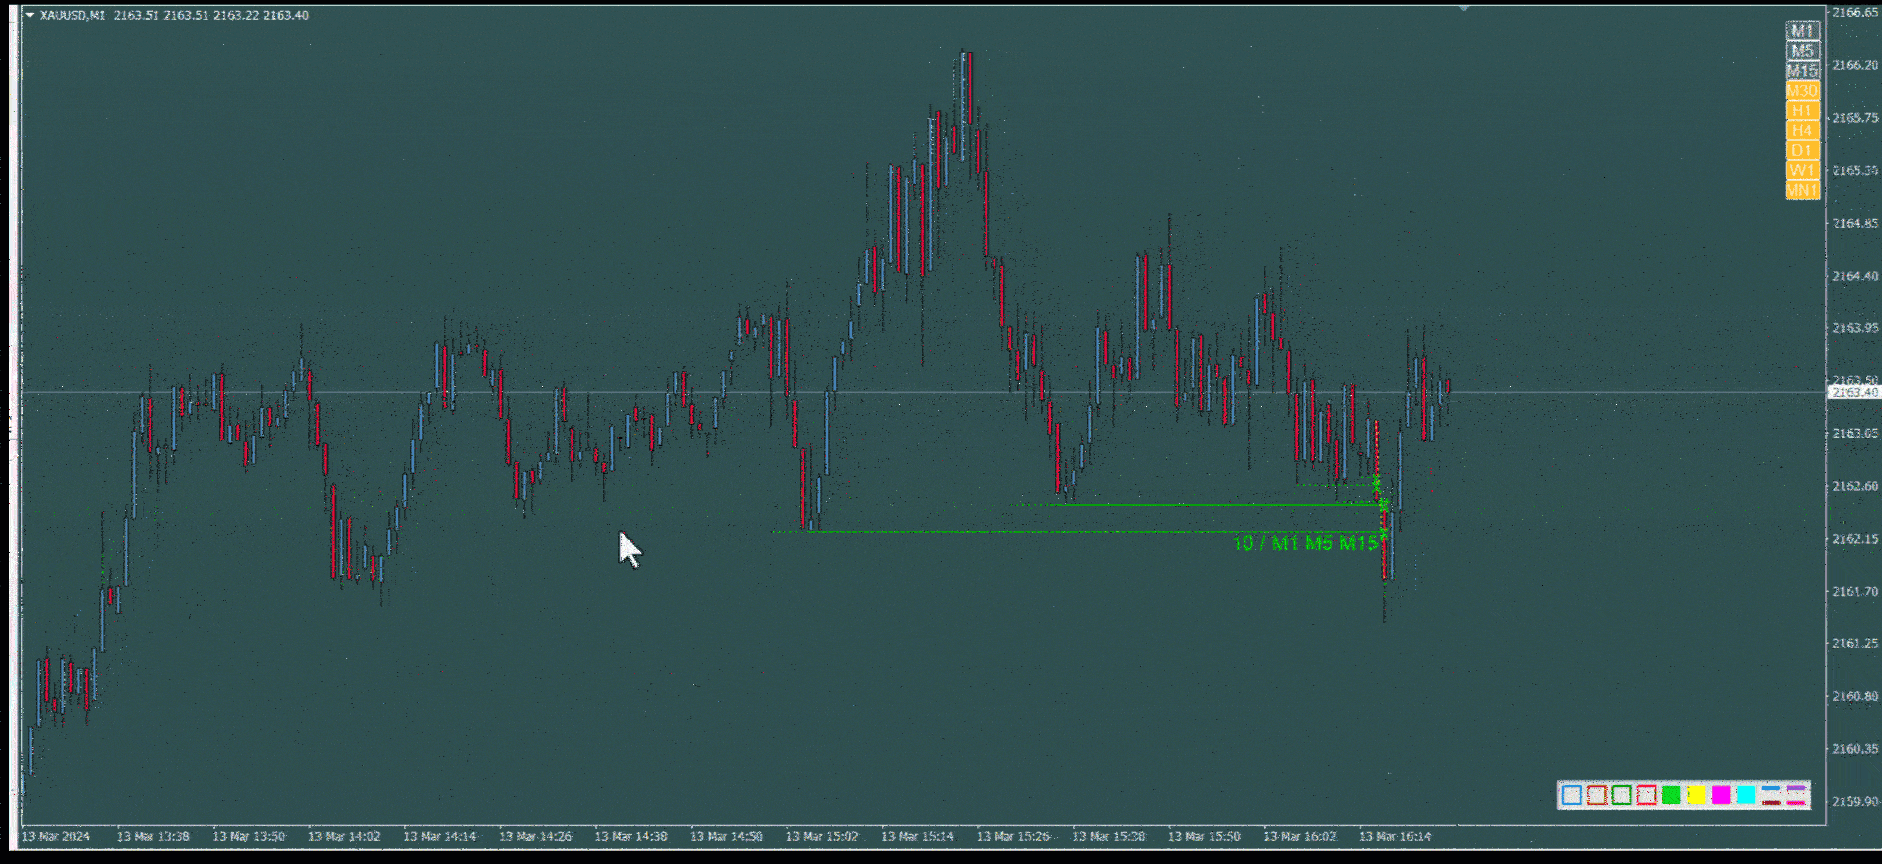
the Key level liquidty grab does an amazing job of:
- Printing out the pattern for you to see on your charts.
- Has a multi-timeframe dashboard where you not only get notified of a liquidity grab on your current timeframe, but can select multiple timeframes and get notified when their liquidity is grabbed by your current timeframe candles.
- Ability to choose the number of liquidity lines to be engulfed until a pattern is drawn. The larger the number usually means the larger pool of liquidity grabbed, and the more volatile the upcoming reversal or trend.
- Once a liquidity pattern is drawn it DOES NOT REPAINT, and you are able to see past liquidty grabs to see what type of conditions created the largest reversals.
- Alerts and notify you via sound and push noification
Recommendation