MetaTrader 4용 무료 기술 지표 - 12

Principles of construction of the indicator. The Absolute Bands (AB) indicator is reminiscent of the Bollinger Bands indicator with its appearance and functions, but only more effective for trading due to the significantly smaller number of false signals issued to them. This effectiveness of the Absolute Bands indicator is due to its robust nature. In the Bollinger Bands indicator, on both sides of the moving average - Ma, there are lines spaced from Ma by the standa
FREE

A classical MACD indicator where both the MACD line and the Signal line are displayed as lines. The difference between MACD and Signal line is displayed as a histogram. A user can change the color and thickness of histogram lines. So, histogram lines can be grouped into four different groups: positive ascending, positive descending, negative descending and negative ascending. Multi-currency Dashboard for the indicator is available https://www.mql5.com/en/market/product/72354
FREE

Current indicator shows the trading sessions for the major financial centres: London New York Tokyo Sydney There are available two types of displaying zones: in sub window below the chart and on the chart. When the subwindow is selected, the sessions are shown in the form of bars. If the sessions are shown on the main chart, they are displayed in the form of lines at the open price of the session that may also act as a support and resistance for further price action during the trading day. The
FREE
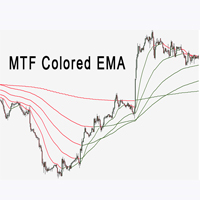
다중 시간 프레임 EMA 표시기는 추세 방향을 결정하는 데 큰 도움이 됩니다. 기존 전략이나 새로운 기반에 훌륭한 추가 사항이 될 수 있습니다. 우리 인간은 시각적으로 더 잘 볼 때 더 나은 결정을 내릴 수 있습니다. 그래서 우리는 상승 추세와 하락 추세에 대해 다른 색상을 표시하도록 설계했습니다. 누구나 자신에게 가장 적합한 방식으로 사용자 정의할 수 있습니다. 차트의 모든 기간에 대해 Ema 표시기를 설정할 수 있습니다.
dajung sigan peuleim EMA pyosigineun chuse banghyang-eul gyeoljeonghaneun de keun doum-i doebnida. gijon jeonlyag-ina saeloun giban-e hullyunghan chuga sahang-i doel su issseubnida. uli ingan-eun sigagjeog-eulo deo jal bol ttae deo na-eun gyeoljeong-eul nael
FREE

Fibomathe Indicator: Support and Resistance Tool for MT4 The Fibomathe Indicator is a technical analysis tool designed for MetaTrader 4 (MT4) that assists traders in identifying support and resistance levels, take-profit zones, and additional price projection areas. It is suitable for traders who use structured approaches to analyze price action and manage trades. Key Features Support and Resistance Levels:
Allows users to define and adjust support and resistance levels directly on the chart. L
FREE
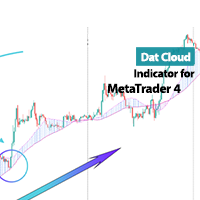
Dat Cloud Indicator MetaTrader 4 The Dat Cloud Indicator is a specialized trading tool designed for technical traders who rely on moving averages to determine market trend direction. This indicator merges two moving averages and visualizes their difference in the form of a cloud, highlighting bullish and bearish market trends. Traders using MetaTrader 4 can also apply the Dat Cloud to identify support and resistance zones during price pullbacks. «Indicator Installation & User Guide»
MT4 Indica
FREE

Unlock your trading potential with Momentum Master , the smart indicator designed to help you navigate the markets with confidence. This powerful tool provides clear, actionable signals by combining the strengths of multiple proven indicators. Say goodbye to guesswork and hello to precision trading. Momentum Master is more than just a signal provider; it's your personal market analyst. It uses a unique combination of Moving Averages (EMA 34 & 55) to identify the trend, MACD for trade confirmatio
FREE

스타일이 중요하기 때문에 촛불의 색상, 배경을 밝거나 어둡게 변경하고 격자를 넣거나 제거하기 위해 매번 속성을 클릭하는 것이 얼마나 성가신 일인지 압니다. 클릭 한 번으로 해결하는 방법은 다음과 같습니다. 차트에서 그리드를 표시하거나 숨기는 버튼 1개. 트레이더가 원하는 캔들 스타일을 선택할 수 있는 3개의 맞춤형 버튼. 주간 모드와 야간 모드 사이를 전환하는 버튼 1개. *****설정에서 화면에서 버튼을 표시할 위치를 선택할 수 있습니다.*** 내 다른 제품을 확인하는 것을 고려하십시오 https://www.mql5.com/en/users/javimorales.fer/seller 스토캐스틱 RSI란 무엇입니까? 스토캐스틱 RSI(StochRSI)는 0과 1(또는 일부 차트 플랫폼의 경우 0과 100) 범위의 기술적 분석에 사용되는 지표이며 스토캐스틱 오실레이터 공식을 상대 강도 지수(RSI) 값 세트에 적용하여 생성됩니다. 표준 가격 데이터보다 작가 트레이딩 알고리즘의 창시자 하비
FREE
Indicador ADX usado no método das Agulhadas do Didi que irá te facilitar a se manter no trade, enquanto estiver na cor azul você não irá precisar olhar outros sinais para sair do trade e inversamente enquanto estiver amarelo você irá segurar a venda. Tudo de forma rápida e visual. O indicador ADX mostra se existe tendência no mercado, esse indicador usado junto com as agulhadas é a combinação perfeita para você surfar os movimentos fortes do mercado!!!!
FREE
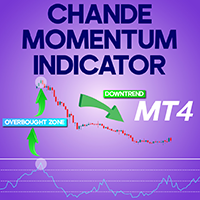
Chande Momentum Indicator in MT4 The Chande Momentum Indicator in MT4 (CMO) is a technical oscillator designed to detect momentum shifts and potential price extremes, much like the RSI and MACD. However, this tool calculates net price changes over a defined number of periods, instead of relying on average price levels. As a result, it provides a sharper perspective on the strength and pace of price movements in MetaTrader 4. «Indicator Installation & User Guide»
MT4 Indicator Installation | C
FREE

The statistical indicator for the metatrader 5 TradingStatisticPro collects statistical data on your trade, which makes it easier to assess the effectiveness of trading, the profit received and the risks. The indicator is compactly placed in the corner of the main chart of the terminal and displays the following information: 1. The profit earned. 2. Maximum drawdown. 3. The recovery factor. 4. Profit factor. 5. The ratio of profitable and unprofitable transactions (winrate). 6. Average profit a
FREE

''Trendlines'' is an Indicator, that every Trader need and shows Trendline and Support and resistance levels in all Timeframe's. Also In 1-hour, 4-hour and daily time frames and Current timeframes, support, and resistance levels are specified and trend lines are drawn so that the trader can see all levels on a chart. In Properties it is possible to turn off unnecessary Lines.
In ' Tendency indicator '' , as full package of Predictions that every Trader need, there is also the Predict
FREE
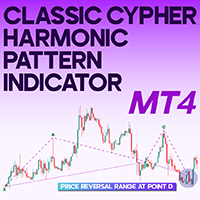
Classic Cypher Harmonic Pattern Indicator for MT4 The Classic Cypher Harmonic Pattern Indicator is a sophisticated technical analysis tool based on specific Fibonacci ratios. As a harmonic pattern indicator, it identifies precise reversal zones by recognizing the unique geometric structure of the Cypher pattern. This formation consists of four consecutive price waves and five key points—X, A, B, C, and D—formed according to a defined sequence of market movements. The main objective is to detect
FREE

ATR Bands with Take-Profit Zones for MT4 The ATR Bands indicator for MT4 is designed to assist traders in managing risk and navigating market volatility. By using the Average True Range (ATR), it helps identify key price levels and set realistic stop-loss and take-profit zones. Key Features: ATR-Based Bands : The indicator calculates dynamic upper and lower bands using ATR. These bands adjust based on price volatility, helping to indicate potential support and resistance levels. Customizable Par
FREE
Simple SuperTrend indicator, similar to that of TradingView's.
Links: All-In-One Supertrend MT5 Version
It has buffers for buy and sell signal, if you want to integrate this into an EA.
It helps traders easily identify trends by providing clear buy and sell signals based on price movements. Designed for simplicity, it’s easy to use and integrates well with various trading strategies, making it a great option for traders of all levels.
Happy trading!
FREE
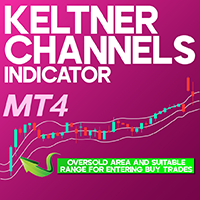
Keltner Channels Indicator for MetaTrader 4 The Keltner Channels Indicator is a technical analysis tool designed to identify trends, volatility, and potential entry and exit points in the market. While it visually resembles Bollinger Bands with its three colored bands indicating overbought and oversold zones, it differs significantly in its calculation method, interpretation, and trading signals. «Indicator Installation & User Guide» MT4 Indicator Installation | Keltner Channels Indicator MT5
FREE

My Fibonacci An automated Fibonacci indicator that combines ZigZag swing detection with comprehensive Expert Advisor integration through a 20-buffer system. More details about data specification and EA integration: https://www.mql5.com/en/blogs/post/764109 Core Features Automated Fibonacci Detection The indicator identifies swing points using configurable ZigZag parameters and draws Fibonacci retracements and extensions automatically. It updates levels as new swing formations develop. Market Ad
FREE
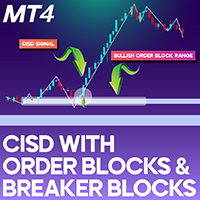
CISD with Order Blocks and Breaker Blocks ICT MT4 The CISD Indicator with Order Blocks and Breaker Blocks (CISD-CSD + OB & BB) is an ICT-based tool for MetaTrader 4 , designed to analyze changes in market delivery dynamics, order blocks, and breaker blocks. It automatically detects breakout signals at CISD levels , providing traders with clear entry points. This indicator assists in identifying both bullish and bearish order blocks , which play a significant role in market structure and trend an
FREE

The purpose of this new version of the MT4 standard indicator provided in your platform is to display in a sub-window multiple timeframes of the same indicator. See the example shown in the picture below. But the display isn’t like a simple MTF indicator. This is the real display of the indicator on its timeframe. Here's the options available in the FFx indicator: Select the timeframes to be displayed (M1 to Monthly) Define the width (number of bars) for each timeframe box Alert pop up/sound/ema
FREE
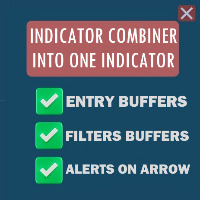
Optimize your trading strategy of your custom indicators with the "Indicator Combiner Into One Indicator". This advanced tool combines multiple indicators, including your custom indicators, into a single, user-friendly interface. It generates an arrow signal based on your custom indicators, simplifying your decision-making process. Ideal for traders of all levels, this indicator offers:
Arrow Signals : Get a clear, single arrow signal that combines insights from your custom indicators, mak
FREE
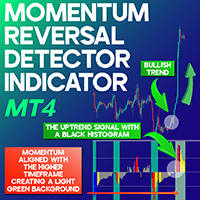
Momentum Reversal Detector Indicator for MetaTrader 4 The Momentum Reversal Detector Indicator for MetaTrader 4 is designed to detect potential trend reversals by evaluating price momentum shifts. It utilizes a black histogram to monitor momentum changes and highlights possible entry and exit points at critical turning zones. When the indicator detects positive momentum on a higher timeframe, the background color shifts to light green. It also marks Up Divergence (purple) at the exhaustion of up
FREE

Quantum Swing 1. What is Quantum Swing The indicator calculates and displays future price levels based on quantum mathematics with high accuracy of probability and direction. Levels are displayed in the form of zones for making trading decisions; they clearly define a narrow price range for placing orders with a minimum stop-loss and maximum take-profit. The indicator displays future trading zones on different timeframes H1, H4, D, W. Quantum oscillations are also displayed without reference to
FREE

Trend Trading Indicator – Helping You Capture the Best Market Trends Advantages of the Indicator Precise Trend Identification :
The indicator provides clear signals to help you quickly understand market trend changes, making your trading decisions more efficient without the need for complex analysis. Flexible Parameter Selection :
Customize the calculation period, moving average method (e.g., SMA, EMA, LWMA), and applied price type (e.g., Close, Open, High). Whether you're a short-term trader or
FREE
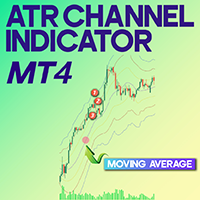
ATR Channel Indicator (Average True Range Channel) MetaTrader 4 The ATR Channel Indicator is a powerful technical analysis tool in MetaTrader 4 designed to measure market volatility and identify price trends. By utilizing adaptive algorithms and dynamic price channels, this indicator enhances trading precision. A key advantage of the ATR Channel Indicator is its ability to pinpoint optimal Buy and Sell signals while minimizing trend-following errors. «Indicator Installation & User Guide»
FREE

Heiken Ashi Button Heiken-Ashi , often spelled Heikin-Ashi, is a Japanese word that means "Average Bar." The Heiken-Ashi approach can be used in conjunction with candlestick charts to spot market trends and forecast future prices. It's useful for making candlestick charts easier to read and analysing patterns. Traders can use Heiken-Ashi charts to determine when to stay in trades while the trend continues and close trades when the trend reverses. The majority of earnings are made when markets a
FREE

Volume Analysis Trader looks at volume using a fixed average of volume. This averaging helps spot when volume is rising or declining. Also I have added volume spikes which are when volume suddenly is above the average. These help spot market reversals. This will hep a trader look for the following in their trading: Rising volume during a rally shows trend is strong. Falling volume on a rally shows trend is weakening. As a rule of thumb on daily charts if current volume is higher than yesterday's
FREE
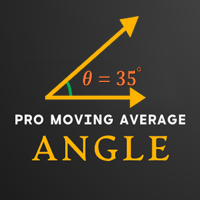
This indicator is a professional Trend identifier, it measures the angle or slope of moving averages with different methods. As this indicator calculate angles you can identify the strength of trend by magnitude of angle. It also shows if angle is increasing or decreasing which gives you the opportunity to make more information about current trend. You can combine this indicator with your strategy as a filter or you can use it alone to make your trading system. This is not a repainting indicator
FREE

CISD High and Low ICT Indicator for MetaTrader 4 The CISD – CSD + High and Low Indicator is a liquidity-based tool for MetaTrader 4, designed following ICT trading principles to identify potential market reversals. This indicator utilizes the CISD (Critical Institutional Supply and Demand) methodology, marking trade entry points by tracking key high and low-price levels across various timeframes, such as daily, weekly, and monthly charts. CISD + High & Low Indicator Features Below is a breakdo
FREE
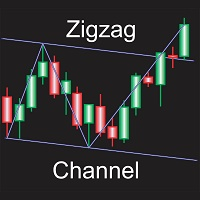
Automatically draws channel base on zigzag, with option to draw zigzag based on candle wicks or close prices. All zigzag parameters can be adjusted in settings, option to display or hide zigzag also available, every other adjustable settings are self explanatory by their name, or at least so I believe. Only download this indicator if you need a program to automatically plot channels for you based on zigzag of any specific settings.
FREE

This is a custom MT4 indicator called “Elsna Moving Average” . It plots three moving averages (MA1, MA2, MA3) on the chart with customizable periods, shifts, methods, and applied prices. MA1 & MA2 can optionally be used to create fill areas (histogram-like shading) based on a color-fill setting. MA3 is an additional moving average line for trend analysis. You can show or hide each MA individually. The indicator is designed for trend identification and visualization , help
FREE
BinaryPin is an indicator developed and adapted specifically for trading short-term binary options. The indicator's algorithm, before issuing the signal, analyzes many factors, such as market volatility, searches for the PinBar pattern, calculates the probability of success when making a deal. The indicator is set in the usual way. The indicator itself consists of an information window where the name of the trading instrument is displayed, the probability of making a successful transaction, the
FREE
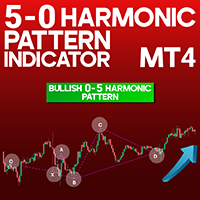
5-0 Harmonic Pattern Indicator MT4 The 5-0 Harmonic Pattern indicator is a practical tool in the MetaTrader 4 platform for identifying harmonic patterns. This indicator detects the 5-0 harmonic pattern by locating 6 pivot points on the chart and visualizing it by drawing connecting lines. Traders can spot bullish and bearish formations by combining this indicator with technical analysis, enabling more refined and specialized chart analysis. «Indicator Installation & User Guide» MT4 Indicator Ins
FREE

Economic Calendar Viewer
This economic events reader is adapted to load data from a csv file. You can prepare the csv file yourself according to this template, you can do it in notepad or csved. The file should normally be named Calendar-MM-DD-YYYY.csv. And contain lines with data column headers according to this example. In the Impact column, i.e. impact on the market depending on the importance of the event, the names accepted from the least important are: None, Low, Medium, High. In columns
FREE
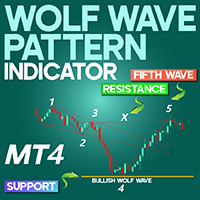
Wolf Wave Pattern Indicator MetaTrader 4 The Wolf Wave Pattern Indicator for MetaTrader 4 is a specialized technical analysis tool designed to detect wave structures within the financial markets. This indicator is particularly effective in identifying the Wolf Wave Pattern, which consists of five distinct geometric waves signaling potential market reversals. By using this indicator, traders can optimize their entry and exit points based on precise pattern recognition. «Indicator Installation & U
FREE

Judas Swing ICT Forex With Confirmation Indicator MT4 The Judas Swing ICT Forex with Confirmation Indicator is designed based on the ICT trading approach, leveraging market structure and liquidity analysis within the one-minute chart. This tool assists traders in recognizing key liquidity zones and significant trend reversals. This MetaTrader 4 indicator highlights areas where liquidity builds up and potential false breakouts, commonly referred to as Judas Swings . These zones are distinctly mar
FREE

Rule Plotter로 자동 거래 로봇 만들기 마우스 몇 번 클릭만으로 거래 전략을 자동화할 수 있다면 얼마나 강력할까요? 복잡한 코드를 파헤치지 않고도 다양한 거래 전략을 만들고 테스트할 수 있다면 얼마나 자유로울까요. Rule Plotter를 사용하면 이러한 비전을 현실로 만들 수 있습니다. 여기서는 Rule Plotter를 사용하여 사용자 정의 거래 로봇을 만드는 방법을 살펴보겠습니다. Rule Plotter는 전체 프로세스를 단순화하는 거래 시스템 생성 도구입니다. Rule Plotter란 무엇이며 어떻게 작동합니까? Rule Plotter는 MetaTrader의 지표를 사용하여 전문가 자문자 (EA)를 작성하기 위해 설계된 프로그램입니다. 이 도구를 사용하면 복잡한 프로그래밍 세부 사항을 이해하지 않고도 거래 전략을 자동화할 수 있습니다. 프로세스는 간단합니다. 원하는 지표를 차트에 추가하고 진입 및 종료 조건을 정의한 다음 Rule Plotter에게 나머지 일을 맡기면
FREE

Based on famous and useful indicator - Super Trend, we add some features to make this Indicator much easier to use and powerful. Ease to identify the trend of any chart. Suitable for both Scalping & Swing Better to use in the trending market be careful in sideway market, it might provide some fake signals Setting: ATR Multiplier ATR Period ATR Max Bars (Max 10.000) Show UP/DOWN node Nodes size Show Pull-back signals Pull-back filter ratio Period of MA1 Mode of MA1 Period of MA2 Mode of MA2 A
FREE

PLEASE TAKE NOTICE: This indicator is in current development. final version will be free.
This is a simple indicator that uses 3 timeframes in its formula to create Possible buy and sell signals. This indicator is optimized for the M1 timeframe Only. It has 2 types of Alerts: Push Notifications Audio Alerts UPDATES:
3/19/24: Still testing the final code
Troubleshooting: When loading the indicator, if you don't see the arrows on the current chart that means that MT4 has not loaded all the high
FREE

The Master Trend Analyzer is a powerful and flexible MetaTrader 4 (MT4) indicator designed to help traders analyze trends across multiple timeframes simultaneously. By combining multiple Moving Averages (MAs) from different timeframes into one chart, this tool provides a clear and comprehensive view of market trends, making it easier to identify key support/resistance levels, confirm trends, and make informed trading decisions. Advantages of Multi-Timeframe MA Master Multi-Timeframe Analysis
FREE

TG MTF MA MT5 is designed to display a multi-timeframe moving average (MA) on any chart timeframe while allowing users to specify and view the MA values from a particular timeframe across all timeframes. This functionality enables users to focus on the moving average of a specific timeframe without switching charts. By isolating the moving average values of a specific timeframe across all timeframes, users can gain insights into the trend dynamics and potential trading opp
FREE

고릴라 채널은 장기 관측에 기초하여 수정 된 채널 표시이다.
신호 거래 표시기는 추세 채널을 표시하는 표시기와 입력 신호 소스 중 하나로 사용할 수 있으며 추가 필터링이 적용됩니다. 올바른 접근 방식으로,성공적인 거래의 적어도 80%.
고릴라 채널의 주요 특징: 분석 기능
모든 통화 쌍 및 시간 프레임에서 사용할 수 있습니다; 표시기가 다시 그려지지 않습니다; 그것은 다른 지표에 큰 도움이됩니다; 그래픽 기능
차트의 최소 위치 수를 차지합니다; 유연한 팅크; 쉽게 배울 수; 주요 특징
온/오프 경고를 설정하는 기능; 메시지 및 모바일 알림의 형태로 이메일 알림; 고릴라 채널 시작: 표시기를 시작하고 최적의 팅크를 조정하십시오.
고릴라 채널 설정:
전시
체크 바-채널 표시기 크기(최적 값:150-200); 유연성-신호 튜닝(최적의 값:5-20); 편차-채널 폭(최적 값:1.618-3); 중앙선-중앙 점선 참|거짓 표시; -신호 수(권장 홀로 터치); 알림
FREE
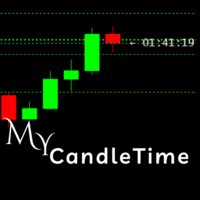
My CandleTime
This indicator displays the remaining time until the current candle closes directly on the chart.
It is designed to help traders keep track of candle formation without constantly checking the platform’s status bar. Main Features Shows countdown timer for the active candle. Works on any symbol and timeframe. Lightweight, does not overload the terminal. Adjustable font size and name. How to Use
Simply attach the indicator to a chart.
You can customize font size, color, and font to
FREE

MA Cross Histogram Oscillator (MT4) The MA Cross Histogram Oscillator is a custom indicator designed to visualize the relationship between two moving averages in the form of a color-coded histogram. Instead of drawing standard MA lines on the chart, it highlights the strength and direction of the trend by comparing the difference between a fast and a slow moving average. Green bars – bullish momentum (fast MA is above slow MA and rising). Red bars – bearish momentum (fast MA is below slow MA and
FREE
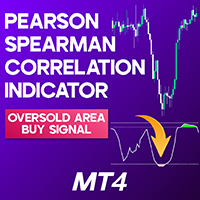
Pearson Spearman Correlation Indicator for MT4 The Pearson Spearman Correlation Indicator combines elements of statistical analysis and technical trading to evaluate relationships between variables and detect trend movements on the MT4 terminal. It calculates both linear and rank-based (nonlinear) correlations, showing values between -1 and 1 directly on the chart interface. «Indicator Installation & User Guide»
MT4 Indicator Installation | Pearson Spearman Correlation Indicator MT5 | ALL P
FREE

이것은 무료 제품이므로 필요에 따라 사용하시면 됩니다!
또한 긍정적인 피드백에 감사드립니다! 대단히 감사합니다!
// 훌륭한 트레이딩 로봇과 표시기는 여기에서 확인할 수 있습니다 : https://www.mql5.com/en/users/def1380/seller ............................................................................................................................................ MT4용 외환 지표 스프레드 디스플레이, 훌륭한 보조 거래 도구.
- 스프레드 디스플레이 지표는 부착된 외환 쌍의 현재 스프레드를 표시합니다. - 차트의 어느 모서리에서나 스프레드 디스플레이 값을 찾을 수 있습니다: 0 - 왼쪽 상단 모서리, 1 - 오른쪽 상단, 2 - 왼쪽 하단, 3 - 오른쪽 하단 - 색상과 글꼴 크기도 설정할 수 있습니다. 이 MQL5 웹사이트에서
FREE
*LIMITED FREE! DOWNLOAD NOW*
CDS Fractal Divergence Oscillator (AIO): The Ultimate Multi-Oscillator Divergence Tool with 15 Oscillator Options The CDS Fractal Divergence Oscillator (AIO) is a robust and highly versatile indicator engineered to empower traders in identifying crucial trend reversals and momentum shifts through advanced divergence detection. Its unparalleled strength lies in its unique ability to analyze divergence across 15 distinct built-in oscillator types and its grou
FREE

This Weis Wave Volume indicator is a tool to help traders identify the current price trend. Understanding volume can provide insight into a market's behavior to help you determine its overall health. The most important rule is this: volume precedes price. Typically, before a market price moves, volume comes into play. It has 2 main colors histogram which are green and red. – Green indicates an upward wave. The more the price increases, the bigger the green volume gets. – The red color shows a d
FREE
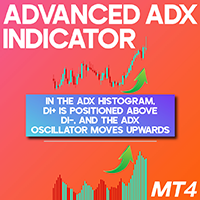
Advanced ADX Indicator for MetaTrader 4 The Advanced ADX Indicator for MetaTrader 4 (MT4) is designed to gauge the intensity of prevailing price movements in the market. This tool visualizes the strength of the trend using a histogram that spans from 0 to 100, using green bars to indicate bullish strength and red bars for bearish momentum. A taller histogram bar reflects a more dominant trend. The oscillator typically uses a 13-period setting as its default configuration. «Indicator Installation
FREE
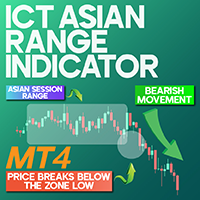
ICT Asian Range Indicator MetaTrader 4 The ICT Asian Range Indicator is developed to display price consolidation zones based on the ICT trading methodology. During the Asian session, the Forex market often remains in a tight range, followed by increased volatility and stronger movements during the London and New York sessions. This session and kill zone indicator for MT4 highlights the Asian session range using red boxes drawn directly on the chart. «Indicator Installation & User Guide» MT4 Indi
FREE

False Breakout Stochastic to be used with our Elliott Wave Indicator as part of the overall strategy on trading the 5th wave.
As we cannot upload multiple files, we have listed this separately. False Breakout Stochastic is best used as a confirmation tool rather than the sole signal indicator The Elliott Wave Indicator Suite is designed around a simple but effective Swing Trading Strategy. The Indicator Suite is great for Stocks, Futures and Forex trading on multiple timeframes You can find the
FREE
FREE Spread indicator for MetaTrader 4 this indicator includes: -average spread -current spread -minimum spread -maximum spread
If you are interested in my products I recommend you visit my page where you can find: Experts Advisors: https://www.mql5.com/it/market/product/119456?source=Site+Profile indicators: https://www.mql5.com/it/market/product/120038?source=Site+Profile
I hope the spread indicator will be useful to you.
https://www.mql5.com/it/users/kappa05
FREE

표시기는 표시된 정보를 단순화하도록 설계된 하나의 차트에 두 개의 서로 다른 쌍을 표시합니다.
터미널에서 사용 가능한 거의 모든 금융상품(통화쌍뿐만 아니라 금속 및 원자재)에 대한 작업이 가능합니다. 모든 통화쌍에 대한 시각적 상관관계 방법을 사용하는 기능 하위심볼. 통화 쌍은 색깔 있는 양초와 함께 화면에 표시됩니다. 이것은 동일한 상관 쌍입니다. 미러링. 보조 통화. 이 지표는 두 가지 유형의 상관관계를 반영합니다.
설정
하위 기호 = "USDCHF"; BullBarColor = 주황색빨간색; BearBarColor = 노란색; 색상 GridColor = 흰색; 미러링 = 거짓;
The indicator displays two different pairs on one chart, designed to simplify the displayed information, Capable of working with almost all instruments a
FREE
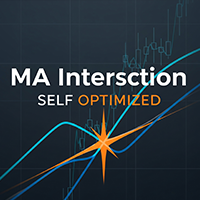
자동 최적화 이동 평균선(MA) 지표 이 지표는 지정된 기간(캔들/바) 내에서 최적의 이동 평균선(MA) 기간을 자동으로 찾아줍니다. 가장 높은 수익을 내거나, 가장 좋은 승률을 보이는 조합을 자동으로 검색합니다. 작동 방식: 매수 신호: 빠른 MA가 느린 MA를 아래에서 위로 교차할 때. 매도 신호: 빠른 MA가 느린 MA를 위에서 아래로 교차할 때. 지표는 다양한 MA 기간을 테스트하여 최적의 조합을 찾아내고, 이를 차트에 바로 표시해 줍니다. 교차 지점에서는 해당 거래의 예상 수익 정보도 함께 보여줍니다. 주요 특징 자동 최적화: 최대 수익 또는 가장 좋은 승률을 기준으로 MA를 자동으로 최적화합니다. 명확한 신호 표시: 최적화된 MA와 매매 신호를 차트 위에 직접 표시합니다. 수익 정보 제공: 각 교차 지점에서 예상 수익을 보여줍니다. 시간 절약: 트레이더가 일일이 최적의 기간을 찾을 필요 없이, 바로 사용할 수 있는 진입 신호를 제공합니다. 설정 기간: 최적화를 실행할 캔들
FREE

Transform your trading approach with reliable bullish and bearish patterns This indicator evaluates volatility and price directionality simultaneously, which finds the following events. Decisive and sudden price movements Large hammers/shooting stars patterns Strong breakouts backed by most market participants Indecisive but volatile market situations It is an extremely easy to use indicator... The blue histogram represents the bullish impulse The red histogram represents the bearish impulse The
FREE

В основе индикатора TDI лежат следующие индикаторы: RSI, Moving Average, Bollinger bands, но основным из них нужно выделить RSI, весь расчет индикатора завязан от его значений.
Зеленая линия (линия RSI) – сглаженные простой (по умолчанию) скользящей средней значения индикатора RSI, период сглаживания 2.
Красная линия (сигнальная линия) – сглаженные простой (по умолчанию) скользящей средней значения индикатора RSI, период сглаживания 7.
Синие линии – индикатор Bollinger bands по умолчанию пери
FREE

This indicator show candle time remaining. The remaining time of the candle is calculated every 200 milliseconds. 1. You can set x (horizontal), y (vertical) of text. 2. You can set font, color, size of text. 3. You can remove the text without having to remove the indicator from the chart. The remaining time of the candle depends on the timeframe of the chart with the indicator.
FREE
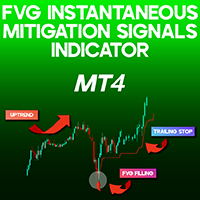
FVG Rapid Mitigation Signals Indicator MT4 The FVG Rapid Mitigation Signals indicator is designed to detect fair value gaps (FVGs) that are swiftly filled, marking them with arrows for easy identification. Once these gaps are recognized, the indicator on MetaTrader 4 automatically generates a Trailing Stop , aligning with the trend direction for optimal trade management. «Indicator Installation & User Guide»
MT4 Indicator Installation | FVG Instantaneous Mitigation Signals Indicator MT5 | A
FREE

This indicator is not only for trading but also for learning, thanks to it, you can learn to identify trend, support and resistance.
You've probably heard about the Dow trend theory, where higher highs and higher lows indicate an uptrend, and lower highs and lower lows indicate a downtrend. This indicator determines this trend based on the Dow Theory. You just need to enter a number representing the number of candles between extremes. The optimal solution is the number 3 (H1 TF), unless you wa
FREE

The Pivot Point indicator automatically calculates and displays the pivot point line and support and resistance levels. Pivot can be calculated according to the Classic, Floor, Fibonacci, Woodie, Camarilla or DeMark formula. It is also possible to select the period for calculating the indicator. A trader can choose from daily, weekly, monthly, or user-defined periods.
Types of pivots Classic Floor Fibonacci Woodie Camarilla DeMark
Main features The indicator shows the current and historic
FREE

The Candle Countdown Timer for MetaTrader 4 (also available for MT5) is a vital indicator designed to help you manage your trading time effectively. It keeps you updated about market open and close times by displaying the remaining time before the current candle closes and a new one forms. This powerful tool enables you to make well-informed trading decisions. Key Features: Asia Range: Comes with an option to extend the range. Broker Time, New York, London Time: Displays the current broker time
FREE

친애하는 친구, 나는 당신의 관심에 지표 Visual Correlation 를 제시합니다.
서로 다른 통화 쌍의 동작은 서로 연결되어 있습니다. Visual Correlation 표시기를 사용하면 척도를 유지하면서 하나의 차트에 다른 상품을 표시할 수 있습니다. 양의 상관 관계, 음의 상관 관계 또는 상관 관계 없음을 정의할 수 있습니다.
일부 악기는 다른 악기보다 먼저 움직이기 시작합니다. 이러한 순간은 그래프를 오버레이하여 확인할 수 있습니다.
차트에 상품을 표시하려면 Symbol 필드에 상품 이름을 입력합니다.
서로 다른 통화 쌍의 동작은 서로 연결되어 있습니다. Visual Correlation 표시기를 사용하면 척도를 유지하면서 하나의 차트에 다른 상품을 표시할 수 있습니다. 양의 상관 관계, 음의 상관 관계 또는 상관 관계 없음을 정의할 수 있습니다.
일부 악기는 다른 악기보다 먼저 움직이기 시작합니다. 이러한 순간은 그래프를 오버레이하여 확인할 수 있습니다
FREE

"Capture the sleeping and waking alligator." Detect trend entrance/exit conditions - this indicator can also be tuned according to your trading style. You can adjust a confidence parameter to reduce false positives (but capture less of the trend). This is based on a modification of the Alligator indicator by Bill Williams, an early pioneer of market psychology. 2 main strategies: either the " conservative" approach to more frequently make profitable trades (at a lower profit), or the " high r
FREE

The indicator looks for market Highs and Lows. They are defined by fractals, i.e. the market creates the indicator algorithm and structure, unlike ZigZag having a rigid algorithm that affects the final result. This indicator provides a different view of the price series and detects patterns that are difficult to find on standard charts and timeframes. The indicator does not repaint but works with a small delay. The first fractal level is based on the price, the second fractal level is based on t
FREE

AWESOME MACD INDICATOR
Awesome MACD Indicator is a powerful trading tool that combines the strengths of Moving Average (MA) and Moving Average Convergence Divergence (MACD) to provide accurate and reliable trading signals. Designed for forex and stock traders, this indicator simplifies the identification of trading opportunities by detecting significant crosses in price movements. Key Features:
MA and MACD Combination: Awesome MACD leverages the power of Moving Averages (MA) to identify short-te
FREE

This is an unconventional version of the Heiken Ashi Smoothed indicator implemented as lines rather than a histogram. Unlike a usual histogram, the indicator draws the readings of the two moving averages in the form of colored lines.
Example If the candle crosses two indicator lines upwards, a trend is assumed to be changing from bearish to bullish. If the candle crosses two indicator lines downwards, a trend is assumed to be changing from bullish to bearish. The indicator is good at displaying
FREE

Are you tired of plotting fibonacci retracements or extensions manually? This indicator displays fibonacci retracements or extensions automatically, calculated from two different price points, without human intervention or manual object anchoring. [ Installation Guide | Update Guide | Troubleshooting | FAQ | All Products ] Easy to use Manual anchoring is not needed Perfect for price confluence studies The indicator evaluates if retracements or extensions are needed Once drawn, you can manually
FREE

Auto ZZ SR Indicator
This indicator automatically draws trend lines using ZigZag top and bottom points. The more ZigZag tops/bottoms that are used, the greater the number of possible combinations. Therefore, the more possible trend lines can be drawn. And vice versa too. The fewer ZigZag tops/bottoms that are used, the lower the number of possible combinations. And therefore, the fewer the possible trend lines can be drawn. The indicator constantly updates the trend lines on the chart as the mar
FREE
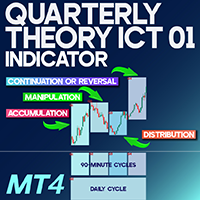
Quarterly Theory ICT 01 Indicator MT4 The Quarterly Theory ICT 01 Indicator MT4 is a professional analytical tool designed on ICT methodology and fractal-based time segmentation. By dividing any chosen timeframe into four quarters (Q1–Q4), this indicator enhances traders’ precision in detecting optimal entry and exit levels. It also includes a clear visual table that displays complementary data about the selected trading periods. «Indicator Installation & User Guide» MT4 Indicator Installation
FREE

Precision Trading with Advanced Market Analysis! Gain an edge in forex trading with a comprehensive analysis suite that helps you categorize volatility, estimate swing lengths, and make data-driven decisions based on historical market behavior. Key Features: Advanced Swing Detection
Customize sensitivity to price movements by defining minimum bars and price shifts required for a new swing.
Tailor it to your trading style for precise trend identification. Volatility Analysis
FREE
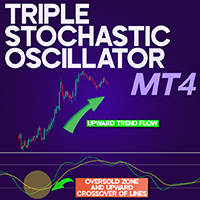
Triple Stochastic Oscillator for MT4 The Triple Stochastic Oscillator for MT4 applies three consecutive smoothing phases to filter out unwanted market noise and highlight the genuine direction of price action. In addition to clarifying price movement, this technical tool also measures the strength of the prevailing trend and identifies overbought or oversold market conditions. «Indicator Installation & User Guide» MT4 Indicator Installation | Triple Stochastic Oscillator MT5 | ALL Products B
FREE
MetaTrader 마켓 - 거래자를 위한 로봇 및 기술 지표는 거래 터미널에서 바로 사용할 수 있습니다.
The MQL5.community 결제 시스템은 MQL5.com 사이트의 모든 등록된 사용자가 MetaTrader 서비스에서 트랜잭션을 수행할 수 있습니다. 여러분께서는 WebMoney, 페이팔, 또는 은행 카드를 통해 자금을 예치하거나 인출하실 수 있습니다.
트레이딩 기회를 놓치고 있어요:
- 무료 트레이딩 앱
- 복사용 8,000 이상의 시그널
- 금융 시장 개척을 위한 경제 뉴스
등록
로그인
계정이 없으시면, 가입하십시오
MQL5.com 웹사이트에 로그인을 하기 위해 쿠키를 허용하십시오.
브라우저에서 필요한 설정을 활성화하시지 않으면, 로그인할 수 없습니다.