Support and resistance levels
- 지표
-
Alexandr Bryzgalov
 I develop trading robots according to your algorithm.
Contacts:
telegram: https://t.me/bryzgalov_av
e-mail: sn-bot@yandex.ru - 버전: 3.1
- 업데이트됨: 19 9월 2021
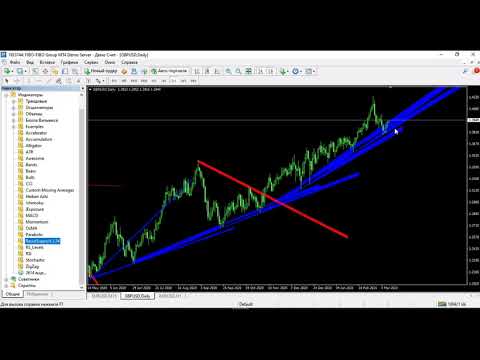
The indicator displays the probable (Support and resistance) levels.
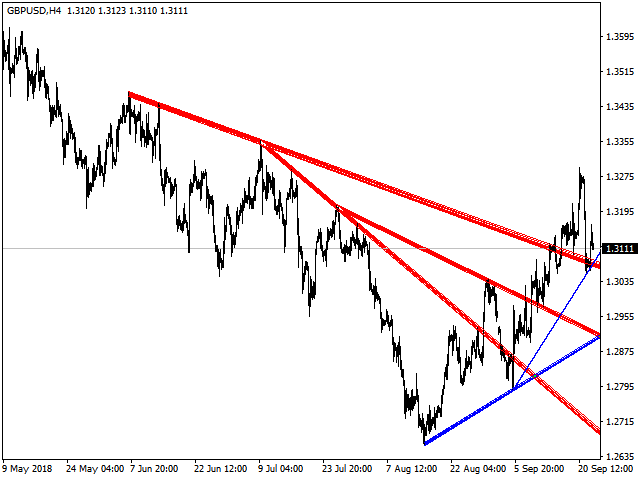
The indicator draws horizontal and trend levels of support and resistance.
The indicator settings:
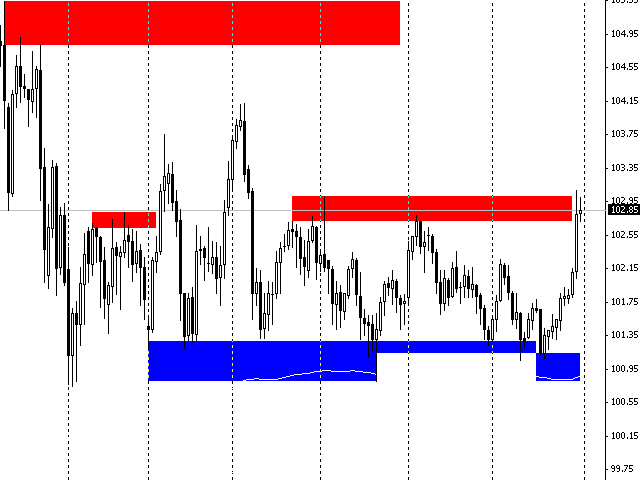
- Trends - the mode for displaying trend lines or horizontal lines of support and resistance
- Yes - display trend lines only
- No - display horizontal lines only
- UseResource - use the resources built into the indicator.
- Yes - use the ZigZag indicator from the resources of the product.
- No - use a custom ZigZag indicator.
- HistoryBar - the number of bars in history for displaying the levels
- CountBar - the number of bars starting from the current to search for the support and resistance levels
- Settings of the ZigZag indicator used in the product:
- Depth — the minimum number of candlestick, for which Zigzag will not draw the second maximum (or minimum), if the last one is Deviation less (or greater) than the previous one;
- Deviation — the minimum number of points between the Highs/Lows of two adjacent candlesticks for the Zigzag to form a local top/bottom;
- Backstep — the minimum number of candlesticks between the local Highs/Lows.


Very good system. I use it to trade BTC. Gives me great results.