당사 팬 페이지에 가입하십시오
- 조회수:
- 10260
- 평가:
- 게시됨:
- 업데이트됨:
-
이 코드를 기반으로 한 로봇이나 지표가 필요하신가요? 프리랜스로 주문하세요 프리랜스로 이동
The script displays the ratio between the sum at the end of the period and the current sum, i.e. how many times it is increased/decreased.
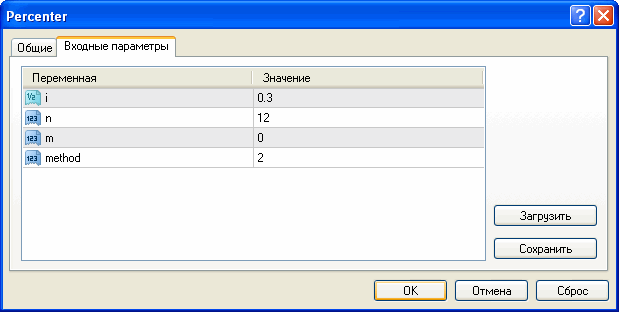
The properties window will appear as soon as you launch it:

In this example we specify: i=0.3 (i.e. 30%), n=12 (the number of periods of charging), method=2 - on default, and we don't specify anything in the m field (it is used only when calculating the nominal interest rates).
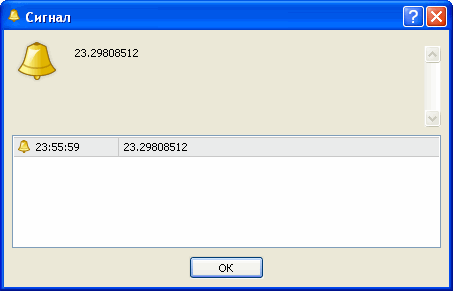
The result:

I.e. if the interest rate is equal to 30% a month and charging is performed by the complex interset rate, then the deposit will be increased more than 23 times after a year.
You can read the additional information about the rates here: https://en.wikipedia.org/wiki/Interest_rate.
MetaQuotes Ltd에서 러시아어로 번역함.
원본 코드: https://www.mql5.com/ru/code/8554
 Standard OsMA indicator
Standard OsMA indicator with the indication of the possible trade signals.
 ind_HotKeys_v1
An example of automatic running of the script when the timeframe or symbol is changed.
 MultiZigZag - Another Variant of ZigZag (Economic ZigZag)
This version of ZigZag can simultaneously display three zigzags both drawn on the data from the current timeframe and on the data from the larger timeframes.
 Indicators Based on the MUV Described by Sator
The MUV indicator created by Sator is used.