당사 팬 페이지에 가입하십시오
- 조회수:
- 40384
- 평가:
- 게시됨:
- 업데이트됨:
-
이 코드를 기반으로 한 로봇이나 지표가 필요하신가요? 프리랜스로 주문하세요 프리랜스로 이동
As a rule it takes a lot of time to switch between periods and indicator parameters for comparing their behavior and detecting a true indicator development dynamics.
The indicator was developed after the working area was filled by a set of standard indicators with different parameters.
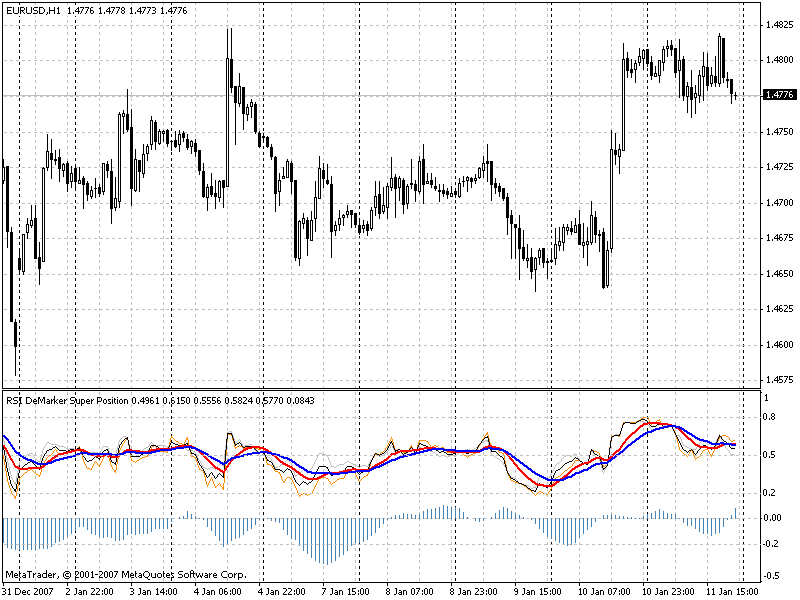
What is calculated:
- four RSI lines with different periods (the period change step is specified in the indicator parameters) constitute a weighted average of the indicator upon RSI;
- four DeMarker lines with different periods (the period change step is specified in the indicator parameters) constitute a weighted average of the indicator upon DeMarker;
- because of the difference of RSI and DeMarker dimensions, the values of averages are reduced to a common way of displaying;
- the moving average upon RSI and DeMarker constitute a super position upon two indicators;
- two MA lines are attached to the super position line for an easier interpretation of values;
- for a better visualization, a histogram of difference between RSI and DeMarker weighted averages is shown.
The result is: one indicator contains two values of different periods and different dynamics.
RSI and DeMarker behave differently not only in different situations on a chart, abut also towards themselves with different indicator periods. I think, it is useful to see this difference.
In addition to this, a smoothing of the superposition line can be introduced.

MetaQuotes Ltd에서 러시아어로 번역함.
원본 코드: https://www.mql5.com/ru/code/7741
 Impulse MACD
Impulse MACD. The method of its construction is not traditional. This indicator is the result of laziness and absence of a working area on a chart.
 Equivolume Bars Builder
Another version.
 3_Level_ZZ_Semafor
This indicator places semaphore points on the maximum and minimum of a higher, medium and lower period. Similar to Advanced Get, but without waves numeration.
 DeMark Trendline Trader
DeMark Trendline Trader indicator.