거래 로봇을 무료로 다운로드 하는 법을 시청해보세요
당사를 Telegram에서 찾아주십시오!
당사 팬 페이지에 가입하십시오
당사 팬 페이지에 가입하십시오
스크립트가 마음에 드시나요? MetaTrader 5 터미널에서 시도해보십시오
- 조회수:
- 26025
- 평가:
- 게시됨:
- 업데이트됨:
-
이 코드를 기반으로 한 로봇이나 지표가 필요하신가요? 프리랜스로 주문하세요 프리랜스로 이동
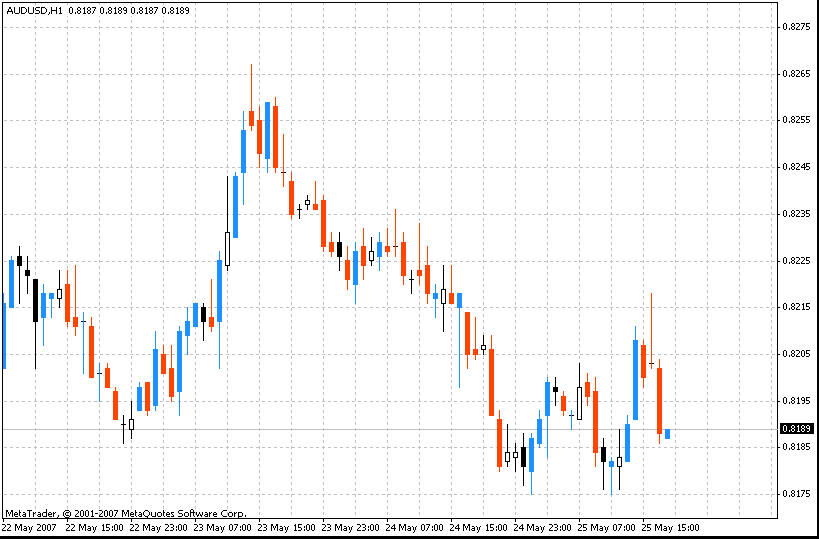
The difference between the high and low of a candle divides into three parts each one corresponding 1/3 of the candle. The indicator calculates where the candle opened and where it closed. It is recommended to hide the initial chart by setting the following parameters: option "Chart on foreground" unchecked (menu "Charts"-> "Properties" or press F8, tab "Common").
Bullish Pattern:
1-1
2-1
3-1
Bearish Pattern:
1-3
2-3
3-3

 i-HighLow
i-HighLow indicator draws the channel with borders correspond to highest high and lowest low values of the bar's shadows for the last N bars.
 i-Breakeven
i-Breakeven groups the open position by symbol and for the each of group shows: 1. The current equity level. 2. The estimated breakeven level.
 i-5days
5days indicator marks the first bar of each new day.
 FX5_Divergence
This indicator will detect divergence between the price and OsMA indicator. It will give buy or sell signal according to the type of divergence that was detected.