당사 팬 페이지에 가입하십시오
- 조회수:
- 8590
- 평가:
- 게시됨:
- 업데이트됨:
-
이 코드를 기반으로 한 로봇이나 지표가 필요하신가요? 프리랜스로 주문하세요 프리랜스로 이동
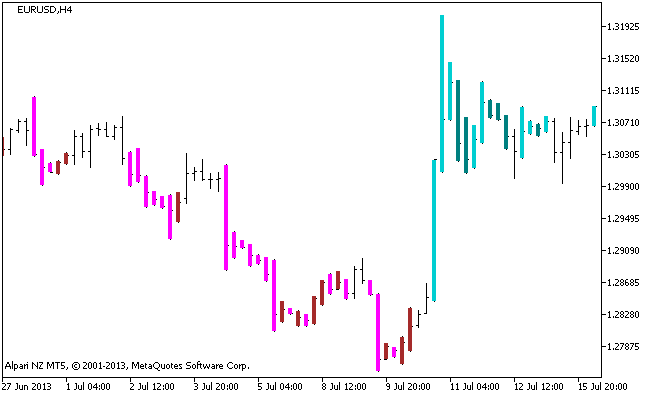
The indicator changes the bar color to the color of the current trend calculated based on the RSI technical indicator.
If the trend and candlestick direction match, the color of the bar is light, if opposite, the bar is dark.
Trend strength is determined by the presence of the RSI indicator in overbought or oversold areas whose levels are determined by the indicator input parameters:
input uint   HighLevel=55;   // Overbought level
input uint   LowLevel=45;    // Oversold level
If the RSI is outside these areas, the bar is not painted.

Figure 1. The RSI_BARS indicator
MetaQuotes Ltd에서 러시아어로 번역함.
원본 코드: https://www.mql5.com/ru/code/2122
 Heiken_Ashi_BARS
The indicator uses analysis of values of Heiken Ashi Open and Heiken Ashi Close.
 TTM-Trend
The indicator uses analysis of values of Heiken Ashi Open and Heiken Ashi Close for a selected period.
 Background_Heiken_Ashi_Сandle_HTF
The indicator draws Heiken Ashi candlesticks of a higher timeframe as color filled rectangles using DRAW_FILLING buffers.
 Background_Candles_Smoothed_HTF
The indicator draws averaged candlesticks of a higher timeframe as color filled rectangles using DRAW_FILLING buffers.