거래 로봇을 무료로 다운로드 하는 법을 시청해보세요
당사를 Telegram에서 찾아주십시오!
당사 팬 페이지에 가입하십시오
당사 팬 페이지에 가입하십시오
스크립트가 마음에 드시나요? MetaTrader 5 터미널에서 시도해보십시오
- 조회수:
- 25521
- 평가:
- 게시됨:
- 업데이트됨:
-
이 코드를 기반으로 한 로봇이나 지표가 필요하신가요? 프리랜스로 주문하세요 프리랜스로 이동
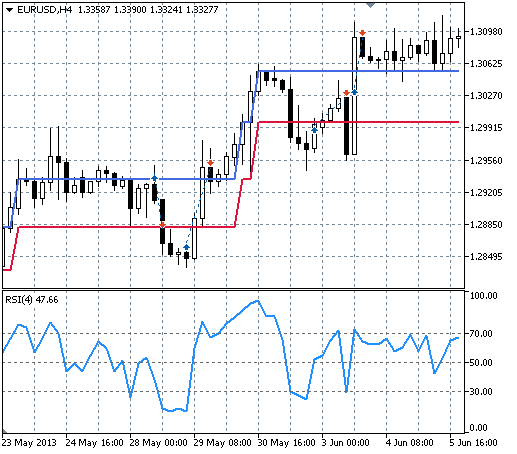
The idea is quite simple - Renko Line Break determines the direction of the trend, and then, on the rollback of the trend place a stop order based on the signal of RSI. Here is an example:
- Renko Line Break tells you that you are in an uptrend;
- if the RSI moves down into the oversold area, place a buy stop above the bar maximum. A stop loss a few pips below the lowest minimum of the last three bars, and a take profit in accordance with the parameter set by a trader;
- if the order does not trigger, and on the next bar RSI is still in oversold, delete the previous order and place a new order;
- if the the buy stop triggers, the position will be closed either by a stop loss, or on a trend reversal detected by Renko Line Break, or by a take profit, or if the RSI enters the overbought area;
- if the buy stop does not work and Renko Line Break changes the trend direction, then delete the order.
Set up:
- Download the Renko Line Break indicator into the folder MetaTrader 5\MQL5\Indicators;
- download the EA file to MetaTrader 5\MQL5\Experts.
Parameters:
- Min Box Size - the minimum size of the indicator box;
- RSI Period - the period of RSI;
- RSI Vertical Shift - a vertical shift of the overbought/oversold areas. Added/subtracted from 50. For example, if the parameter is 20, the overbought area is above 70 and the oversold area is below 30. If the parameter is 30, the overbought area is above 80 and the oversold area is below 20;
- Take Profit - the value of take profit;
- Indent From High/Low - Distance from the bar extremes for placing stop orders and stop losses;
- Volume - position volume in lots.
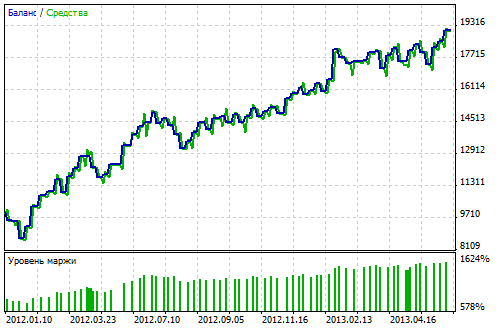
A test example on EURUSD H4 from January 2012 (in the attached file).
a) Example of trades:

b) Test chart:

MetaQuotes Ltd에서 러시아어로 번역함.
원본 코드: https://www.mql5.com/ru/code/1772
 RoundLevels
The RoundLevels indicator draws two closest "round" levels above the current price and two more below it
 DeMarker_HTF
DeMark's oscillator with an option of setting a fixed timeframe for the calculation of the indicator in the input parameters.
 FiboPivot_V2
A pivot with Fibo levels on the basis of daily candlesticks
 TrendChannel
The indicator draws two trend lines for the closest price extremes
