당사 팬 페이지에 가입하십시오
- 조회수:
- 11192
- 평가:
- 게시됨:
-
이 코드를 기반으로 한 로봇이나 지표가 필요하신가요? 프리랜스로 주문하세요 프리랜스로 이동
In many cases, when static Stop Loss and Take Profit are not enough, because it is unknown how long the trend will last, but the trend and the nature of price change are known. A simple trailing stop is not always suitable, since it does not take into account the nature of future price changes.
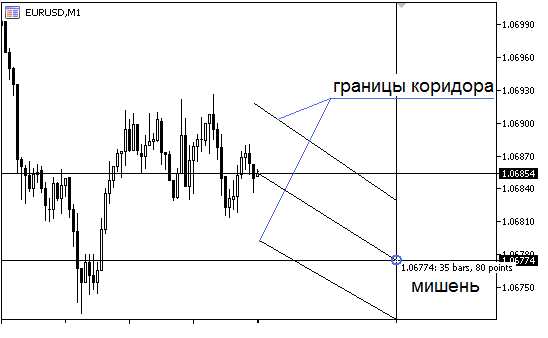
If a linear price growth is expected, we need to trail a position along a price channel limited by two straight lines. The position should be trailed as long as the trend exists. Once the price moves outside the channel, it is necessary to close the position, since the current trend is over. The Expert Advisor moves Stop Loss and Tale Profit at each bar, along the trend line that is drawn with a certain slope. In this case, at each new bar, stop orders will be placed at the borders of the channel.
In order to be able to determine the trend line and its angle, we need to set a target using two coordinates - a shift from the current position, which is set as the number of bars, and the change relative to the current price in pips. Then the EA determines the trend line is a straight line passing through the target and the current coordinate, finds the channel borders and starts to trail the position.

In some situations a sharp exponential price growth is expected. In this case, we need to select the appropriate curve to trail and set the target. The EA will determine the trailing curve, which starts at the current coordinate and passes through the target. After this, Stop Loss and Take Profit are moved along a particular exponent. In this case, stop orders are first moved relatively slowly, but as you get closer to the target and further, the speed increases.
In cases where price growth rates with saturation is expected, it is better to use a curve like y=xˆ1/2 (a power function) as the trailing curve. Any curve of form y=xˆn can be used, and the exponent may be greater or less than one, as well as negative. The method for setting the trailing curve is the same. For the y=xˆ1/2 curve, Stop Loss and Take Profit are moved fast from the beginning, but as you get closer to the target and further, the speed drops.
The EA also provides an option to close a position after n bars.
Please note that The Expert Advisor does not open positions or place Stop Loss and Take Profit. It only trails open positions by moving initial stop orders.
Parameters
- target_bar - shift relative to the current coordinate in bars;
- delta_points - price change relative to the current price, in pips;
- type - trailing curve: linear, exponential, power (parabolic);
- exponent - exponent for the power function;
- e - the base of the exponential curve (e=2.718);
- tp_escort - move the Take Profit of a position;
- close_bar - close positions after bars.
MetaQuotes Ltd에서 러시아어로 번역함.
원본 코드: https://www.mql5.com/ru/code/17539
 Modified Standard Deviation.mq5
This is a standard StdDev indicator with an additional feature, which changes the line color depending on its values. When the value increases, the line color is painted in green; when it falls, the line becomes red; if values stay the same over several periods, the line color stays yellow.
 MFICandleKeltner
A Keltner Channel drawn relative to the average value of the MFI oscillator as a sequence of candlesticks
 MFI_price_HTF
The MFI_price indicator with the timeframe selection option available in the input parameters.
 NRTR_ZigZag_HTF
The NRTR_ZigZag indicator with the timeframe selection option available in the input parameters.
