당사 팬 페이지에 가입하십시오

TF Adaptive Moving Average - MetaTrader 5용 지표

- 조회수:
- 11507
- 평가:
- 게시됨:
-
 이 코드를 기반으로 한 로봇이나 지표가 필요하신가요? 프리랜스로 주문하세요
프리랜스로 이동
이 코드를 기반으로 한 로봇이나 지표가 필요하신가요? 프리랜스로 주문하세요
프리랜스로 이동
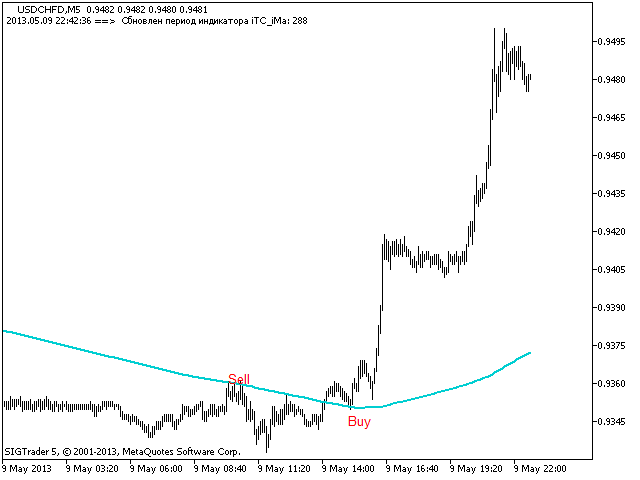
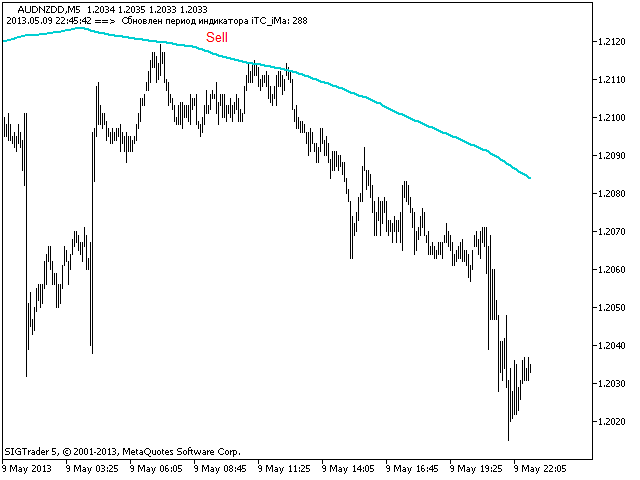
Any change of a time frame is accompanied by automatic recalculation of the MA period. If the trader opens a MN1 chart, the indicator automatically sets the MA period to 12 to compare the current price to its average value for a year based on the count of periods (bars) in the year. If the trader opens a one-week chart, the simple moving average line is automatically set to period 52, which is equal to the number of weekly bars in the year.
When opening a one day chart, the MA line is recalculated based on the number of trading days (displayed candlesticks) for a month with the five or six bar daily candlesticks. All periods smaller than one day up to 1 hour are recalculated relative to weeks, and periods of less than an hour - relative to daily bars displayed on the chart. Sample SMA calculation for a 5-minute chart. A daily trading period on the charts for currency pairs consists of 1,440 minutes. Therefore, 1440 minutes / 5 minutes = 288 MA period. A CFD session lasts 6 hours. ( 6 * 60 = 360 / 5 = 72 – MA period. If the session lasts 8 hours, the calculation would be 8 * 60 = 480 / 5 = 96 MA period.
With the indicator the trader doesn't need to select MA periods for different time frames.
Interpretation of the indicator is as follows. If the current price of the selected time frame is above the average price of the instrument, you should buy. If the current price for the selected time frame is below the average price of the instrument, you should sell.
It has been noticed that good market entering points are at the moments when the price first crosses the price MA line and then re-approaches it and forms a reversal candlestick pattern or a combination towards the main price movement direction in the selected time frame. Or when it breaks a formed high (low) price after the price crosses the adaptive MA. The Stop Loss is set to the oppositely directed extremum. Easy to understand and easy to use, a very accurate indicator.
MetaQuotes Ltd에서 러시아어로 번역함.
원본 코드: https://www.mql5.com/ru/code/1703
MACDonRSI
The MACD histogram drawn on the basis of the RSI smoothed oscillator
Normalized_Volume_Oscillator
Extended version of the normalized volume indicator. Added tools that simplify the visual analysis of the indicator values
prusax
The indicator paints the part of the bar depending on the direction of the candlestick
SignalTable
The original indicator that shows buy and sell signals of three indicators on nine timeframes