당사 팬 페이지에 가입하십시오

T3 Velocity on Chart - MetaTrader 5용 지표

- 조회수:
- 8539
- 평가:
- 게시됨:
-
 이 코드를 기반으로 한 로봇이나 지표가 필요하신가요? 프리랜스로 주문하세요
프리랜스로 이동
이 코드를 기반으로 한 로봇이나 지표가 필요하신가요? 프리랜스로 주문하세요
프리랜스로 이동
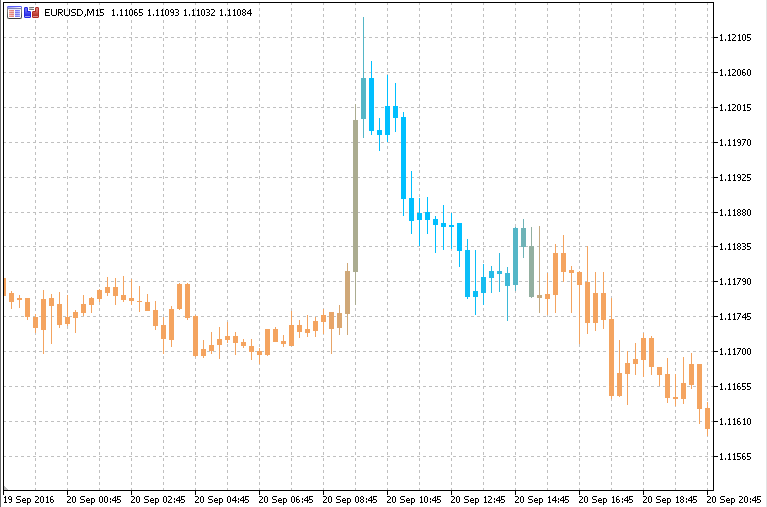
T3 velocity, now on chart version too.
Be careful, because of the gradient colors, the velocity in the sub-window should be closely monitored too otherwise you can get a wrong impression, but I wanted to make this one so that we can have a sort of "all T3 velocity chart" sort of speaking.
Also, this indicator shows how misleading some simplifications (like the color change, the trend changed) can be and that we always have to have the value of the indicator (past values included) in front of our eyes in order to draw a proper conclusion
T3 Velocity V.2.0
T3 velocity is a completely new indicator that uses T3 to calculate velocity.
Rapid RSI T3 Prefiltered
Upgraded adaptive rapid rsi (stand deviations adaptive) using t3 filtered prices.
RSI Experiment
This version of RSI is "experimenting" with different ways how internally the RSI is calculated.
RSI Experiment with Floating Levels
RSI experiment with floating levels.