당사 팬 페이지에 가입하십시오

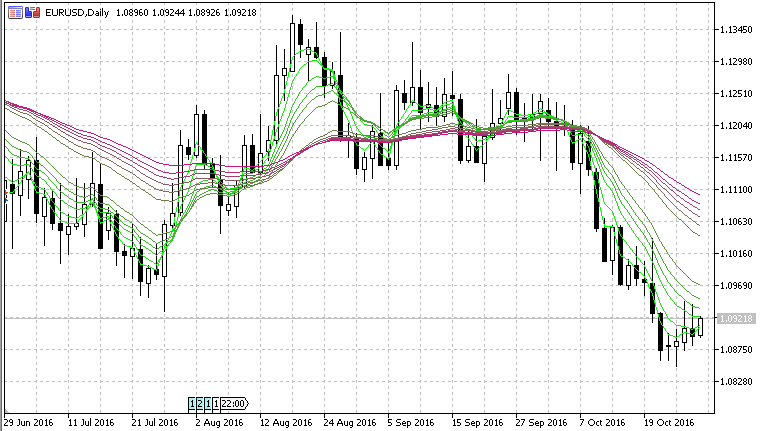
Guppy MMA - MetaTrader 5용 지표

- 조회수:
- 22258
- 평가:
- 게시됨:
- 업데이트됨:
-
 이 코드를 기반으로 한 로봇이나 지표가 필요하신가요? 프리랜스로 주문하세요
프리랜스로 이동
이 코드를 기반으로 한 로봇이나 지표가 필요하신가요? 프리랜스로 주문하세요
프리랜스로 이동
It is made more up-to-date and multi time frame option added. Even
though the original is based on EMA, we have an option chose which
average type to use.
The original description (along with the rules) is this :
GUPPY MULTIPLE MOVING AVERAGE ™
This indicator was developed by Daryl Guppy. It is fully explained in TREND TRADING. Captures the inferred behaviour of traders and investors by using two groups of averages. Uses fractal repetition to identify points of agreement and disagreement which precede significant trend changes.
APPLICATION
Applied to understand the nature and character of the trend. Used to assess the degree and extent of trading activity. Excessive trading activity can destabilise strong trends. Trend analysis enables more effective selection of appropriate trading strategies such as breakout, trend continuation etc. Can be applied to long side and short side trading. Can be applied to intraday trading. Also used for longer term investment style analysis.
TACTICS
-
Join established trends at points of price weakness
-
Join established trends breaking to new highs
-
Trade breakouts using rally dips and rebounds
-
Trade downtrend rallies as rallies rather than trend breaks
-
Recognise trend breaks as they develop
RULES
-
Degree and nature of separation in the long term group define trend strength and weakness
-
Degree and nature of separation in the short term group define the nature of trading activity.
-
Degree and nature of separation between the two groups of moving averages define the character of the trend.
-
Compression shows agreement on price and value.
-
Compression of both groups at the same time indicate major re-evaluation of stock and potential for a trend change
-
Trade in the direction of the long term group of averages
-
The relationships between the groups provide the necessary information about the nature and character of the trend.
-
Do not use as a moving average crossover tool
ADVANTAGES
-
Enables effective analysis of the trend environment
-
Improves selection of the appropriate trading tactics
-
Better understanding of trend strength
-
Effective evaluation of unusual price movements, such as dips and spikes
-
Effective understanding of trading activity and behavior
DISADVANTAGES
-
Not effectively applied to trend less stocks
-
Cannot be applied to all trending stocks
-
Do not use as a moving average crossover signal
Coloring for the intermediate values is done automatically, so the actual number of parameters is small, and the indicator should be easy to use.
Round Price
A variation on the T3 theme that was made as a sort of envelopes using T3 for basic value.
Pivot Points
Pivot Point indicator with an addition of 4 ways of calculating pivot points.
Double Stochastic
A stochastic indicator with a twist: it is calculating a stochastic, and then a stochastic of that stochastic.
Highs-Lows
A simple indicator that shows the high and the low of desired time frame on a current chart.