당사 팬 페이지에 가입하십시오
- 조회수:
- 3102
- 평가:
- 게시됨:
- 업데이트됨:
-
이 코드를 기반으로 한 로봇이나 지표가 필요하신가요? 프리랜스로 주문하세요 프리랜스로 이동
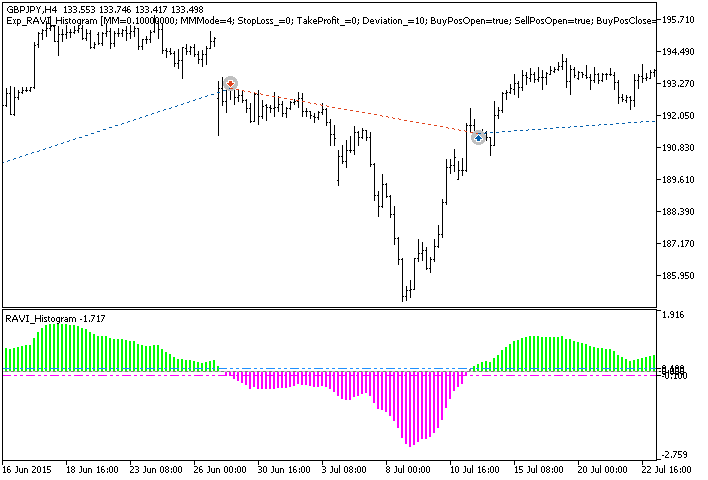
The Exp_RAVI_Histogram breakout trading system based on the signals of the RAVI_Histogram oscillator. The signal is formed when a bar is closing, if the indicator breaks through the overbought level form below or the oversold level from above.
This Expert Advisor requires the compiled indicator file RAVI_Histogram.ex5 in order to run. Place it to <terminal_data_folder>\MQL5\Indicators.
Note that the TradeAlgorithms.mqh library file allows using Expert Advisors with brokers who offer nonzero spread and the option of setting Stop Loss and Take Profit together with position opening. You can download more variants of the library at the following link: Trade Algorithms.
Default Expert Advisor's input parameters have been used during the tests shown below. Stop Loss and Take Profit have not been used during the tests.

Fig. 1. The instances of history of deals on the chart.
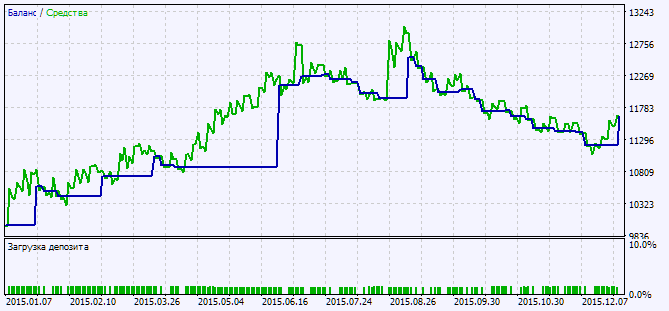
Testing results for 2015 on GBPJPY H4:

Fig. 2. Testing results chart
MetaQuotes Ltd에서 러시아어로 번역함.
원본 코드: https://www.mql5.com/ru/code/16100
 FloatPivot
Another alternative to the Bollinger Bands® channel with colored inner area of the channel.
 RAVI_Histogram_HTF
The RAVI_Histogram indicator with the timeframe selection option available in input parameters.
 BalanceOfPower_Histogram
The Balance of Power (BOP) indicator as a color histogram of strength and direction of the current trend.
 PPO_SignAlert
Semaphore signal indicator based on the relative smoothed rate of price change, which features alerts, sending emails and push-notifications to mobile devices.
