당사 팬 페이지에 가입하십시오
- 조회수:
- 10216
- 평가:
- 게시됨:
- 업데이트됨:
-
 이 코드를 기반으로 한 로봇이나 지표가 필요하신가요? 프리랜스로 주문하세요
프리랜스로 이동
이 코드를 기반으로 한 로봇이나 지표가 필요하신가요? 프리랜스로 주문하세요
프리랜스로 이동
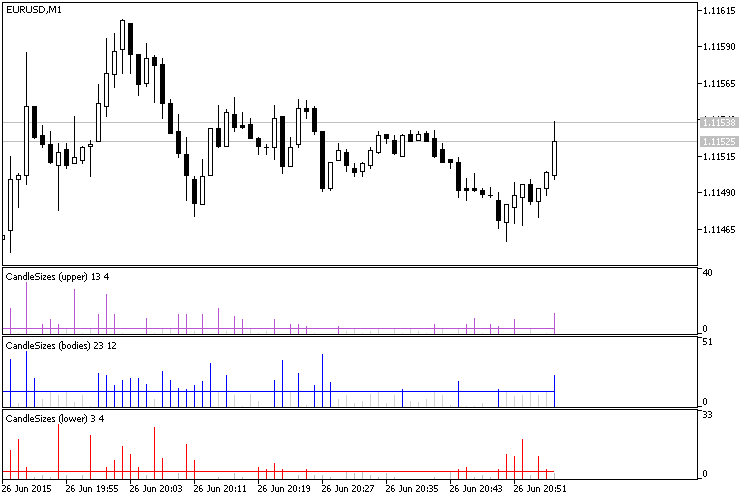
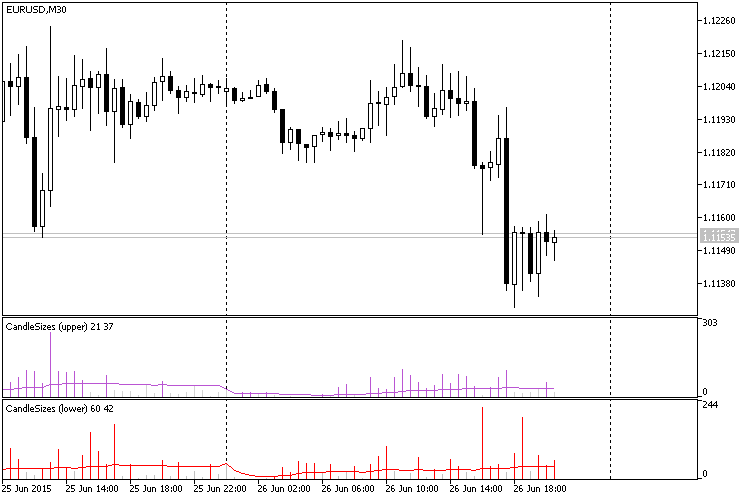
The indicator shows the size of candlestick elements. One histogram bar corresponds to a certain element size on a current candlestick, the histogram line indicates the daily average value of selected elements. A histogram bar changes its color to the color of the line if the element size exceeds the daily average.
Input Parameters:
- inpType — display type (show the size of upper shadows, lower shadows or bodies);
- inpClr — histogram color (if the element size exceeds the daily average);
- inpNeutralClr — neutral color, if the element size doesn't exceed the daily average.
Tips:
- Analyze the values of upper shadows after an uptrend movement, and the values of lower shadows — after a downtrend movement (trend reversal).
- It can be used as a confirming signal to determine important price levels (instead of a candlestick patterns indicator).
- It can be used as a basis for developing candlestick indicators.
- The indicator can work on timeframes up to Н2.
MetaQuotes Ltd에서 러시아어로 번역함.
원본 코드: https://www.mql5.com/ru/code/13329
 ColorZerolagMomentumOSMACandle
The ColorZerolagMomentumOSMA indicator implemented as a sequence of candlesticks.
ColorZerolagMomentumOSMA_HTF
The ColorZerolagMomentumOSMA indicator with the timeframe selection option available in the input parameters.
FractalsNoRedraw
Bill Williams' fractals indicator based on the built-in Fractals indicator. The distinctive feature of this indicator is that it doesn't repaint.
 Exp_ColorZerolagMomentumOSMA
The Exp_ColorZerolagMomentumOSMA Expert Advisor is based on the ColorZerolagMomentumOSMA histogram's change of direction.