당사 팬 페이지에 가입하십시오
- 조회수:
- 16161
- 평가:
- 게시됨:
- 업데이트됨:
-
이 코드를 기반으로 한 로봇이나 지표가 필요하신가요? 프리랜스로 주문하세요 프리랜스로 이동
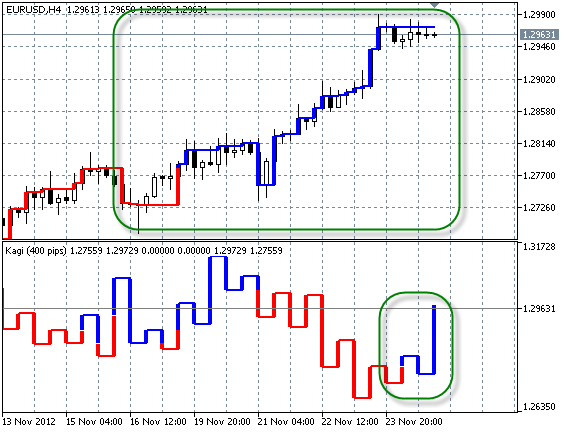
This indicator differs from the standard Kagi chart as it is drawn on a considering timeframe, so the process of forming of "yang" and "yin" lines is exactly traced. In fact, no Moving Averages or periods, and only price movement on a certain distance and breakthrough of the previous local minimums/maximums are used in drawing the Kagi charts. Suggested that the Kagi is not "one more kind of chart", but represents a good alternative to different trend indicators.
Comparison of the KagiOnChart indicator (in the main window) with a standard chart-indicator Kagi (in the subwindow). The analogical area of the indicators is marked in the figure, but in the first case consider time of lines formation, in the second case don't consider it.

Recommendations:
- The very simple principle is to buy when "yang" (blue line), to sell when "yin" (red line).
- After reversal wait for the confirmation in the form of a second vertical line of the same color in direction to a new trend.
- A more detailed description of the Kagi charts and their use can be find in the book by Steve Nison "Beyond Candlesticks".
MetaQuotes Ltd에서 러시아어로 번역함.
원본 코드: https://www.mql5.com/ru/code/1319
 MovingAverage_FN
A Moving Average hybrid of digital and analog filtering.
 ZigZag On Heikin Ashi
The ZigZag drawn using Heikin Ashi extremums
 RFractals
Fractals with the ability to set range
 Exp_MovingAverage_FN
The Expert Advisor is drawn on the basis of changing the direction of the MovingAverage_FN (digital hybrid and analog filtering indicator).