당사 팬 페이지에 가입하십시오
- 조회수:
- 11898
- 평가:
- 게시됨:
- 업데이트됨:
-
이 코드를 기반으로 한 로봇이나 지표가 필요하신가요? 프리랜스로 주문하세요 프리랜스로 이동
As an intraday trader with two years of experience, I know how important it is to accurately predict price movement within a day. Incorrect prediction of intraday price direction may produce very sad results, even when using a good money or risk management system. And what if you had several such days in a row? This may become a psychological issue putting high pressure on a trader. During the development of my trading system I had to invent methods to overcome such problem. And here I want to share my most interesting idea.
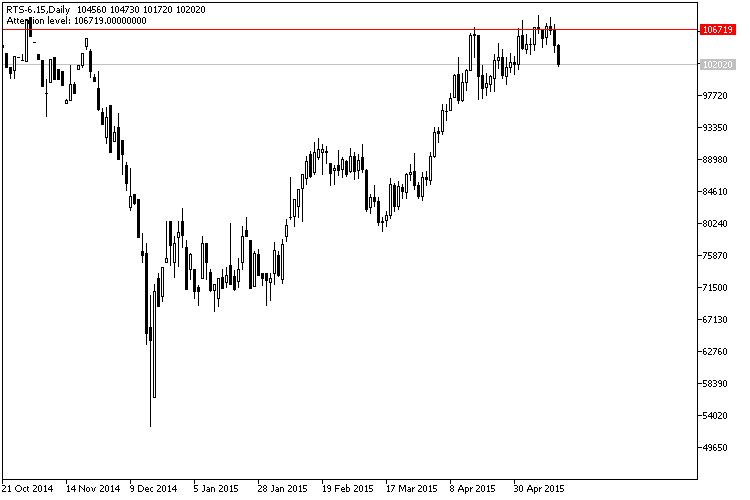
I present you a simple indicator which places a horizontal level on a chart. I would call it an attention level. So, what is this level and how it is calculated? It's all very simple — I take a 10-day value of the ATR indicator, on a daily interval, of course, and if the previous day of the symbol I trade was growing, I subtract this ATR value from its maximum price. If the day was falling, then I add the ATR value to its minimum price. Then I draw a horizontal level through one of these values.
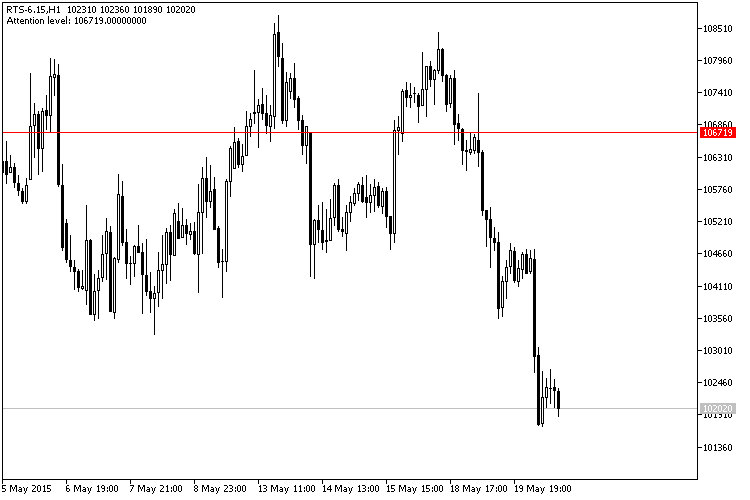
If I trade by an uptrend, and the price falls below the attention level, I stop all trade operations, because it's obvious that the market situation has changed and doesn't match the original trade plan. I don't have to lose money buying on a probably reversed trend or during its correction period.
This simple idea has saved me a lot of money on stop orders which would trigger if I didn't use this indicator.

Fig.1. Daily chart of the RTS index futures contract and the attention level

Fig.2. H1 chart of the RTS index futures contract and the attention level
The code itself is very simple, I used the CList and CObjectHLine classes from the Standard Library to quickly create and manage graphical objects.
Tips:
- If you predicted an uptrend, and the price has passed the attention level in the reverse direction, you should stop trading and revise your trade plan, and also refrain from further buying.
- If you predicted a downtrend, and the price has passed the attention level in the reverse direction, you should stop trading and revise your trading plan, and also refrain from further selling.
Indicator settings:
- ATR_maPeriod — averaging period of ATR indicator (by default, 10 days).
- LevelColor — level line color (by default, red).
- LevelStyle — level line style (by default, solid).
- LevelWidth — level line thickness (by default, 1).
MetaQuotes Ltd에서 러시아어로 번역함.
원본 코드: https://www.mql5.com/ru/code/13008
 Chande_Kroll_Stop_v1_Sign
Semaphore signal indicator based on the Chande_Kroll_Stop_v1 indicator algorithm.
 Chande_Kroll_Stop_v1_HTF
The Chande_Kroll_Stop_v1 indicator with the timeframe selection option available in the input parameters.
 BullsBearsEyesTrend_x10
The BullsBearsEyesTrend_x10 indicator shows the BullsBearsEyes oscillator position from ten different timeframes.
 MultiBullsBearsEyesTrend_x10
The MultiBullsBearsEyesTrend_x10 indicator shows information on current trends using the BullsBearsEyes oscillator position from ten different timeframes.