당사 팬 페이지에 가입하십시오

The IndMATEMA indicator based on crossing of two MA and two TEMA - MetaTrader 5용 지표

- 조회수:
- 9713
- 평가:
- 게시됨:
- 업데이트됨:
-
 이 코드를 기반으로 한 로봇이나 지표가 필요하신가요? 프리랜스로 주문하세요
프리랜스로 이동
이 코드를 기반으로 한 로봇이나 지표가 필요하신가요? 프리랜스로 주문하세요
프리랜스로 이동
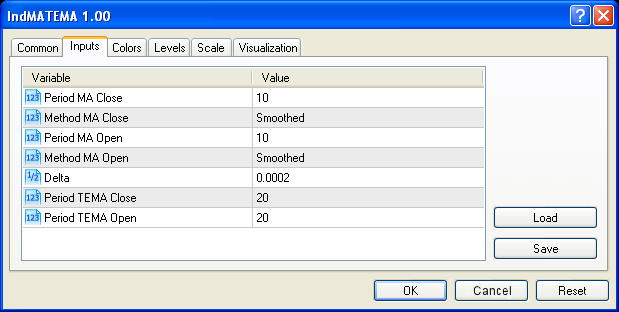
In equal period and grow of prices the average curve (MA and TEMA), drawn on close prices will be the same as the curve drawn on the open prices. When prices fall there is the opposite situation. The combination of two TEMA which are too detailed displaying the movement of prices and two МА not badly displaying the trend presence gives an interesting result.
The indicator is displayed in a separate window as a histogram. Price movement is displayed by color: green is an increase, red is a falling. There is possibility to draw points of entering to the market by another color: blue is for Long positions, and yellow is for Short positions (should be commented in the text of the indicator).

The indicator has delta value that allows to "cut" flat "noise", displaying it by gray color (in non-zero parameter value).
Conclusion:
The idea was to receive signals at one averaging period curves crossing with different types of prices (Open and Close), but the selection of the parameters in the tester for the Expert Advisor using this indicator different periods of averaging gave unexpectedly successful results.
MetaQuotes Ltd에서 러시아어로 번역함.
원본 코드: https://www.mql5.com/ru/code/1289
 Exp_ADX_Smoothed
The trading system based on crossing of the DI+ and DI- lines of the ADX_Smoothed indicator
XMA_Range_Bands_HTF
The XMA_Range_Bands indicator variant which can be placed by fixing timeframe of the indicator on a value different from the chart timeframe.
Exp_AML
Trading system using the AML trend Moving Average
Exp_ColorNonLagDotMACD
The Exp_ColorNonLagDotMACD Expert Advisor drawn on the basis of the signals taken from the ColorNonLagDotMACD histogram