당사 팬 페이지에 가입하십시오

Ind_2 Line+1 - MetaTrader 5용 지표

- 조회수:
- 12217
- 평가:
- 게시됨:
- 업데이트됨:
-
 이 코드를 기반으로 한 로봇이나 지표가 필요하신가요? 프리랜스로 주문하세요
프리랜스로 이동
이 코드를 기반으로 한 로봇이나 지표가 필요하신가요? 프리랜스로 주문하세요
프리랜스로 이동
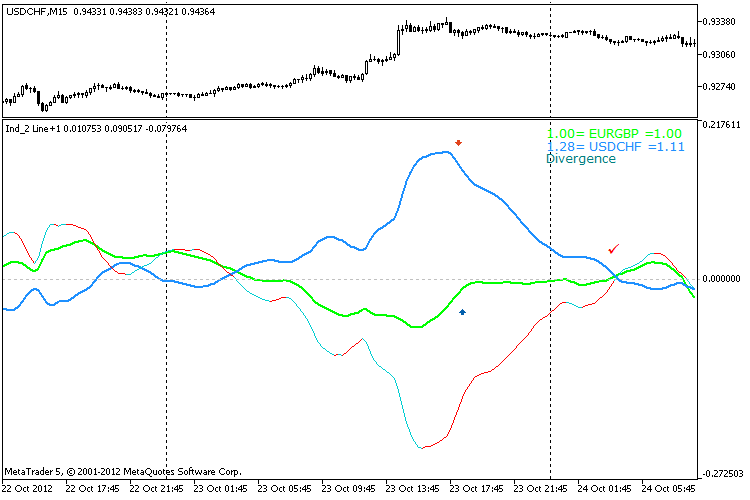
The indicator has three lines:
- Green is an averaging line of the first instrument index;
- Blue is an averaging line of the second instrument index;
- Line of the width of the instruments runaway: sky blue is in divergence, red is in convergence.
If there is a very strong divergence at the moment when the instruments start to converge the upper should be sold and the lower should be bought simultaneously. When instruments' lines crossing, closing position is recommended.
Besides, the indicator calculates deals volume which should be performed to balance instruments volatility. Calculation results display on the upper corner of the indicator. On the left side from the instruments name volumes relative to instruments' price are calculated. For example, shares of VTB24 cost about 5 cents, while Sberbank shares are about 100 rubles. It is clear that their weight should be compared not as 1:1. However, this approach is not suitable for FOREX market. Therefore, the authors proposed a second version of the calculation of lots. It is displayed on the right of the names of the instruments. Such lots were obtained taking into account both assets volatility, contract size, the minimum price change and ticks calculation value.
MoneyManagment.mqh:
The indicator uses include which need to be placed in a relevant folder ...Include\EvgeTrofi\. It is specified for additional properties of the instruments. During MQL5 studying I will expand this library, give a detailed description of its functions and place it in the Code Base. But it will be later.
Good luck!
MetaQuotes Ltd에서 러시아어로 번역함.
원본 코드: https://www.mql5.com/ru/code/1244
AnchoredMomentum
The improved Momentum indicator. The indicator is described by Rudy Stefenel in February'1998 issue in Stock&Commodities
GG-RSI-CCI
The offered indicator informs you about the current trend. It is useful for entering the trading.
AffineTransform
The indicator transfers the price data to the new coordinates system shifting price axis (axis of the ordinates).
2XMA
The MACD histogram drawn using two signal lines in the price chart of the financial asset.