당사 팬 페이지에 가입하십시오
- 조회수:
- 10751
- 평가:
- 게시됨:
- 업데이트됨:
-
이 코드를 기반으로 한 로봇이나 지표가 필요하신가요? 프리랜스로 주문하세요 프리랜스로 이동
For a long time I studied and traded using the Thomas DeMark system, and used the Bill Williams fractals indicator in the trading process.
My experience of trading identified one factor that causes quite poor trading results when building trends based on DeMark pivot points and Williams fractals.
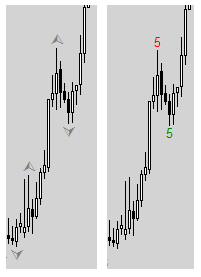
I analyzed such results and identified one significant assumption made by the authors mentioned above. I am talking about building trends using fractals or DeMark pivot points. When determining the dimension of a point or a fractal, both authors put limits on the dimension expressed by the "not less" rule. Williams used the "not less than two bars" rule, DeMark didn't limit the number of bars, but he also used the "not less" rule. To make it clear I'll try to illustrate the difference.

Fig. 1. Key points determined using Williams fractals and their dimensions by DeMark
Let's remove the "not less" limit and count the number of bars to the left and to the right located lower/higher from the key point. The smallest value is the true dimension of the key point.
Fig. 2. True dimensions of the points
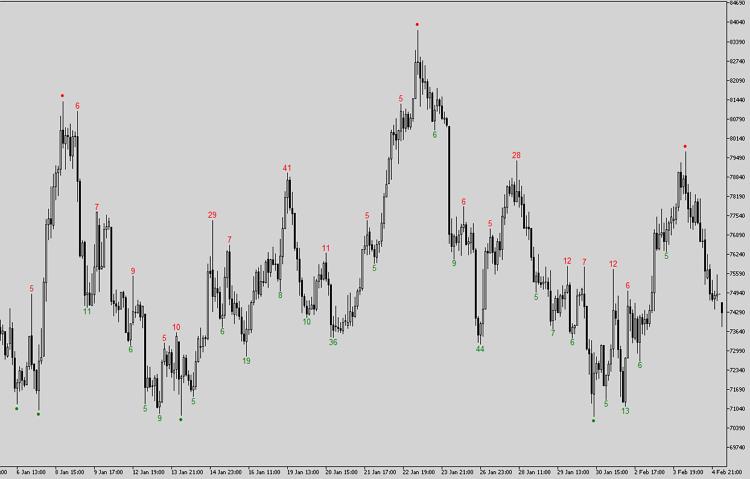
Using this approach we significantly change chart's appearance.

Fig. 3. RTS index futures contract chart
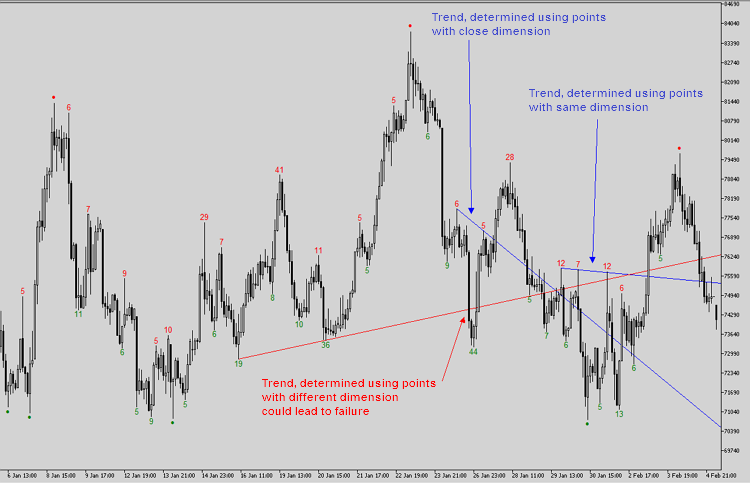
Now it's clear what DeMark meant when he said that trend lines should be built by points with same or close dimensions. Also, building a trend by points with different dimensions gives random results, and this is the reason why failures happen so often.

Fig. 4. Examples of trends
To facilitate the "correct" way of building trends, I wrote a script for the increasingly popular MetaTrader 5 platform. This script displays key points on the chart and shows their dimensions.
It's very easy to build trends with this script. An indicator is on the way!
About the script:
The script has only two adjustable parameters.
- MinDimesion=5; - Minimum dimension allowed for displaying a key point on the chart.
- MaxBars=300; - Maximum number of bars to process; this is the number of bars starting from the current bar that will be processed by the script.
The script uses loops to process the chart, that's why I don't recommend processing more than 1000 bars, as this may lead to a very high processing time. If the script cannot calculate the dimension of a certain point (e.g. because of limiting the number of bars to process), it marks such point with a colored ball.
I will appreciate any feedback, suggestions and comments. Good luck in trading!
MetaQuotes Ltd에서 러시아어로 번역함.
원본 코드: https://www.mql5.com/ru/code/12382
 Ilan 1.6 Dynamic HT
The popular Ilan 1.6 Dynamic belongs to the category of "averagers". Ilan uses advanced money management formulas and allows taking even losing positions to profit. Now Ilan 1.6 Dynamic is available as a source code for MetaTrader 5.
 Fractal ZigZag
This indicator is MQL5 version of FractalZigZagNoRepaint, it displays swing highs and lows.
 KeyLevels
The indicator of price levels with round numbers 00, 20, 50, 80.
 Back to the Future
Fundamental analysis using regulators.
