• 概要
  • レビュー
  • コメント (3)
  • 最新情報

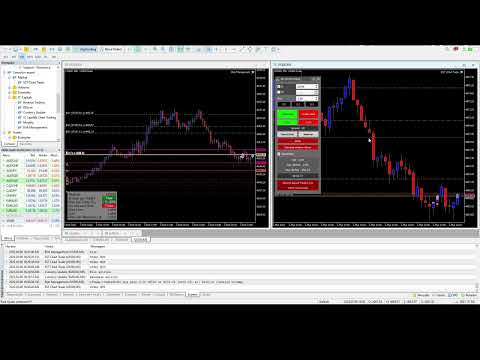
Average Entry Price And Projected Avg Entry Price

Measures the average price and Maximum Stop Loss accepted, adjustable

Measures too the projected average price (For Pending entrys), in case you have a open position and pending orders to scale in shows how much it will increase or decrease the average price after fullfilling that pending orders!

It shows too the Stop Loss based on the projected average entry, how much it has to be stoped out to fullfill your risk management, after fullfilling that pending orders

おすすめのプロダクト
Functional in the Forex market. Functional in the B3 market - Bolsa Brasil Balcão. Motivation The technical Fibonacci retraction indicator for many is essential and the basis for all market movement forecasts. The name of the tool comes from the Italian mathematician Leonardo de Pisa (13th century). This DEMO version will work in Meta Trader with Demo and Strategy Tester. To purchase the Full version that works on a Real account, click on: https://www.mql5.com/en/market/product/38089
FREE
Cybertrade Keltner Channels - MT5 Created by Chester Keltner, this is a volatility indicator used by technical analysis. It is possible to follow the trend of financial asset prices and generate support and resistance patterns. In addition, envelopes are a way of tracking volatility in order to identify opportunities to buy and sell these assets. It works on periods longer than the period visible on the chart. All values ​​are available in the form of buffers to simplify possible automations.
FREE
This indicator sums up the difference between the sells aggression and the buys aggression that occurred in each Candle, graphically plotting the waves of accumulation of the aggression volumes.   Through these waves an exponential average is calculated that indicates the direction of the business flow. Note: This indicator DOES NOT WORK for Brokers and/or Markets WITHOUT the type of aggression (BUY or SELL).   Be sure to try our Professional version with configurable features and alerts:  Agr
FREE
Indicador Regressão Linear – Par de Ativos - INTRADAY Indicador é um oscilador que faz o plot do Resíduo resultado da regressão linear entre os dois ativos inseridos como input do indicador, representado pela fórmula: Y = aX + b + R Onde Y é o valor do ativo dependente, X é o valor do ativo independente, a é a inclinação da reta entre os dois ativos, b é a intersecção da reta e R é o resíduo. O resíduo representa a quantidade da variabilidade que Y que o modelo ajustado não consegue explicar. E
FREE
Donchian Pro
Paulo Henrique Faquineli Garcia
5 (2)
The Donchian Channel Channels are among the most popular tools of technical analysis, as they visually convey to the analyst the limits within which most price movement tends to occur. Channel users know that valuable information can be obtained at any time, whether prices are in the central region of a band or close to one of the border lines. One of the best known techniques to explore these concepts is Bollinger Bands. However, John Bollinger was not the only one to research the applicatio
FREE
Combining the best of Price Action , Directional Movement , and Divergence/Convergence analysis, Candle Color Trend is a easy and reliable way to identify trend direction. The indicator automatically paints the candles according to the assumption that an uptrend is defined by prices that form a series of higher highs and higher lows. In contrast, a downtrend is defined by prices that form a series of lower highs and lower lows. Additionally, ADX Wilder indicator is used to measure trend weakness
FREE
Volume Projection Indicator The Volume Projection Indicator is a specialized tool designed for traders who focus on the relationship between volume and price action. This intuitive indicator projects the expected volume for the ongoing candle, aiding in decision-making during live market conditions. The indicator presents volume data in a histogram format directly on the chart for quick analysis. Features: Bullish Volume Representation : Each green bar in the histogram signifies the volume for a
FREE
Bar Number
Francisco Gomes Da Silva
5 (2)
キャンドルカウンター このインジケーターはキャンドルをカウントし、 より長い時間枠に基づいてキャンドルの画面に数字を表示します 。 長期間 毎日の時間枠を「 BIgger Timeframe 」として選択し、時間枠が短い任意のグラフ内で実行できます。カウンターは 日足チャート に基づいてバーをカウントします。 時間枠「 H1 」をパラメーターとして渡すと、インジケーターはH1チャート内のバーをカウントする方法を認識します。これは、時間枠が短いチャートで実行する必要があります。 主なパラメータは「 大きい時間枠 」です。これは、使用している時間枠よりも長い時間枠であり、キャンドルカウントの基準となります。 番号を表示 このパラメーターに加えて、数字を表示するかどうかを指定するパラメーターがあります。画面の中央に数字を表示する必要はないため、 CTRL+D を押すとカウントを表示できます。 およびインジケーター「 BarIn(時間枠) 」を監視します。 マウス この領域は、画面上で マウスを動かす ときにも非常に便利です。そのため、マウスカーソルが通過している正確なバーを確認できます。画像
FREE
Stackable VWAP
Flavio Javier Jarabeck
3.33 (6)
Volume Weighted Average Price (VWAP) is a trading benchmark commonly used by Big Players that gives the average price a Symbol has traded throughout the day. It is based on both Volume and price. Additionally we put in this indicator the MVWAP (Moving Volume Weighted Average Price). For those who do not know the usage and the importance od this indicator I recommend a great article about this subject at Investopedia ( https://www.investopedia.com/articles/trading/11/trading-with-vwap-mvwap.asp
FREE
This indicator is very useful for day traders or short term traders. (MT5 version) No need to calculate the number of pips manually, just look at the chart and you will see the Virtual Take Profit / Virtual Stop Loss target line and evaluate whether the entry point is feasible to reach the intended target or not. Enter the intended   Take Profit / Stop Loss   pips for your trade. The indicator will display   Virtual Take Profit / Virtual Stop Loss   lines for you to easily see if the target i
FREE
Rainbow MT5
Jamal El Alama
4.33 (3)
Description : Rainbow MT5 is a technical indicator based on Moving Average with period 34 and very easy to use. When price crosses above MA and MA changes color to green, then this is a signal to buy. When price crosses below MA and MA changes color to red, then this is a signal to sell. The Expert advisor ( Rainbow EA MT5 ) based on Rainbow MT5 indicator is now available here . MT4 version is available here .
FREE
すべてのストラテジーをスキャンし、選択したアクティブのすべてのタイムフレームでの買いポイントと売りポイントを表示するスキャナーをお持ちになったことはありますか? それがまさにこのスキャナーが行うことです。このスキャナーは、 Rule Plotter: プログラミング不要のストラテジー作成ツール で作成した買いシグナルと売りシグナルを表示し、さまざまなアクティブとタイムフレームで実行するために設計されています。 Rule Plotterのデフォルトストラテジーは陽線と陰線だけです。つまり、Rule Plotter内に何のストラテジーも描かない場合、このスキャナーは選択したアクティブのすべてのタイムフレームでのキャンドルの色を表示します。キャンドルが陰線の場合は赤で、陽線の場合は緑です。 好きなだけストラテジーを作成 標準のストラテジーに制限されることはありません。Metatraderで利用可能なすべての指標を使用して従来のストラテジーを構築するか、お好きな指標を使用してカスタムストラテジーを構築できます。 このスキャナーはRule Plotterが提供するもののほんの一部であり、Rule
FREE
SUPERTREND; It is a trend following indicator based on the SuperTrend ATR created by Olivier Seban. It can be used to detect changes in trend direction and locate stops. When the price falls below the indicator curve, it turns red and indicates a downtrend. Conversely, when the price moves above the curve, the indicator turns green, indicating an uptrend. Like other indicators, it works well on SuperTrend when used in conjunction with other indicators such as MACD, parabolik SAR, Bollinger Band
FREE
Value Chart Candlesticks
Flavio Javier Jarabeck
4.67 (9)
The idea of a Value Chart indicator was presented in the very good book I read back in 2020 , " Dynamic Trading Indicators: Winning with Value Charts and Price Action Profile ", from the authors Mark Helweg and David Stendahl. The idea is simple and the result is pure genius: Present candlestick Price analysis in a detrended way! HOW TO READ THIS INDICATOR Look for Overbought and Oversold levels. Of course, you will need to test the settings a lot to find the "correct" one for your approach.
FREE
Are you tired of drawing trendlines every time you're analyzing charts? Or perhaps you would like more consistency in your technical analysis. Then this is for you. This indicator will draw trend lines automatically when dropped on a chart. How it works Works similar to standard deviation channel found on mt4 and mt5. It has 2 parameters: 1. Starting Bar 2. Number of bars for calculation The   starting bar   is the bar which drawing of the trend lines will begin, while the   number of bars for c
FREE
Santa Donchian
Marco Aurelio Cestari
4.17 (6)
Santa Donchian Indicator  is an efficient way to detect support, resistence and break outs in any market. The Donchian channel measures the high and the low of a previously defined range.  Typically, a trader would look for a well-defined range and then wait for the price to break out to either one side for a trade entry trigger. Advantages Never repaints, never backpaints, never recalculates. Works in all symbols and all timeframes. Perfect trend filter for any strategy or expert advisor. Fu
FREE
This is a buyer and seller aggression indicator that analyzes the shape of each candle and project this data in a histogram form. There are 4 histograms in one. On the front we have two: Upper - Buyer force. Lower - Seller force. At the background we also have two histogram, both with same color. They measure the combined strenght of buyers and sellers. This histograms can be turned off in Input Parameters. It is also possible to have the real or tick volume to help on this force measurement. IN
FREE
Pull Back
Zoltan Nemet
4.86 (7)
Volume pressure and oscillator overbougth - oversold condition togedther. Signals appears on chart. Turnig points, trading ranges, support- resistance levels also. Change parameters in the trendscalp settings. TTF bars can be set: 8, or, 15, or 45, 150. Greather periods are very useful at strong support - resistance areas.  IF ONE OF OUR FREE INDICATOR IS NICE TO YOU, FEEL FREE TO BUY AT LEAST OUR CHIEPST PRODUCT TO DONATE US. "Lots of small peace can be a mountain" ( nathan rothschild, john len
FREE
SDivergence Indicator calculates and shows regular divergences and hidden divergences for MACD and Stochastic(for now). The benefit of this indicator is multiple input variables. Using these inputs you can modify to get more adaptive RD and HD's to your strategy. Guide : 1- First put your desired oscillator (MACD or Stochastic or Both) on the chart. 2- Run SDivergence indicator and set corresponding sub-window index of previously put oscillator in SDivergence input window. -Note: the chart sub-w
FREE
This simple indicator paints with a darker color on the volume bar when the quantity traded is above the average of select number of periods of the volume itself, highlighting the moments when there was a large volume of deals above the average. It is also possible to use a configuration of four colors where the color tone shows a candle volume strength. The indicator defaults to the simple average of 20 periods, but it is possible to change to other types of averages and periods. If you like
FREE
This indicator calculates fibonacci levels via moving averages trend and draw these lines. You can change fast and slow Moving Averages settings for customization. Inputs: Fast MA Time Period :  64 Fast MA Shift: 0 Fast MA Method: Smoothed Fast MA Apply To: Median Price Slow MA Time Period: 32 Slow MA Shift: 0 Slow MA Method: Smoothed Slow MA Apply To: Median Price ZigZag: False ZigZag Color: Red ZigZag Type: DashDot ZigZag Width: VeryThin Fibo Settings TrendFibonacci: True FiboTrendColor: Blac
FREE
Atr Size Alert
Flavia Freitas Claro Dos Santos Claro
5 (2)
Indicador baseado no ATR (Avarage True Range) que exibe o tamanho em pips ou pontos do ativo. O indicador ATR SIZE ALERT dispara um alerta caso o preço atinja o numero de pips pre definido pelo usuário: Input: Periodo (periodo do indicador ATR) Pips (tamanho do movimento esperado) Alert (alerta sonoro) Além do alerta sonoro, o indicador também possui alerta visual.
FREE
New Candle Alert
Aurelio Miguel Machado Da Silva
4.5 (2)
New candlestick alert, the alert appears according to the timeframe it is placed on. The indicator works on any asset, the alert can be silenced at any time, without the need to remove the indicator from the graph.  It's great for those who can't keep an eye on the chart all the time. You can use this tool at work, college or anywhere else. It is also possible to receive signals directly on your cell phone by connecting to the metatrader. Aurélio Machado. 
FREE
Necessary for traders: tools and indicators Waves automatically calculate indicators, channel trend trading Perfect trend-wave automatic calculation channel calculation , MT4 Perfect trend-wave automatic calculation channel calculation , MT5 Local Trading copying Easy And Fast Copy , MT4 Easy And Fast Copy , MT5 Local Trading copying For DEMO Easy And Fast Copy , MT4 DEMO Easy And Fast Copy , MT5 DEMO The homeopathic indicator is also called the CCI indicator. The CCI indicator was propos
FREE
Supports And Resistances Lines
Francisco Gomes Da Silva
4.78 (40)
サポートゾーンとレジスタンスゾーンのインジケーターMT5 このインジケーターは、トップとボトムを自動的に識別する方法を知っています。 このサポートとレジスタンスインジケーターは、トップとボトムに基づいてサポートラインとレジスタンスラインを作成します。 サポートラインとレジスタンスラインの作り方。 これは、自動サポートラインとレジスタンスラインを作成するためのインジケーターです。 インジケーターを使用してサポートレベルを見つける方法。 このインジケーターはトップとボトムを自動的に検出します。 インジケーターは、「ZigZag」が自動的に底を作成するか、新しい底を前の底より低くするたびにサポートラインを自動的に作成するため、インジケーターは画面に自動サポートラインを自動的に描画します。 レジスタンスラインの作成方法。 インジケーターは、「ZigZag」が新しいトップまたは前のトップよりも高いトップを作成するたびに、サポートレベルを作成するのと同じ方法で抵抗線を自動的に作成します。したがって、インジケーターは新しい抵抗を自動的に作成します。トップレベルとボトムレベルがどこにあるかを心配する必
FREE
The indicator works to convert normal volume into levels and determine financial liquidity control points. It is very similar in function to Fixed Volume Profile. But it is considered more accurate and easier to use than the one found on Trading View because it calculates the full trading volumes in each candle and in all the brokers present in MetaTrade, unlike what is found in Trading View, as it only measures the broker’s displayed prices. To follow us on social media platforms: tel
FREE
Candle Zones
Flavio Javier Jarabeck
5 (1)
You probably heard about Candlesticks behaviors, which in most of the times could denote and trace Volume behaviors even if you are not watching Volume itself... Well, this indicator will do this. Naked traders love to rely solely on candlesticks patterns and with Candle Zones you can trap special patterns and DRAW THEM on your chart. As simple as that. There are several filters you can tweak in order to achieve the analysis you want. Just give it a try. After several months of testing, we think
FREE
Multi-timeframe trend indicator based on the ADX / ADXWilder indicator with Fibonacci levels The indicator shows trend areas using ADX or ADXWilder indicator data from multiple timeframes. The impulse mode of the indicator allows you to catch the beginning of a trend, and several "Screens" with different timeframes allow you to filter out market noise. Fibonacci levels are added to the price chart, which have flexible settings. How the indicator works: if PDI is greater than NDI, then   it`
FREE
Free automatic Fibonacci is an indicator that automatically plots a Fibonacci retracement based on the number of bars you select on the BarsToScan setting in the indicator. The Fibonacci is automatically updated in real time as new highest and lowest values appears amongst the selected bars. You can select which level values to be displayed in the indicator settings. You can also select the color of the levels thus enabling the trader to be able to attach the indicator several times with differe
FREE
This Mt5 Indicator Signals when there is two opposite direction bars engulfed by current bar.  has a recent Exponential Moving Average Cross and past bar was oversold/bought Expert Advisor Available in Comments  Free Version Here : https://www.mql5.com/en/market/product/110114?source=Site&nbsp ; Full Alerts for mt5 terminal , phone , email, print to file, print to journal  Buy Signal ( blue line ) Past ema cross ( set at 30 bars back ) Past bar rsi is oversold ( level 40  ) Engulfing bar closes
FREE
このプロダクトを購入した人は以下も購入しています
まず第一に、このトレーディングシステムがノンリペイント、ノンリドロー、ノンラグのインジケーターであることを強調する価値がある。これにより、手動取引とロボット取引の両方に理想的なものになっています。 「スマートトレンドトレーディングシステム MT5」は、新規および経験豊富なトレーダー向けにカスタマイズされた包括的なトレーディングソリューションです。10以上のプレミアムインジケーターを組み合わせ、7つ以上の堅実なトレーディング戦略を備えており、多様な市場状況に対応する多目的な選択肢となっています。 トレンドフォロー戦略:トレンドを効果的に乗り越えるための正確なエントリーとストップロス管理を提供します。 リバーサル戦略:潜在的なトレンドの反転を特定し、トレーダーがレンジ相場を活用できるようにします。 スキャルピング戦略:高速で正確なデイトレードおよび短期取引のために設計されています。 安定性:すべてのインジケーターはノンリペイント、ノンリドロー、ノンラグであり、信頼性の高いシグナルを保証します。 カスタマイズ:個々の取引の嗜好に合わせたカスタム戦略をサポートします。7つ以上の戦略と組み合わせ
まず第一に、この取引インジケーターは再描画されず、再描画されず、遅延しないことを強調する価値があります。これにより、手動取引とロボット取引の両方に理想的なものになります。 アトミックアナリストは、価格の強さとモメンタムを利用して市場でより良いエッジを見つけるためのPA価格アクションインジケーターです。ノイズや誤ったシグナルを除去し、取引ポテンシャルを高めるための高度なフィルターを備えています。複雑なインジケーターの複数のレイヤーを使用して、アトミックアナリストはチャートをスキャンし、複雑な数学的計算をシンプルなシグナルと色に変換します。これにより、どのような初心者トレーダーでも理解して使用し、一貫した取引の決定を行うことができます。 「アトミックアナリスト」は、新規および経験豊富なトレーダー向けにカスタマイズされた包括的な取引ソリューションです。プレミアムインジケーターとトップノッチの機能を1つの取引戦略に組み合わせ、すべてのタイプのトレーダーにとって汎用性のある選択肢にします。 デイリートレーディングとスキャルピング戦略:高速で正確なデイトレーディングおよび短期トレード
FX Volume MT5
Daniel Stein
4.94 (17)
mql5と Telegramの モーニング・ブリーフィングで、詳細とスクリーンショットを含む毎日のマーケット・アップデートをご覧 ください! FX Volumeは、ブローカーの視点から市場のセンチメントをリアルに洞察する、最初で唯一の出来高インジケーターです。 ブローカーのような機関投資家が外国為替市場でどのようなポジションをとっているか、COTレポートよりもはるかに速く、素晴らしい洞察を提供します。 この情報をチャート上で直接見ることは、あなたの取引にとって真のゲームチェンジャーであり、画期的なソリューションです。 以下のようなユニークなマーケットデータ洞察から利益を得てください。 比率は 、通貨のロングポジションとショートポジションの比率をパーセントで表示します。 比率の変化は 、選択した期間内のロング比率とその変化率を表示します。 Volumes Totalは 、通貨の取引量(ロングとショート)の合計をロット単位で表示します。 Volumes Long :全通貨のロングポジションの取引量を表示します。 Volumes(ショート )は、全通貨のショートポジションの取引量を表示
ご紹介   クォンタム トレンド スナイパー インジケーターは 、トレンド反転を特定して取引する方法を変革する画期的な MQL5 インジケーターです。 13年以上の取引経験を持つ経験豊富なトレーダーのチームによって開発されました。     クォンタムトレンドスナイパーインジケーター   は、非常に高い精度でトレンドの反転を識別する革新的な方法で、あなたのトレーディングの旅を新たな高みに押し上げるように設計されています。 ***Quantum Trend Sniper Indicatorを購入すると、Quantum Breakout Indicatorを無料で入手できます!*** クォンタム ブレイクアウト インジケーターは、トレンドの反転を特定するとアラートを発し、矢印を示し、3 つのテイクプロフィットレベルを提案します。 初心者トレーダーにもプロのトレーダーにも適しています。 量子EAチャネル:       ここをクリック MT4のバージョン:       ここをクリック 推奨事項: 期間:すべての時間枠。最良の結果を得るには、M
トレンド スクリーナー インジケーターでトレンド取引の力を解き放ちます。ファジー ロジックと複数通貨システムを活用した究極のトレンド取引ソリューションです。 ファジー ロジックを活用した革新的なトレンド インジケーターである Trend Screener を使用して、トレンド取引を向上させます。 これは、13 を超えるプレミアム ツールと機能、および 3 つの取引戦略を組み合わせた強力なトレンド追跡インジケーターであり、Metatrader をトレンド アナライザーにする多用途の選択肢となります。 期間限定オファー : トレンド スクリーナー インジケーターは、わずか 50 ドルで生涯ご利用いただけます。 (元の価格 125$ ) (オファー延長) Trend Screener の 100% 非再描画精度の揺るぎない精度を体験して、取引の決定が過去の価格変動の影響を受けないようにしてください。 マルチタイムフレームおよびマルチ通貨機能の多用途性を解放し、比類のない自信を持って外国為替、商品、暗号通貨、インデックスの世界を取引できるようにします。 Trend Screener の包括的な
Gold Stuff mt5
Vasiliy Strukov
4.89 (166)
Gold Stuff mt5 は、金専用に設計されたトレンド指標であり、あらゆる金融商品にも使用できます。 インジケーターは再描画せず、遅れません。 推奨時間枠 H1. 設定と個人的なボーナスを得るために、購入後すぐに私に連絡してください!   設定 矢印を描く - オンオフ。 チャートに矢印を描く。 アラート - 可聴アラートのオンオフ。 メール通知 - オンオフ。 電子メール通知。 プチ通知 - オンオフ。 プッシュ通知。 次に、色域を調整します。 Gold Stuff mt5 は、金専用に設計されたトレンド指標であり、あらゆる金融商品にも使用できます。 インジケーターは再描画せず、遅れません。 推奨時間枠 H1. 設定と個人的なボーナスを得るために、購入後すぐに私に連絡してください!   設定 矢印を描く - オンオフ。 チャートに矢印を描く。 アラート - 可聴アラートのオンオフ。 メール通知 - オンオフ。 電子メール通知。 プチ通知 - オンオフ。 プッシュ通知。 次に、色域を調整します。
まず第一に、この取引ツールはノンリペイント、ノンリドロー、ノンラグの指標であり、プロの取引に理想的ですことを強調する価値があります。 スマートプライスアクションコンセプトインジケーターは、新米から経験豊富なトレーダーまで、非常 に強力なツールです。Inner Circle Trader AnalysisやSmart Money Concepts Trading Strategiesなど、20以上の有用な指標を1つに組み合わせています。このインジケーターはスマートマネーコンセプトに焦点を当て、大手機関の取引方法を提供し、彼らの動きを予測するのに役立ちます。 特に、流動性分析に優れており、機関がどのように取引しているかを理解しやすくしています。市場のトレンドを予測し、価格の動きを慎重に分析するのに優れています。機関の戦略とトレードを合わせることで、市場の動向についてより正確な予測ができます。このインジケーターは多目的であり、市場構造を分析し、重要な注文ブロックを特定し、さまざまなパターンを認識するのに優れています。 このインジケーターはBOSやCHoCHなどのパターンの識
これはMT5のインジケーターで、再描画なしで取引に参入するための正確なシグナルを提供します。 外国為替、暗号通貨、金属、株式、インデックスなど、あらゆる金融資産に適用できます。かなり正確な見積もりを提供し、取引を開始して終了するのに最適な時期を教えてくれます。1つのシグナルを処理しただけでインジケーターの元が取れた例の 動画 (6:22)をご覧ください。Entry PointsPro インジケーターの助けを借りたほとんどのトレーダーの最初の1週間の結果が改善しています。 Telegramグループ に登録してください。Entry Points Proインジケーターのメリットは次の通りです。 再描画のないエントリーシグナル 再描画されるインジケーターでは一度表示されたシグナルが削除されて大きな金銭的損失につながることがありますが、これと異なり、表示されて確認されたシグナルは消えることがありません。 エラーなしの取引開始 インジケーターアルゴリズムによって取引を開始する(資産を売買する)理想的な瞬間を見つけることができます。それを使用するすべてのトレーダーの成功率が向上します。
mql5と Telegramの モーニング・ブリーフィングで、詳細とスクリーンショットを含む毎日のマーケット・アップデートをご覧 ください! FX Power MT5 NGは 、長年の人気を誇る通貨強度計FX Powerの次世代モデルです。 この次世代ストレングスメーターは何を提供するのでしょうか?初代FXパワーの魅力すべて プラス GOLD/XAUの強さ分析 より正確な計算結果 個別に設定可能な分析期間 カスタマイズ可能な計算上限値により、さらに優れたパフォーマンスを実現 もっと見たい人のための特別なマルチインスタンス設定 すべてのチャートでお好みの色を無限に設定可能 数え切れないほどの通知オプションにより、重要なことを見逃すことはありません。 Windows 11とmacOSのスタイルで角を丸くした新しいデザイン 魔法のように動くインジケーターパネル FXパワーの主な機能 すべての主要通貨の強さの完全な履歴 すべての時間枠における通貨の強さの履歴 すべてのブローカーとチャートで同一の計算結果 100%信頼できるリアルタイム計算 -> リペイントなし ドロップダウン・リストから
今、147ドル(いくつかの更新後に499ドルに増加します) - 無制限のアカウント(PCSまたはMac) RelicusRoad ユーザー マニュアル + トレーニング ビデオ + プライベート Discord グループへのアクセス + VIP ステータス 市場の新しい見方 RelicusRoad は、外国為替、先物、暗号通貨、株式、および指数の世界で最も強力な取引インジケーターであり、トレーダーに収益を維持するために必要なすべての情報とツールを提供します。初心者から上級者まで、すべてのトレーダーが成功するためのテクニカル分析と取引計画を提供します。これは、将来の市場を予測するのに十分な情報を提供する重要な取引指標です。意味をなさないチャート上のいくつかの異なる指標ではなく、完全な解決策を信じています.これは、信号、矢印 + 価格アクション情報を表示するオールインワンのインジケーターで、他に類を見ない非常に正確です。 強力な AI に基づいて、RelicusRoad は不足している情報とツールを提供して、あなたを教育し、トレーディングのプロ、成功したトレーダーにします。
Auto Order Block with break of structure based on ICT and Smart Money Concepts Futures Break of Structure ( BoS )             Order block ( OB )            Higher time frame Order block / Point of Interest ( POI )    shown on current chart           Fair value Gap ( FVG ) / Imbalance   ,  MTF      ( Multi Time Frame )    Volume Imbalance     ,  MTF          vIMB Gap’s Equal High / Low’s     ,  MTF             EQH / EQL Liquidity               Current Day High / Low           HOD /
Step into the realm of Forex trading with confidence and precision using XQ, a cutting-edge Forex indicator designed to elevate your trading game to unprecedented heights. Whether you're a seasoned trader or just stepping into the world of currency exchange, XQ Forex Indicator empowers you with the insights and signals needed to make informed trading decisions. The signal conditions are a combination of three indicators, and XQ Forex Indicator only display  medium and long-term trends . The ind
Was: $299  Now: $99   Supply Demand uses previous price action to identify potential imbalances between buyers and sellers. The key is to identify the better odds zones, not just the untouched ones. Blahtech Supply Demand indicator delivers functionality previously unavailable on any trading platform. This 4-in-1 indicator not only highlights the higher probability zones using a multi-criteria strength engine, but also combines it with multi-timeframe trend analysis, previously confirmed swings
現在33%オフ 初心者にもエキスパートトレーダーにも最適なソリューション このインジケーターは独自の機能と新しい公式を多数内蔵しており、ユニークで高品質かつ手頃な取引ツールです。このアップデートでは、2つの時間枠ゾーンを表示できるようになります。より長いTFだけでなく、チャートTFとより長いTF(ネストゾーンを表示)の両方を表示できます。すべてのSupply Demandトレーダーの皆さんのお気に召すはずです。:) 重要情報の公開 Advanced Supply Demandの可能性を最大化するには、 https://www.mql5.com/ja/blogs/post/720245 にアクセスしてください。   エントリーまたはターゲットの正確なトリガーポイントを正確に特定できれば取引がどのように改善されるか想像してみてください。新しい基盤となるアルゴリズムに基づいて構築されているため、買い手と売り手の間の潜在的な不均衡をさらに簡単に特定できます。これは、最も強い需要と供給のゾーンと、過去のパフォーマンス(古いゾーンを表示)がグラフィカルに表現されるためです。これらの機能は、最適
ICT, SMC, SMART MONEY CONCEPTS, SMART MONEY, Smart Money Concept, Support and Resistance, Trend Analysis, Price Action, Market Structure, Order Blocks, BOS/CHoCH,   Breaker Blocks ,  Momentum Shift,   Supply&Demand Zone/Order Blocks , Strong Imbalance,   HH/LL/HL/LH,    Fair Value Gap, FVG,  Premium  &   Discount   Zones, Fibonacci Retracement, OTE, Buy Side Liquidity, Sell Side Liquidity, BSL/SSL Taken, Equal Highs & Lows, MTF Dashboard, Multiple Time Frame, BigBar, HTF OB, HTF Market Structure
Gannスクエアインジケーターは、W.D. Gannによって執筆された「市場予測のための数学的な式」の記事に基づく強力な市場分析ツールです。このツールは、解析に数学的な概念を応用し、Gann理論に基づいています。それは、144、90、52のスクエアや9のスクエアなど、Gannの関連テクニックの要素を取り入れています。さらに、の方法を組み込んでおり、9のスクエアとその関連性についてのチャネルやスターパターンに焦点を当てています。 ユーザーマニュアルと使用方法: このインジケーターを使用する前に、ユーザーマニュアルを読んで疑問点を解決するためにお問い合わせいただくことをお勧めします。ユーザーマニュアルの完全版は、当社のウェブサイトで入手できます。 MT5の完全版は購入できますし、MT4の無料版も試すことができます。両方のバージョンへのリンクを提供していますので、ご利用ください。 主な機能と機能: Gannスクエアインジケーターは、市場分析のための完全なツールセットを提供し、幾何学的な概念とGann理論に基づいて的確な判断を行う手助けをします。以下に主な機能を示します。 9のスクエアの分析:
AW Trend Predictor MT5
AW Trading Software Limited
4.76 (54)
1 つのシステムでのトレンド レベルとブレイクダウン レベルの組み合わせ。高度なインジケーター アルゴリズムは、市場のノイズをフィルター処理し、トレンド、エントリー ポイント、および可能なエグジット レベルを決定します。インジケーターシグナルは統計モジュールに記録されるため、最適なツールを選択してシグナル履歴の有効性を示すことができます。この指標は、テイクプロフィットとストップロスのマークを計算します。 マニュアルと説明書 ->   ここ / MT4 バージョン ->   ここ インジケーターで取引する方法: Trend Predictor での取引は、たった 3 つの簡単なステップです。 ステップ 1 - ポジションを開く 70% 以上の成功率で買いシグナルが受信されました ステップ 2 - ストップロスの決定 逆信号でトランクを選択 ステップ 3 - テイクプロフィット戦略の定義 戦略 1: TP1 に到達したらポジション全体をクローズする 戦略 2: TP1 に達した時点でポジションの 50% をクローズし、TP2 に達した時点で残りの 50% をクローズします。 戦略 3:
ブレーカートレーダーになり、価格が反転すると市場構造からの利益が変化します。 注文ブロックブレーカーインジケーターは、トレンドまたは価格の動きが枯渇に近づいており、逆転の準備ができていることを識別します。通常、反転または大規模なプルバックが発生しようとしているときに発生する市場構造の変化について警告します。 この指標は、ブレイクアウトと価格の勢いを識別する独自の計算を使用します。使い果たされる可能性のあるポイントの近くで新しい高値が形成されるたびに、インディケーターはその高値の作成を担当する最後の注文ブロックを描きます。次に、移動する価格とともに注文ブロックを追跡します。その後、価格が反対方向にシフトし、その注文ブロックを突破すると、新しい市場構造を作成し、トレンドまたは大きな後退の可能性のある反転の開始を警告します。 注文ブロックは、高値/安値が作成される前の最後の反対色のろうそくであり、価格がこれらの重要な領域を下抜けすると、トレンドの短期的ま​​たは長期的な反転の兆候です。 特徴 重要な枯渇点での市場構造の変化を警告します 価格が使い果たされるレベルに近づくと、
The Volume by Price Indicator for MetaTrader 5 features Volume Profile and Market Profile TPO (Time Price Opportunity). Get valuable insights out of currencies, equities and commodities data. Gain an edge trading financial markets. Volume and TPO histogram bar and line charts. Volume Footprint charts. TPO letter and block marker charts including split structures. Versatile segmentation and compositing methods. Static, dynamic and flexible ranges with relative and/or absolute visualizations. Lay
ご紹介     Quantum Breakout PRO は 、ブレイクアウト ゾーンの取引方法を変革する画期的な MQL5 インジケーターです。 13年以上の取引経験を持つ経験豊富なトレーダーのチームによって開発されました。     クォンタム ブレイクアウト プロ   は、革新的でダイナミックなブレイクアウト ゾーン戦略により、あなたのトレーディングの旅を新たな高みに押し上げるように設計されています。 クォンタム ブレイクアウト インジケーターは、5 つの利益ターゲット ゾーンを備えたブレイクアウト ゾーン上のシグナル矢印と、ブレイクアウト ボックスに基づいたストップロスの提案を提供します。 初心者トレーダーにもプロのトレーダーにも適しています。 量子EAチャネル:       ここをクリック 重要!購入後、インストールマニュアルを受け取るためにプライベートメッセージを送ってください。 推奨事項: 時間枠: M15 通貨ペア: GBPJPY、EURJPY、USDJPY、NZDUSD、XAUUSD アカウントの種類: ECN、Raw、またはス
TrendLine PRO MT5
Evgenii Aksenov
4.78 (49)
The Trend Line PRO indicator is an independent trading strategy. It shows the trend change, the entry point to the transaction, as well as automatically calculates three levels of Take Profit and Stop Loss protection Trend Line PRO is perfect for all Meta Trader symbols: currencies, metals, cryptocurrencies, stocks and indices Advantages of Trend Line PRO Never redraws its signals The possibility of using it as an independent strategy It has three automatic levels Take Profit and Stop Loss lev
MT4版  |  FAQ Owl Smart Levels Indicator は、 Bill Williams の高度なフラクタル、市場の正しい波構造を構築する Valable ZigZag、エントリの正確なレベルをマークする Fibonacci レベルなどの一般的な市場分析ツールを含む 1 つのインジケーター内の完全な取引システムです。 利益を得るために市場と場所に。 戦略の詳細な説明 インジケータを操作するための指示 顧問-取引助手 プライベートユーザーチャット ->購入後に私に書いて、私はプライベートチャットにあなたを追加し、あなたはそこにすべてのボーナスをダウンロードすることができます 力はシンプルさにあります! Owl Smart Levels 取引システムは非常に使いやすいので、専門家にも、市場を勉強し始めて自分で取引戦略を選択し始めたばかりの人にも適しています。 戦略と指標に秘密の数式や計算方法が隠されているわけではなく、すべての戦略指標は公開されています。 Owl Smart Levels を使用すると、取引を開始するためのシグナルをすばやく確認し、注文を出すため
Gartley Hunter Multi - An indicator for searching for harmonic patterns simultaneously on dozens of trading instruments and on all classic timeframes: (m1, m5, m15, m30, H1, H4, D1, Wk, Mn). Manual (Be sure to read before purchasing) | Version for MT4 Advantages 1. Patterns: Gartley, Butterfly, Shark, Crab. Bat, Alternate Bat, Deep Crab, Cypher 2. Simultaneous search for patterns on dozens of trading instruments and on all classic timeframes 3. Search for patterns of all possible sizes. Fr
トレンドラインマップインジケーターは、トレンドスクリーナーインジケーターのアドオンです。トレンドスクリーナー(トレンドラインシグナル)によって生成されたすべてのシグナルのスキャナーとして機能します。 これは、トレンドスクリーナーインジケーターに基づくトレンドラインスキャナーです。 Trend Screener Pro インジケーターがない場合、Trend Line Map Proは機能しません。 It's a Trend Line Scanner based on Trend Screener Indicator. If you don't have Trend Screener Pro Indicator,     the Trend Line Map Pro will not work . ブログにアクセスすると、トレンドラインマップインジケーターの無料バージョンをダウンロードできます。 Metatrader Testerの制限なしで、購入する前に試してみてください。 :  ここをクリック 1.簡単になる利点 通貨と時間枠に基づいて売買シグナルを表示し
TrendDecoder Premium MT5
Christophe, Pa Trouillas
5 (1)
レンジと次の動きを特定     |    トレンドの最も早いシグナルと強さを得る     |    反転の前に明確な出口を得る     |    価格がテストするフィボ・レベルを見つける。   |  非リペイント、非遅延インディケータ - マニュアルおよび自動売買に最適 - すべての資産、すべての時間単位に対応 - 発売記念50%割引   - その後 149 ドルに戻る 購入後、 推奨セッティングについては、このチャンネルで私に連絡してください。 MT4 バージョン: ここをクリック BladeSCALPER と PowerZONES を使った完全な方法を入手する どのようなものですか? TrendDECODERは、トレンド監視をシンプルかつ簡単にするための複数のイノベーションを集約したものです。 Projective TrendLine (投影トレンドライン) - 今後のトレンドのスピードリファレンス RealTime TrendLine vs. Projective TrendLine (リアルタイムトレンドライン vs. Projective Tren
MetaBands M5
Vahidreza Heidar Gholami
4.67 (3)
MetaBandsは、強力でユニークなアルゴリズムを使用してチャンネルを描画し、トレンドを検出して、トレーダーに取引の入出ポイントを提供することができます。チャンネル指標に加えて、強力なトレンド指標でもあります。入力パラメータを使用して新しいチャンネルを作成するために、異なるタイプのチャンネルを統合することができます。MetaBandsは、市場のイベントについてユーザーに通知するために、すべてのタイプのアラートを使用します。 特徴 ほとんどのチャンネルアルゴリズムをサポート 強力なトレンド検出アルゴリズム 異なるタイプのチャンネルを統合する能力 マルチタイムフレームおよびマルチカレンシー(シグナルマトリックス) すべてのタイプのアラート機能(サウンド、画面フラッシャー、プッシュ通知、メール、ポップアップ、矢印) 再描画しない トレンド検出 MetaBandsは、チャネル内を振動する青いラインを使用してトレンドを検出します。ラインがチャネルの上部バンドに達すると、下降トレンドの開始を示し、下部バンドに達すると上昇トレンドの開始を示します。青いラインが中心ラインに近づくと、市場はコンソ
TPSpro TRENDPRO  - is a trend indicator that automatically analyzes the market and provides information about the trend and each of its changes, as well as giving signals for entering trades without redrawing! The indicator uses each candle, analyzing them separately. referring to different impulses - up or down impulse. Exact entry points into transactions for currencies, crypto, metals, stocks, indices!  -  Version MT4                  DETAILED DESCRIPTION        /       TRADING SETUPS       
Was: $249  Now: $99   Market Profile defines a number of day types that can help the trader to determine market behaviour. A key feature is the Value Area, representing the range of price action where 70% of trading took place. Understanding the Value Area can give traders valuable insight into market direction and establish the higher odds trade. It is an excellent addition to any system you may be using. Inspired by Jim Dalton’s book “Mind Over Markets”, this indicator is designed to suit the
支持線と抵抗線、そしてローソク足のギャップをチャート上に自動的に表示するため、価格が次に向かう可能性のある場所や反転する可能性のある場所を確認することができます。 このインジケーターは、私のウェブサイト(The Market Structure Trader)で教えているポジショントレード手法の一部として使用するように設計されており、ターゲットとエントリーの可能性のための重要な情報を表示します。 MT4 Version:  https://www.mql5.com/en/market/product/97246/ このインジケーターには、2つのコア機能と4つの追加機能があります: コア機能1 - 日足、週足、月足のサポートラインとレジスタンスラインの自動表示 このインジケーターは、直近2日間、最大6週間前、数ヶ月前のサポートレベルとレジスタンスレベルを自動的に引き込みます。これらのレベルの見た目は完全にカスタマイズすることができ、いくつ表示されるかを表示することもできます。これらの重要な水準は、しばしば主要な支持線と抵抗線として機能し、価格が転換して引き戻されたり反転したりする場
Golden Spikes Detector This indicator is based on an advanced strategy primarily for trading spikes on Boom and Crash Indices. Complex algorithms were implemented to detect high probability entries only. It alerts on potential Buy and Sell entries. To trade spikes on the Deriv or Binary broker, only take Buy Boom and Sell Cash alerts. It was optimised to be loaded on 5-minute timeframe although multiple timeframe analysis is done in the background. Features ·             Desktop pop up and sound
作者のその他のプロダクト
Lot Size Calculation, based on mouse click on the start and click on the end of the measure! For proper measurement click with the middle mouse button then choose the first value then right click and drag until the last price you want then release the right button It shows the Stop Loss with minimum lots, your ideal lots, and the Stop Loss in price. Everything is based on a Percentage or Cash Risk per Trade, if is Percentage, you can choose between compound and a fix account value. To use curr
FREE
For more detailed description of the inputs please enter our comunnity (  https://discord.gg/UjxeJK9SsN ) Automatic calculation of Stop Loss and Take Profit based on Volatility. You can configure 5 stops and 5 takes difereent volatilities. You can choose between a variable account (Lots gonna go up or down based on the account capital) or a fixed account based on the input. In case you want a currency conversion between account and symbol, example USD account to EUR symbol, or another currency
FREE
For more support and resistance check Support and Resistance for All Market Cycles For more details of the inputs please enter our comunnity (  https://discord.gg/GHFZkKkEBq ) High and Low of the Day Highest and Lowest Close of the Day High and Low of Previous x Bars divided by x times (Variable based on inputs) Bars Maximum represents the max of previous bars you want Progression is how much lines you want, and consecutively how often is it divided bars maximum You can pick and choose what
FREE
This indicator shows you the time of the opening and close of the trading time of every symbol. If it's out of the trading time it will show you a message in the screen, you can choose "PT-BR" or "ENG". For future updates i want to trigger a sound alarm in the preset value by the client for the opening of positions and closement of all positions. If you want anything more than that just message me in the community (  https://discord.gg/P5mcttvXgw  ) and I will update it for you!
FREE
Apenas Cancela Ordens Exceução de cancelamento de ordens de modo rápido, para todos os ciclos de mercado Necessita do Indicador ( https://www.mql5.com/pt/market/product/79691 ) Para mais detalhes de configurações e input de variáveis entre em nossa comunidade no guilded ( https://www.guilded.gg/i/E9m8bYLE ) Inclui Rompimentos, Canais Estreitos, Canais Amplos e Lateralidades, ou seja para todos os ciclos
FREE
Apenas Abre posições em lado inverso para cada posição aberta e fecha as posições antigas Exceução de Inversão de mão de modo rápido, funciona em Conta Hedge e Netting Para mais detalhes de configurações e input de variáveis entre em nossa comunidade no guilded ( https://www.guilded.gg/i/E9m8bYLE ) Inclui Rompimentos, Canais Estreitos, Canais Amplos e Lateralidades, ou seja para todos os ciclos
FREE
Apenas Fecha Posições Parcialmente Exceução de fechar parte da posição de modo rápido, funciona em Conta Hedge e Netting Para mais detalhes de configurações e input de variáveis entre em nossa comunidade no guilded ( https://www.guilded.gg/i/E9m8bYLE ) Inclui Rompimentos, Canais Estreitos, Canais Amplos e Lateralidades, ou seja para todos os ciclos
FREE
Apenas Fecha Posições Exceução de fechamento de posições de modo rápido, para todos os ciclos de mercado Necessita do Indicador ( https://www.mql5.com/pt/market/product/79691 ) Para mais detalhes de configurações e input de variáveis entre em nossa comunidade no guilded ( https://www.guilded.gg/i/E9m8bYLE ) Inclui Rompimentos, Canais Estreitos, Canais Amplos e Lateralidades, ou seja para todos os ciclos
FREE
Apenas Cancela Ordens e Fecha Posições Exceução de cancelamento de ordens e encerramento de posições de modo rápido, para todos os ciclos de mercado Necessita do Indicador ( https://www.mql5.com/pt/market/product/79691 ) Para mais detalhes de configurações e input de variáveis entre em nossa comunidade no guilded ( https://www.guilded.gg/i/E9m8bYLE ) Inclui Rompimentos, Canais Estreitos, Canais Amplos e Lateralidades, ou seja para todos os ciclos
FREE
Apenas Ajusta todas as posições para o Breakeven com relação ao Preço Médio de total Exceução de ajuste de Breakeven de modo rápido, funciona em Conta Hedge e Netting Para mais detalhes de configurações e input de variáveis entre em nossa comunidade no guilded ( https://www.guilded.gg/i/E9m8bYLE ) Inclui Rompimentos, Canais Estreitos, Canais Amplos e Lateralidades, ou seja para todos os ciclos
FREE
Please enable this site  https://openexchangerates.org/  on webrequest options on Tools -> Options -> Expert Advisors  this utility has it's function as a updater of your's database with the currency conversions of the day, all the days, and all the Currency Pairs. My Expert Advisors and Indicators who make auto calculation to show the lot take this data to guide their calculation, in relation to a account currency and a pair curreny who isn't the same as the account. Sample account in USD and
Funciona em Conta Hedge e Netting: - Máximo de Trades no dia - Sessão Operacional (Horário de Inicio e Termino) - Tempo Mínimo de aguardo entre operações - Ajuste de Lotes (Realiza parte da mão para poder ficar com o risco pré configurado para o risco máximo Trade a Trade) para ordens pendentes para posições em aberto Por agora funciona na gestão Trade à Trade Porém futuramente farei gestão do dia e do mês, baseando no Draw Down Máximo do Dia/Mês Eu salvo os dados em u
フィルタ:
レビューなし
レビューに返信
バージョン 1.96 2023.10.23
Added Volume showing in the screen for pending, position and total
バージョン 1.95 2023.10.19
Bug Fixes:
Fix Account now works properly with database
バージョン 1.71 2023.03.25
Now Shows to you Year, Monthly and Weekly Draw Down
バージョン 1.67 2023.03.23
Now works properly when trading a hedge position (Bought and Sold)
バージョン 1.65 2023.03.23
Now the risk is shown properly for more than 1 entry
バージョン 1.63 2023.03.23
Now properly shows the Position and Pending Stop Loss in case you scaled in
バージョン 1.60 2023.03.21
Bug Fix
バージョン 1.59 2023.03.17
Bug Fix
バージョン 1.58 2023.03.16
Now Shows the Pending, Position, Maximum, Usable Risks
Take Profits
Risk Returns

and Bug Fix
バージョン 1.53 2023.03.14
Bug Fix:
Don't show anymore the projected average price if there's only positions open