MACD crossover Pro

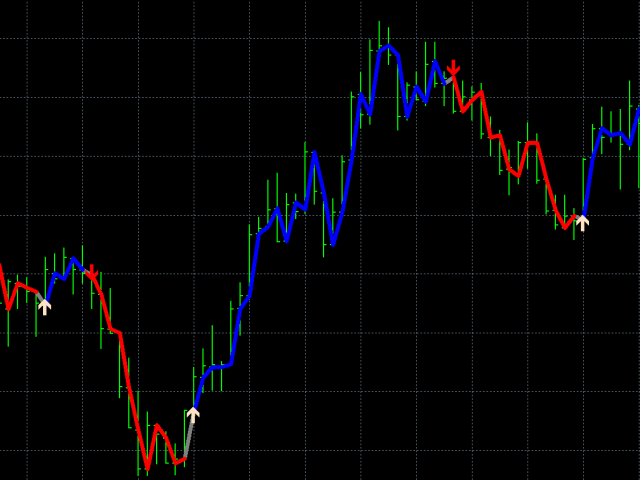
"MACD crossover" is a new version of the oscillator indicator. "MACD crossover" draws a red or blue line on the chart. When the line is blue, it means that the MACD indicator is above zero. If the line on the chart is red, it means that the MACD indicator is below zero. Thus, this indicator helps traders determine the MACD position visually on the chart. This information will be especially useful when trading scalping. You can combine this indicator and trend indicators on the chart. If this indicator draws a red line and trend indicators point to a downtrend, we open a sell order. If this indicator draws a blue line and trend indicators show a growing trend, we open a buy deal.

Benefits of the indicator:

  • not redrawn
  • shows the position of the MACD indicator on the chart
  • helps to scalp

Indicator settings:

  • arrow - turn on the display of arrows on the chart.
  • signal - enable sending signals to email and phone.
  • period_fast - fast average period.
  • period_slow - slow moving average period.
  • mode_price - used price. Maybe like this: ENUM_APPLIED_PRICE
  • width - line thickness.
  • LineColorBuy - line color when MACD is above zero.
  • LineColorSell - line color when MACD is below zero.
  • ArrowColorBuy - color of arrows when MACD crosses the chart above zero.
  • ArrowColorSell - the color of the arrows when the MACD crosses the chart below zero.
おすすめのプロダクト
Индикатор DivergenceMRDM  ситуацию, когда направление движения цены и технических индикаторов не совпадает. Что можно воспринимать как точки для входа в рынок, точки потенциального разворота рынка. Чаще всего проявляется сигнал при достижении индикатором зоны перекупленности или перепроданности. Один из четырех индикаторов: MACD , RSI , ADX , Momentum . Готовая торговая система. Индикатор не перерисовывается и не запаздывает 95% сделок прибыльные. Работает на всех валютных парах и на всех таймфр
TT MACD Dashboard is multi-time frame and multi-currency market scanner. It is telling you the value of MACD and MACD histogram (a difference between MACD line and Signal line) in a form of small rectangle. If MACD value is above zero (MACD is bullish). Rectangle border color is bullish (Navy by default).  If MACD value is below zero (MACD is bearish). Rectangle border color is bearish (OrangeRed by default). If MACD histogram is rising and above zero (Bullish histogram). Rectangle color is bull
Binary Chronos – MT4用バイナリーオプションインジケーター バッファー信号 :矢印表示でエントリーが簡単、自動売買にも対応。 ️ 満期 :デフォルトは1本のローソク足。 トレンドフォロー :トレンドを分析し、最適なエントリーポイントを検出。 現在の足でエントリー :シグナルは即時エントリー用。 ️ マーチンゲール :初回取引が失敗したら 次の足で1回だけマーチン 。 LevelEn :値が高いほど、シグナルの品質と精度が向上します。 どの時間足でも対応 。 リペイントなし :信頼性の高い安定したシグナル。 アラート機能 :ポップアップとサウンド通知。 Binary Chronos — リスクを抑えたトレンドエントリーが可能なインジケーター!
The MACD_stopper_x2 indicator shows where the trend has a tendency to stop or reverse. It uses the standard MACD indicator and a proprietary formula for processing data obtained from MACD. There are 2 types of stop/reversal signals: Small cross - probability of a trend stop/reversal is 70-80% Large cross - probability of a trend stop/reversal is 80-80% If there are open trades (for example, BUY) on the symbol the indicator is attached to, and the BUY trend ends, the indicator sends push notifica
The MACD CloseBars indicator is a trading system based on the MACD indicator popular among many traders, which is built on the principle of bars closing above the moving averages selected in the indicator settings. The signal for entering/exiting the market is the frame of the bars colors according to the trend: in case the bars in the main window of the chart are closed above/below the Fast Moving Average, Slow Moving Average individually or both together. Indicator Parameters Fast Moving Aver
標準パラメーターを使用したMACDインジケーター波に基づく 最後と最後の2つのMACDウェーブで、それぞれ正と負のフィボナッチレベルを扱います。 現時点でMACDインジケーターで負の波が終了している場合、色は緑です。 現時点でMACDインジケーターの正の波が終了している場合、色は赤です。 Waveの終了基準は、MACDの符号が異なる2ティックです。 最後の4つのMACDウェーブのトレンドラインをプロットします。 専門家とうまく働く  その他のスクリーンショット: Figures MACD   https://www.mql5.com/ru/market/product/42031 https://www.mql5.com/en/charts/10581596/audusd-h1-alpari-international https://www.mql5.com/en/charts/10631979/usdjpy-m1-alpari-international https://www.mql5.com/en/charts/10628704/gbpusd-m15-alpa
RSI TrendLine Divergency Message is an indicator for the MetaTrader 4 trading platform. Unlike the original indicator, this three in one version has a system of alerts that inform on market situation changes. It consists of the following signals: when the Main line crosses the levels of extreme zones and 50% level; when the Main line crosses the Trend line in the indicator window; divergence on the last bar. Parameters of levels of extremum, 50-level and divergence are adjustable. Parameters La
Power Renko is an indicator which plots Renko bricks underneath the chart using a histogram. You can select the brick size and the timeframe of the Renko bricks as well as whether or not to use the close price or the high/low price of the candles. Renko bricks are based on price alone, not time, therefor the Renko bricks will not be aligned with the chart's time. They are extremely useful for trend trading and many different strategies can be formed from them. Buffers are provided allowing you t
Jeslyn
Justine Kelechi Ekweh
これは、スキャルパー システムまたは非常に強い勢いに乗る戦略として、FX マニュアル トレーダー、バイナリー オプション トレーダー、または自動取引でユニバーサル EA によって使用される両方に適した多目的システムです。 これは、スキャルパー システムまたは非常に強い勢いに乗る戦略として、FX マニュアル トレーダー、バイナリー オプション トレーダー、または自動取引でユニバーサル EA によって使用される両方に適した多目的システムです。 Jeslyn は長年の研究に基づいた戦略であり、特定の価格アクション戦略に焦点を当てています。シンプルな矢印インジケーターのように見えるかもしれませんが、洗練された論理的なアルゴリズムが組み込まれています。他の指標から計算を引き出すのではなく、価格変動のみに基づいて計算します。トレンド、勢いとの違い、ダイバージェンスと出来高スプレッド分析の関係を解釈する方法を見つけました。勢いよくポジションが埋まるミニ供給ゾーンと需要ゾーンがあり、これらは開始時に私たちが希望する場所です。また、メタトレーダーでは実際の出来高を取得できないとも言われていますが
An arrow indicator is an indicator that displays arrows on a chart to indicate the direction of the market. The red arrow indicates an implied down move, while the blue arrow indicates an implied up move. The indicator works on all timeframes and all currency pairs. Trading strategy based on arrow indicator: Position entry: When the red arrow appears, open a sell position (short). When the blue arrow appears, open a buy position (long). Entry is made at the opening of the next bar after the a
Auto Optimized Bollinger Bands – 実際の市場に対応する適応型ボラティリティツール Auto Optimized Bollinger Bandsは、従来のボリンジャーバンドを強化したMT4用の高度なインジケーターで、過去のトレードシミュレーションに基づいて最適な期間と偏差の値を自動で選択します。 固定された設定に依存するのではなく、市場の実際の動きに基づいてリアルタイムで最適化を行い、ボラティリティや価格構造の変化に動的に対応できるバンドを生成します。手動での調整は不要です。 主な機能: 過去のパフォーマンスに基づいたボリンジャーバンドパラメーターの自動最適化 重要な反転ポイントでの矢印による売買シグナルを表示 アラート内蔵:サウンド、ポップアップウィンドウ、プッシュ通知 最適化の深さ、表示方法、シグナルなどのカスタマイズが可能 FX、ゴールド、株価指数、暗号通貨など様々な市場で使用可能 本ツールはデイトレードやスイングトレードに最適で、固定パラメーターの従来型インジケーターよりも、よりスマートなボラティリティ取引アプローチを提供します。
Binary Options Support Resistance Indicator This indicator is designed for binary options trading and effectively shows retracements from support and resistance levels. Signals appear on the current candle. A red arrow pointing downwards indicates a potential selling opportunity, while a blue arrow pointing upwards suggests buying opportunities. All that needs adjustment is the color of the signal arrows. It is recommended to use it on the M1-M5 timeframes as signals are frequent on these timef
The indicator is designed to trade binary options on small time frames up to m 30 Signals The blue up arrow is a buy signal. The red dn arrow is a sell signal. The signal will appear together with the advent of a new candle  and during formation Signals on the current candle Expiration time one candle from the timeframe on which you are trading You can use moving average to filter out false signals. Or escort support levels. This tool is reliable in trading.
価格ピボットポイントインジケーター。インジケーターは、チャート上のポイントで、価格が反対方向に変わる可能性のある場所を示します。インジケーターが赤い点を描くとき、​​それは価格がその動きを下げることができることを意味します。インジケーターが青い点を描くと、価格が上昇する可能性があります。このインジケーターは、ロボットに統合することにより、手動取引と自動取引の両方に使用できます。これを行うために、インジケーターにはデータ交換バッファーがあります。 推奨される通貨ペア: XAUUSD EURUSD GBPUSD AUDUSD USD JPY USDCAD USDCHF DTCUSD 推奨される時間枠: M1 M5 M15 M30 H1 H4 D1 このインジケーターとの取引方法: 購入する。インジケーターがチャートに青い点を描き、バイトレードを開始するのを待っています。デポジットの10%以内にロットサイズを設定しました。利益を15ポイント獲得します。 TakeProfitによって取引が成立しなかったが、赤い点が表示された場合は、現在の取引を成立させます。 販売のため。インジケーターがチ
Renko, Heiken Ashi, Ticks Bar, Range Bar.    Easy switching, easy setup, all in one window.        Place the Custom Chart indicator and view Renko, Heiken Ashi, Tick bar, Range bar charts in real time at real chart.    Position the offline chart window so that the indicator control panel is visible.    Switch the chart mode by click of a button.    Connect to the output chart any indicator, expert advisor without any restrictions.    No, it doesn't work in the tester.    Yes, you can use an
This indicator is an upgrade of traditional MACD on MT4. Macd Base line cross above Macd signal line the color of histogram change is red color and entry order Sell. Macd Base line cross below Macd signal line the color of histogram change is green color and entry order Buy. For above histogram of Macd can change color to good looking by can change color above zero line and lower line.
EZT Bollinger Trendline Indicator based on multiple settings of Bollinger Band. In the menu you can choose the similar settings than bollinger band indicator. Trend period and trend deviations. Also paint and arrow on chart when direction change. Three different kind of alert , such as pop up, e-mail and push notification. Try different settings on different timeframes. Please help my work and rate and comment my products!
Serpent
Volodymyr Hrybachov
The strategy is based on the MACD and Moving Average indicators. It buys when the fast MA is above the slow MA and the MACD histogram is above the signal line. It sells when the fast MA is below the slow MA and the MACD histogram is below the signal line. Designed for 4 and 5-digit quotes, use it on a VPS hosting. Launching the EA It is recommended to launch the EA on several adjacent currency pairs with the same magical numbers. For example: GBP USD , EUR USD , AUD USD , NZD USD ; or USD CAD, U
Trend Direction ADX indicator for MT4 Trend Direction ADX is part of a series of indicators used to characterize market conditions. Almost any strategy only work under certain market conditions. Therefore it is important to be able to characterize market conditions at any time: trend direction, trend strength, volatility, etc.. Trend Direction ADX is an indicator to be used to characterize trend direction: trending up trending down ranging Trend Direction ADX is based on ADX standard indicator
The Hurricane Cave Indicator shows different trade areas based on price action. It looks in the past and works out patterns that can enforce support and resistance as targets. When price breaks out of a trade area you can target just inside the next trade area. If you can't see the target just go to a slower time frame, it means the price hasn't been there for a long time. The Hurricane Cave Indicator is designed to be an add on to The Hurricane Forex Indicator also available in the Meta Trader
FREE
Gold Trader Pro is an advanced analytical tool specifically engineered for professional trading on XAUUSD (Gold). It provides an immediate comprehensive overview of market structure across 7 different timeframes, allowing traders to identify flow direction and signal strength through a modern, draggable, and interactive interface. Key Features Multi-Timeframe Analysis: Real-time monitoring of M1, M5, M15, M30, H1, H4, and D1. Two Operational Modes: MODE_SCALPING: Optimized for fast-paced analys
FREE
FTUイディオテック このインジケーターはMT4プラットフォーム用で、単独で使用できますが、他のインジケーターや戦略と組み合わせるのが最適です。 macd、adxなどの様々なインジケーターを組み合わせて矢印を描き、エントリーやトレンド転換を示唆 YouTube で短い紹介ビデオをご覧ください: https://youtu.be/lCRJ3mFNyOQ インジケーターの特徴: 矢印の販売と購入 視覚と音による警告 トレンド継続 / 早期トレンド転換シグナル 新機能: 履歴内のバーの数を制限する バーから矢印までの距離を変更する 使用法: このインジケーターは、ほとんどの資産グループ、外国為替、商品、指数などで使用できます。 すべてのタイムフレーム、再描画なし、高速読み込み 私の FTU Predictor と組み合わせると、確実に優位性が得られます。 いくつかのアドバイス: 資金管理と規律が鍵であり、単一の戦略や指標が成功をもたらすことはありません。損失は発生するものであり、それをどのように回復するかを理解することが重要です。小さな勝ったり負けたりして、市場に恩返しすることがすべての日
FREE
The Relative Strength Index (RSI) was developed by J. Welles Wilder and is a momentum oscillator that identifies overbought and oversold conditions. It is also a popular choice for many traders helping them find entries into the market. How it Works The simplest way to use the Relative Strength Index is to wait for an overbought or oversold condition and then enter into a trade when the RSI indicates that price is resuming in the dominant direction of the trend. Buy signals : For the first cond
Добрый День уважаемые трейдеры!  Вашему вниманию индикатор созданный и работающий на базе трендовика ADX,  для торговли на смене направления движения который учитывает коррекцию и даёт возможность на ней заработать.  Применяю этот индикатор для скальпинга. Рекомендую таймфреймы от 15 ти минутного(М15) до часового (Н1) периодов.  Красный кружок сигнал на продажу- Sell) Зелёный кружок  сигнал на покупку Buy) Чем меньше ваш таймфрейм тем меньше пунктов вы зарабатываете.   Важно выставлять стопы! !В
Smc Macd
Yutthaphong Hanphayom
SMC MACD – マーケット構造およびモメンタム・コンテキスト・インジケーター 概要 SMC MACD は、Smart Money Concept(SMC)の原則に基づき、 MACD ベースのモメンタムロジック を使用して マーケット構造分析 を支援するために設計されたテクニカルインジケーターです。 本インジケーターは、 主要な構造エリア周辺における構造の変化とモメンタムの挙動 を、 明確かつシンプルな方法で観察できるようにします。 自動売買システムではなく、 分析および確認のためのツール として設計されています。 コアコンセプト SMC MACD は、チャートのノイズを抑えながら 明確な構造的コンテキスト を提供することに重点を置いています。 MACD のモメンタムロジックは インジケーター内部に統合 され、 構造の解釈を補助するために使用されます。 チャート上に 追加の MACD インジケーターを表示する必要はありません 。 本インジケーターは、以下と組み合わせて使用することを想定しています: プライスアクション分析 上位時間足の構造 ユーザー定義の確認ルール 仕組み 本イン
Dear traders this is Our new Indicator called Hull Pro MTF Indicator — Precision Multi-Timeframe Trend Visualizer Overview The Hull Pro MTF Indicator is a next-generation Heiken-Ashi-based multi-timeframe visual tool designed for top-down market analysis . It blends the power of Hull Moving Average (HMA) logic and multi-level Heiken-Ashi smoothing to reveal directional bias, volatility ranges, and price symmetry across hourly, daily, weekly, monthly, and yearly structures — all in a single c
The   Trend Duration Forecast MT4   indicator is designed to estimate the probable lifespan of a bullish or bearish trend. Using a Hull Moving Average (HMA) to detect directional shifts, it tracks the duration of each historical trend and calculates an average to forecast how long the current trend is statistically likely to continue. This allows traders to visualize both real-time trend strength and potential exhaustion zones with exceptional clarity. KEY FEATURES Dynamic Trend Detection:   Uti
MACDivergence MTF
Pavel Zamoshnikov
4.29 (7)
Advanced ideas of the popular MACD indicator: It detects and displays classic and reverse divergences (three methods of detecting divergences). It uses different color to highlight an uptrend and a downtrend. Two methods of determining a trend: а) MACD crosses the 0 level (classic signal); б) MACD crosses its own average (early signal). This is a multi-timeframe indicator: it can display MACD data from other timeframes. Two methods of drawing: classic histogram and line. It generates sound and v
The indicator detects and displays Shark harmonic pattern (see the screenshot). The pattern is plotted by the extreme values of the ZigZag indicator (included in the resources, no need to install). After detecting the pattern, the indicator notifies of that by a pop-up window, a mobile notification and an email. The indicator highlights the process of the pattern formation and not just the complete pattern. In the former case, it is displayed in the contour triangles. After the pattern is comple
The Oscillator Trend indicators are most useful in identifying trend decay. Nobody canceled the divergence. Correct use of this signal will give you a certain head start in the market. When working in flat. The principle of operation of the oscillator is based on the measurement of fluctuations. The indicator tries to determine the maximum or minimum of the next swing - an exit from the overbought and oversold zones. Do not forget that these signals are most interesting at the borders of the fl
このプロダクトを購入した人は以下も購入しています
El indicador "MR BEAST ALERTAS DE LIQUIDEZ" es una herramienta avanzada diseñada para proporcionar señales y alertas sobre la liquidez del mercado basándose en una serie de indicadores técnicos y análisis de tendencias. Ideal para traders que buscan oportunidades de trading en función de la dinámica de precios y los niveles de volatilidad, este indicador ofrece una visualización clara y detallada en la ventana del gráfico de MetaTrader. Características Principales: Canal ATR Adaptativo: Calcula
Are you looking for a simple and reliable indicator that can help you spot market swing points easily? Do you want clear buy and sell signals that work on any timeframe and any trading instrument? Buy Sell Signal Pro is designed to do exactly that. It helps traders identify important market turning points and understand the current market structure in a clear and easy way. This indicator detects Higher Highs (HH), Higher Lows (HL), Lower Highs (LH), and Lower Lows (LL) so you can quickly see wh
このインジケーターは、反転ポイントと価格戻りゾーンを正確に表示します。     主要プレーヤー 。新たなトレンドが形成される場所を把握し、最大限の精度で意思決定を行い、すべての取引をコントロールします。 TREND LINES PRO インジケーターと組み合わせることで、その潜在能力を最大限に発揮します。 VERSION MT5 インジケーターが示す内容: 新しいトレンドの始まりに活性化する反転構造と反転レベル。 リスクと報酬の比率を最小限に抑えた利益 確定 と 損失停止の レベルの表示     RR 1:2   。 インテリジェントな削減ロジックによるストップロス。 指定されたインジケーターから 2 つのトレンド タイプの反転パターンを表示します。 指標: トレンドを追う   TREND LINES PRO   (世界的なトレンドの変化) TREND PRO   (クイックトレンド変更) シンプルで効果的   スキャナー   リアルタイムトレンド(新機能)。 マルチタイムフレームのインストゥルメント フィルタリング。 画面   利益     LOGIC AI信号の後。 当日プラス方
Miraculous Indicator – ガン・スクエア・オブ・ナインに基づく100%非リペイントのFXおよびバイナリーツール この動画では、FXおよびバイナリーオプションのトレーダー向けに特別に開発された、非常に正確で強力な取引ツールである Miraculous Indicator を紹介しています。このインジケーターがユニークなのは、伝説的な ガン・スクエア・オブ・ナイン と ガンの振動の法則 に基づいている点で、現代の取引で利用できる最も正確な予測ツールの一つとなっています。 Miraculous Indicatorは 完全に非リペイント であり、ローソク足が確定した後にシグナルが変化したり消えたりすることはありません。つまり、見たものがそのまま利用できます。これにより、トレーダーは自信を持ってエントリーおよびエグジットを行うための信頼性と一貫性のある根拠を得ることができます。 主な特徴: ガン・スクエア・オブ・ナインとガン理論に基づいて構築 100%非リペイントのシグナルシステム すべての時間枠(M1、M5、H1、H4、日足、週足)で機能 FXおよびバイナリーオプション取引
PRO Renko Systemは、特別にRENKOチャートを取引するために設計された高精度の取引システムです。 これは、様々な取引商品に適用することができる普遍的なシステムです。 システムは効果的に正確な逆転信号へのアクセスを与えるいわゆる市場の騒音を中和する。 表示器は非常に使いやすく、信号の生成に責任がある1つの変数だけがあります。 あなたは簡単にお好みの任意の取引ツールとレンコバーのサイズにツールを適応させることができます。 私はいつもあなたが私のソフトウェアで収益性の高い取引を支援するために余分なサポートを提供する準備ができています! 私はあなたに幸せで収益性の高い取引をしたいです! ご購入後にご連絡ください! 私はあなたに私のレンコチャートジェネレータを送信します。 私はまた、私の個人的な推奨事項やシステムの他のモジュールを無料で共有します!
Advanced Supply Demand
Bernhard Schweigert
4.91 (298)
現在40%オフ 初心者にもエキスパートトレーダーにも最適なソリューション このインジケーターは独自の機能と新しい公式を多数内蔵しており、ユニークで高品質かつ手頃な取引ツールです。このアップデートでは、2つの時間枠ゾーンを表示できるようになります。より長いTFだけでなく、チャートTFとより長いTF(ネストゾーンを表示)の両方を表示できます。すべてのSupply Demandトレーダーの皆さんのお気に召すはずです。:) 重要情報の公開 Advanced Supply Demandの可能性を最大化するには、 https://www.mql5.com/ja/blogs/post/720245 にアクセスしてください。   エントリーまたはターゲットの正確なトリガーポイントを正確に特定できれば取引がどのように改善されるか想像してみてください。新しい基盤となるアルゴリズムに基づいて構築されているため、買い手と売り手の間の潜在的な不均衡をさらに簡単に特定できます。これは、最も強い需要と供給のゾーンと、過去のパフォーマンス(古いゾーンを表示)がグラフィカルに表現されるためです。これらの機能は、最適な
An exclusive indicator that utilizes an innovative algorithm to swiftly and accurately determine the market trend. The indicator automatically calculates opening, closing, and profit levels, providing detailed trading statistics. With these features, you can choose the most appropriate trading instrument for the current market conditions. Additionally, you can easily integrate your own arrow indicators into Scalper Inside Pro to quickly evaluate their statistics and profitability. Scalper Inside
トレンドラインプロ   市場の真の方向転換点を理解するのに役立ちます。この指標は、真のトレンド反転と主要プレーヤーが再び参入するポイントを示します。 分かりますか     BOSライン   複雑な設定や不要なノイズなしに、より長い時間足でのトレンドの変化と重要なレベルを把握できます。シグナルは再描画されず、バーが閉じた後もチャート上に残ります。 VERSION MT 5     -     RFI LEVELS PRO インジケーター と組み合わせることで、その潜在能力を最大限に発揮します。 インジケーターが示す内容: 本当の変化   トレンド(BOSライン) 一度シグナルが現れたら、それは有効です!これは、リペイント機能を持つインジケーターとの重要な違いです。リペイント機能を持つインジケーターは、シグナルを発した後、それを変更し、資金の損失につながる可能性があります。これにより、より高い確率と精度で市場に参入できます。また、矢印が現れた後、目標値(利益確定)に達するか、反転シグナルが現れるまで、ローソク足の色を変更する機能もあります。 繰り返しエントリ       主要プレーヤーの
Precautions for subscribing to indicator This indicator only supports the computer version of MT4 Does not support MT5, mobile phones, tablets The indicator only shows the day's entry arrow The previous history arrow will not be displayed (Live broadcast is for demonstration) The indicator is a trading aid Is not a EA automatic trading No copy trading function The indicator only indicates the entry position No exit (target profit)  The entry stop loss point is set at 30-50 PIPS Or the front hi
現在40%OFF! 初心者やエキスパートトレーダーのためのベストソリューション! このダッシュボードソフトウェアは、28の通貨ペアで動作しています。それは私達の主要な指標(高度な通貨の強さ28と高度な通貨インパルス)の2に基づいています。それは全体の外国為替市場の大きい概観を与えます。それは、すべての(9)時間枠で28の外国為替ペアのための高度な通貨の強さの値、通貨の動きの速度と信号を示しています。チャート上で1つのインディケータを使用して市場全体を観察し、トレンドやスキャルピングの機会をピンポイントで見つけることができたら、あなたのトレードがどのように改善されるか想像してみてください。 このインディケータには、強い通貨と弱い通貨の識別、潜在的な取引の識別と確認がより簡単になるような機能が搭載されています。このインディケータは、通貨の強さや弱さが増加しているか減少しているか、また、すべての時間枠でどのように機能しているかをグラフィカルに表示します。 新機能として、現在の市場環境の変化に適応するダイナミックなマーケットフィボナッチレベルが追加され、すでに当社のAdvanced
PairMaster Buy Sell Arrow Indicator for MT4 Trade Reversals Like a Pro — Catch Every Swing Point with Precision The PairMaster Buy Sell Arrow Indicator is a powerful MetaTrader 4 tool built to identify high-probability swing trading opportunities . Designed for traders who value accuracy, clarity, and simplicity, PairMaster detects key market turning points and plots intuitive buy and sell arrows directly on your chart. Key Features Accurate Swing Point Detection – Automatically identifies ma
現在40%オフ 初心者やエキスパートトレーダーに最適なソリューション! このインジケーターは、独自の機能と新しい計算式を取り入れた、ユニークで高品質、かつ手頃な価格のトレーディングツールです。たった1枚のチャートで28の為替ペアの通貨強度を読み取ることができます。新しいトレンドやスキャルピングチャンスの引き金となるポイントを正確に特定することができるので、あなたのトレードがどのように改善されるか想像してみてください。 ユーザーマニュアルはこちら  https://www.mql5.com/en/blogs/post/697384 これが最初の1本、オリジナルだ! 価値のないクローンを買わないでください。 特別な サブウィンドウの矢印で強い通貨の勢いを表示 GAPがあなたのトレードを導く! 基準通貨や気配値が売られすぎ・買われすぎのゾーン(外相フィボナッチレベル)にあるとき、個別チャートのメインウィンドウに警告表示。 通貨がレンジの外側から反落した場合、プルバック/リバーサルのアラート。 クロスパターンの特別なアラート 複数の時間枠を選択可能で、トレンドを素早く確認できます
Volatility Trend System - a trading system that gives signals for entries. The volatility system gives linear and point signals in the direction of the trend, as well as signals to exit it, without redrawing and delays. The trend indicator monitors the direction of the medium-term trend, shows the direction and its change. The signal indicator is based on changes in volatility and shows market entries. The indicator is equipped with several types of alerts. Can be applied to various trading ins
通貨強さウィザードは、取引を成功させるためのオールインワン ソリューションを提供する非常に強力な指標です。このインジケーターは、複数の時間枠のすべての通貨のデータを使用して、このまたはその外国為替ペアのパワーを計算します。このデータは、使いやすい通貨インデックスと通貨パワーラインの形式で表され、特定の通貨のパワーを確認するために使用できます。 必要なのは、取引したいチャートにインジケーターを接続することだけです。インジケーターは、取引する通貨の実際の強さを示します。このインジケーターは、トレンドに合わせて取引するときに有利に利用できる売買高の圧力の極値も示します。このインジケーターには、フィボナッチに基づく可能なターゲットも表示されます。 このインジケーターは、PUSH 通知を含むあらゆるタイプのアラートを提供します。 購入後ご連絡下さい。私の取引のヒントをあなたと共有し、素晴らしいボーナスインジケーターを無料で提供します! 幸せで有益な取引をお祈りします。
Dynamic Forex28 Navigator - 次世代の Forex 取引ツール。 現在 49% オフ。 Dynamic Forex28 Navigator は、長年人気のインジケーターを進化させたもので、3 つの機能を 1 つにまとめています。 Advanced Currency Strength28 インジケーター (レビュー 695 件)  + Advanced Currency IMPULSE with ALERT (レビュー 520 件) + CS28 コンボ シグナル (ボーナス)。 インジケーターの詳細 https://www.mql5.com/en/blogs/post/758844 次世代の Strength インジケーターが提供するもの  オリジナルで気に入っていたすべての機能が、新機能と精度の向上によって強化されました。 主な機能: 独自の通貨強度計算式。 すべての時間枠でスムーズかつ正確な強度ライン。 トレンドの特定と正確なエントリーに最適です。 ダイナミックマーケットフィボナッチレベル (マーケットフィボナッチ)。 このインジケーターに固有
Trend indicator AI
Ramil Minniakhmetov
4.57 (82)
Trend Ai indicatorは、トレンドの識別と実用的なエントリポイントと反転アラートを組み合わせることで、トレーダーの市場分析を強化する優れたツールです。 この指標は、ユーザーが自信と正確さで外国為替市場の複雑さをナビゲートすることを可能にします トレンドAiインジケーターは、主要なシグナル以外にも、プルバックやリトレースメント中に発生するセカンダリエントリポイントを識別し、トレーダーが確立されたトレンド内の価格修正を活用できるようにします。 重要な利点: *MT4およびMT5の仕事 *明確な買いまたは売りシグナル *再描画しません ·すべての資産で動作します 私はeaやセットをtelegram it詐欺で販売しないように注意してください。 すべての設定はここでブログで無料です。  重要! 指示とボーナスを得るために購入後すぐに私に連絡してください! 私の他のプロダクトと同様、実質操作の監視はここに見つけることができます: https://www.mql5.com/en/users/mechanic/seller&nbsp ; 設定および入力: すべての
現在40%オフ! 初心者やエキスパートトレーダーに最適なソリューション! このインジケータは、独自の機能と秘密の数式を組み込んだ、ユニークで高品質かつ手頃な価格のトレーディングツールです。たった1枚のチャートで28の通貨ペアのアラートを表示します。新しいトレンドやスキャルピングチャンスの引き金となるポイントを正確に把握することができるので、あなたのトレードがどのように改善されるか想像してみてください! 新しい基本的なアルゴリズムに基づいて構築されているため、潜在的な取引の特定と確認がより簡単になります。これは、通貨の強さや弱さが加速しているかどうかをグラフィカルに表示し、その加速のスピードを測定するためです。加速すると物事は明らかに速く進みますが、これはFX市場でも同じです。つまり、反対方向に加速している通貨をペアにすれば、利益を生む可能性のある取引を特定することができるのです。 通貨の勢いを示す縦の線と矢印は、あなたの取引の指針となるでしょう。 ダイナミックマーケットフィボナッチ23レベルはアラートトリガーとして使用され、市場の動きに適応します。もしインパルスが黄色のトリガ
FX Power: 通貨の強弱を分析して、より賢い取引を実現 概要 FX Power は主要通貨と金の実際の強弱をあらゆる市場状況で理解するための必須ツールです。強い通貨を買い、弱い通貨を売ることで、 FX Power は取引の意思決定を簡素化し、高い確率の取引機会を見出します。トレンドを追従する場合でも、極端なデルタ値を使用して反転を予測する場合でも、このツールはあなたの取引スタイルに完全に適応します。ただ取引するだけではなく、 FX Power で賢く取引をしましょう。 1. なぜ FX Power がトレーダーにとって非常に有益なのか 通貨と金のリアルタイム強弱分析 • FX Power は主要通貨と金の相対的な強弱を計算し、マーケットダイナミクスに関する明確な洞察を提供します。 • どの資産がリードしているか、または後れを取っているかを監視して、取引するペアを賢く選びましょう。 マルチタイムフレームの包括的なビュー • 短期、中期、長期のタイムフレームで通貨と金の強弱を追跡し、マーケットトレンドに基づいて取引戦略を調整できます。 • スキャルピングからスイングトレード
KT Trend Trading Suite は、トレンドフォロー戦略と複数のブレイクアウトポイントを組み合わせた多機能インジケーターです。 新たなトレンドが形成されると、このインジケーターは複数のエントリーチャンスを提供し、トレンドにうまく乗ることが可能になります。あまり重要でないエントリーポイントを避けるために、プルバックの閾値が使用されます。 MT5 バージョンはこちらで入手可能です  https://www.mql5.com/en/market/product/46270 機能 市場のさまざまなダイナミクスを1つの方程式にまとめ、トレンドの全体像を明確に描写します。 エントリーシグナルに基づいて、局所的な高値と安値を視覚的に示す長方形を描画します。 シグナルの精度を自動的に測定し、パフォーマンス指標をシンプルに表示します。 複数時間足対応のダッシュボードを搭載し、すべての時間軸をスキャンして、それぞれのトレンド方向を表示します。 入力パラメータ History Bars:   過去のシグナル分析に使用する履歴バーの数。  Signals Period:   エントリ
現在20%OFF! 初心者やエキスパートトレーダーに最適なソリューションです。 このインディケータは、エキゾチックペア・コモディティ・インデックス・先物など、あらゆるシンボルの通貨の強さを表示することに特化したインディケータです。金、銀、原油、DAX、US30、MXN、TRY、CNHなどの通貨の強さを表示するために、9行目にどのシンボルでも追加することができます。独自の機能を多数搭載し、新しい計算式を採用したため、ユニークで高品質、かつ手頃な価格のトレーディングツールとなっています。新しいトレンドやスキャルピングチャンスのトリガーポイントを正確に把握することができるため、あなたのトレードがどのように改善されるか想像してみてください。 ユーザーマニュアル:ここをクリック   https://www.mql5.com/en/blogs/post/708876 すべての時間枠に対応します。あなたはすぐにトレンドを見ることができるようになります! 新しいアルゴリズムに基づいて設計されているため、潜在的な取引の特定と確認がより簡単になります。これは、8つの主要通貨と1つのシンボルの強弱
GM Arrows Pro
Guillaume Pierre Philippe Mesplont
Product Name: GM Arrows Pro – Signals & Alerts Short Description: GM Arrows Pro is a clean, reliable MT4 indicator showing BUY/SELL arrows on the chart with unique alerts at the moment the signal appears. Full Description: GM Arrows Pro is a professional MT4 indicator designed for traders who want clear, actionable signals: BUY and SELL arrows visible on the entire chart history Unique alerts when a new signal appears (no repeated alerts) Option to disable repetitive signals ( disable_repeatin
System Trend Pro - This is the best trend trading indicator!!! The indicator no repaint!!!  The indicator has   MTF   mode, which adds confidence to trading on the trend (   no repaint   ). How to trade? Everything is very simple, we wait for the first signal (big arrow), then wait for the second signal (small arrow) and enter the market in the direction of the arrow. (See screens 1 and 2.) Exit on the opposite signal or take 20-30 pips, close half of it, and keep the rest until the opposite
Meravith
Ivan Stefanov
5 (3)
マーケットメーカーのためのツール。 Meravith は次の機能を提供します: すべての時間足を分析し、現在有効なトレンドを表示します。 強気と弱気の出来高が等しくなる流動性ゾーン(出来高均衡)を強調表示します。 異なる時間足のすべての流動性レベルをチャート上に直接表示します。 テキスト形式の市場分析を生成し、参考情報として表示します。 現在のトレンドに基づいて目標値、サポートレベル、ストップロスを計算します。 取引のリスクリワード比を算出します。 口座残高に基づいてポジションサイズを計算し、潜在的な利益を推定します。 また、市場に大きな変化があった場合には警告を表示します。 インジケーターの主要ライン: 強気/弱気の出来高エグゾーストライン ― 目標値として機能します。 市場のトレンドを示すライン。市場が強気か弱気かによって色が変わり、トレンドのサポートとして機能します。主にその色が市場センチメントを示します。 出来高均衡ライン(Eq)。Eq(Volume Equilibrium)ラインはシステムの中核です。これは買い手と売り手の出来高のバランスポイントを表します。市場の流動性を示し
Candle Power Pro
Thushara Dissanayake
4.5 (8)
その   キャンドルパワープロ   は、解読するために設計された洗練された取引ツールです。     実ボリューム圧力、ティックデータの不均衡、機関投資家の注文フローのダイナミクス   測定することにより   強気相場と弱気相場の戦い   リアルタイムでこの指標は生の   ボリュームデータを実用的な洞察に 変換し、トレーダーが   スマートマネーの動き、流動性ハンティング、そして隠れた市場心理   各価格ローソク足の裏にあるものを分析することで   買い手/売り手の取引量の割合、乖離パターン、取引量に基づく確認など 、     価格行動とボリューム分析は 、トレーダーにとって非常に貴重です。       ICT、SMC、および機関投資家向け取引手法 。 従来のボリュームインジケーターとは異なり、     キャンドルパワープロ   焦点を当てる   ティックデータの粒度は 、各ローソク足の動きが基礎となる   強気/弱気の強さ   または潜在的な   マーケットメーカーの罠、反転、またはブレイクアウトの継続を 予測します。     セッションベースの戦略(ロンドン/ニューヨークのキルゾー
チャートを構成し、周期的な価格変動を識別するテクニカル指標。 どのチャートでも動作します。 いくつかの種類の通知。 グラフ自体に追加の矢印があります。 履歴を再描画せずに、キャンドルのクローズに取り組みます。 M5以上のTFを推奨します。 パラメータの使用と設定が簡単です。 異なるパラメータを持つ 2 つのインジケーターを使用する場合、他のインジケーターなしで使用できます。 入力パラメータは2つあります 周期性と信号持続時間 これら 2 つのパラメータは、チャート構造の処理を扱います。 Cyclicity - 反転サイクルが変化する頻度を調整し、サイクルを滑らかにします。 Signal duration - 最小数では価格変動の衝動を検出し、最大数では長期的なトレンドの動きを検出します。
Quant Impulse Signal – リペイントなし、バックペインティングなし Quant Impulse Signalは、高値と安値の指数移動平均線を比較して市場の転換点を強調する高精度ツールです。リアルタイムの価格変動に反応し、確認された方向転換に基づく明確なエントリーシグナルを提供します。 ロジック このインジケーターは、すべてのタイムフレームで各ローソク足の高値と安値に対して8期間EMAを計算し、現在の価格をそれらのEMAと比較します。始値と終値が高値EMAの上にあり、価格が前のローソク足の高値を上回ると買いシグナルが発生します。逆に、始値と終値が安値EMAの下にあり、価格が前のローソク足の安値を下回ると売りシグナルが発生します。この二重フィルター方式により、本物の強弱を捉えたシグナルを提供します。 シグナル生成 矢印は、直近10本のローソク足の平均真値幅(ATR)の0.2倍の距離にプロットされます。この動的配置により、ボラティリティにかかわらず視覚的一貫性が保たれます。矢印の文字コードや色はチャートのスタイルに合わせてカスタマイズ可能です。 マルチタイムフレーム対応
発見が困難で頻度が少ないため、分岐は最も信頼できる取引シナリオの1つです。このインジケーターは、お気に入りのオシレーターを使用して、通常の隠れた分岐点を自動的に見つけてスキャンします。 [ インストールガイド | 更新ガイド | トラブルシューティング | よくある質問 | すべての製品 ] 取引が簡単 通常の隠れた発散を見つけます 多くのよく知られている発振器をサポート ブレイクアウトに基づいて取引シグナルを実装します 適切なストップロスおよび利益レベルを表示します 設定可能なオシレーターパラメーター カスタマイズ可能な色とサイズ バー単位でサイズ別に分岐をフィルタリング パフォーマンス統計を実装します 電子メール/音声/視覚アラートを実装します 幅広い市場の見通しを提供するために、異なるオシレーターを使用して、干渉なしで同じチャートにインジケーターを何度もロードできます。このインジケーターは、次のオシレーターをサポートしています。 RSI CCI MACD オスマ 確率的 勢い 素晴らしい発振器 加速器発振器 ウィリアムズパーセントレンジ 相対活力指数 特に外国為替市場では、
Advanced version of CyberZingFx Volume Plus, the ultimate MT4 indicator for traders seeking highly accurate buy and sell signals. With an additional strategy and price action dot signals that enhances its effectiveness, this indicator offers a superior trading experience for professionals and beginners alike. The CyberZingFx Volume Plus Advanced version combines the power of volume analysis and historical price data with an additional strategy, resulting in even more precise and reliable signals
OFFER OFFER! The price of the indicator is kept at 75 dollars only from 20th Feb to 28th Feb. Full Fledged EA and Alert plus for alerts will also be provided in this offer along with the purchase of Indicator. Limited copies only at this price and Ea too. Grab your copy soon Alert plus for indicator with set file is kept in comment section with the image  SMC Blast Signal with FVG, BOS and trend Breakout The SMC Blast Signal is a Precise trading system for Meta Trader 4 that uses Smart Money Con
「 Dynamic Scalper System 」インジケーターは、トレンド波の中でスキャルピング取引を行う手法のために設計されています。 主要通貨ペアと金でテスト済みで、他の取引商品との互換性があります。 トレンドに沿った短期的なポジションオープンのシグナルを提供し、追加の価格変動サポートも提供します。 インジケーターの原理 大きな矢印はトレンドの方向を決定します。 トレンド波の中では、小さな矢印の形でスキャルピングシグナルを生成するアルゴリズムが機能します。 赤い矢印は強気方向、青い矢印は弱気方向です。 トレンドの方向には敏感な価格変動ラインが描かれ、小さな矢印のシグナルと連動します。 シグナルは次のように機能します。適切なタイミングでラインが現れるとエントリーシグナルが形成され、ラインが開いている間はポジションが保持され、完了すると取引が終了します。 推奨される動作時間枠はM1~H4です。 矢印は現在のローソク足に形成され、次のローソク足が開いている場合は、前のローソク足の矢印は再描画されません。 入力パラメータ Trend Wave Period - トレンド方向
作者のその他のプロダクト
XL Arrow is a signal indicator that displays market entry points. The red arrow and the DOWN signal at the right corner indicate it is time to sell, while the blue arrow and the UP signal indicate it is time to buy. Settings PeriodSlower - indicator slowing period. PeriodFaster - indicator acceleration period. Recommendations trading pairs: EURUSD, GBPUSD and USDJPY timeframes: M5 - H4
Entry Point M5 — 完全なトレーディングシステム Entry Point M5 は、あらゆる通貨ペアに対応する 高性能なトレーディングシステム型インジケーター です。価格構造を分析し、市場の反転ポイントや新しいトレンドの発生を正確に特定します。強いトレンド相場からレンジ相場まで、さまざまな市場局面に自動適応し、追加のフィルターや補助ツールを使わずに明確で視覚的なシグナルを提供します。 このシステムでの取引は非常にシンプルです。 緑の矢印 が表示されたら**買いポジション(Buy)**を開きます。 赤い矢印 が表示されたら、すべての買いポジションをクローズし、 売りポジション(Sell) を開きます。次に再び緑の矢印が表示されたら、すべての売りをクローズし、新たに買いを開きます。こうしてインジケーターは、主観的な判断を必要とせず、シグナルに従うだけで機能する 完全なトレーディングシステム を構築します。 Entry Point M5 は、M1、M5、M15、H1 などの多くのタイムフレームや、すべての通貨ペアで使用できます。内部の適応アルゴリズムにより、各銘柄のボラティリテ
Attention! Friends, since there have been many scammers on the Internet recently selling indicators called ForexGump, we decided to warn you that only on our page is the LICENSE AUTHOR'S VERSION of the INDICATOR sold! We do not sell this indicator on other sites at a price lower than this! All indicators are sold cheaper - fakes! And even more often sold demo versions that stop working in a week! Therefore, in order not to risk your money, buy this indicator only on this site! Forex Gump Scalpin
Attention! Friends, since there have been many scammers on the Internet recently selling indicators called ForexGump, we decided to warn you that only on our page is the LICENSE AUTHOR'S VERSION of the INDICATOR sold! We do not sell this indicator on other sites at a price lower than this! All indicators are sold cheaper - fakes! And even more often sold demo versions that stop working in a week! Therefore, in order not to risk your money, buy this indicator only on this site! Forex Gump Pro is
The Quantum Expert Advisor is designed for trading EURUSD H1 . The trading algorithm lies in placing pending orders at the peaks of currency fluctuations, after a preliminary analysis of the market conditions. Trading is fully automated. Lot size is calculated automatically based on the lot percentage. Parameters MaxRisk - percentage of the deposit, used for the automatic calculation of the lot. LongWave - long wave of price fluctuation. ShortWave - short wave of price fluctuation. Level contro
The BoxetFx Expert Advisor analyzes the market using multiple trading strategies. Once the optimal signals for opening trades are obtained, the EA automatically determines the order volume as a percentage pf the deposit. Next, a pending order is placed in the direction of the expected price movement. When the deal reaches an optimal profit or loss level, it is automatically closed. Multiple analytical centers of information processing allow the EA to diversify the possible risks of the trader by
The Medok indicator shows the market entry and exit points on the chart using arrows and resistance lines. The indicator is very easy to use. Buy when a blue arrow appears and sell when a red arrow appears. After an order is opened, it is recommended to close a buy position when the price reaches the lower resistance level or to close a sell position when the price reaches the upper resistance level. Recommended values for EURUSD H1 Periods - 2; Acceleration - 0.02. Recommended values for EURU
TOP Xios is a ready-made trading system, which provides the trader with signals for opening and closing deals. The information panel in the right corner of the screen shows the total number of signals, the number of points in profit or loss and the percentage of valid and false signals. Working with this indicator is very simple. As soon as a blue arrow appears, open a buy deal and wait for a red cross to appear, which indicates the necessity to close the deal. When a red arrow appears, open a s
Buy Market Scanner is a ready-made trading system, which shows the moments when it is necessary to open or close deals. Buy arrows appear on the zero bar without delay and redrawing. The same applies to signals for closing orders. They appear on the zero bar and are not redrawn. The number of profit or loss in points for a certain time period is displayed in the top right corner of the indicator. The indicator works best on the EURUSD currency pair with the H1 timeframe. Operation Principles In
The DayWay indicator shows the current trend direction on the chart as a colored line. The best timeframes for operation are M5 and higher. Works on all currency pairs. Suitable for any scalping strategies. Quite easy to use. Recommendations on usage When a blue line appears, wait for a candle to close and open a buy order. When a red line appears, wait for the current candle to close and open a sell order. Parameters Periods - period of the indicator.
Forex Gump
Andrey Kozak
2.4 (5)
Forex Gump is a fully finished semi-automatic trading system. In the form of arrows, signals are displayed on the screen for opening and closing deals. All you need is to follow the instructions of the indicator. When the indicator shows a blue arrow, you need to open a buy order. When the indicator shows a red arrow, you need to open a sell order. Close orders when the indicator draws a yellow cross. In order to get the most effective result, we recommend using the timeframes H1, H4, D1. There
Leo Trend is a signal indicator that shows the market entry points, as well as the trend direction and flat on the chart in the form of arrows and lines. Leo Trend will be useful both for beginners creating a trading strategy, and for professionals to integrate into ready-made trading systems. Leo Trend works without redrawing and without significant delays. The operation of the indicator is demonstrated in the video. In addition, you can test this indicator in the strategy tester free of charge
NIZMA is a ready-made trading system, that is the most efficient on the EURUSD, AUDUSD and GBPUSD currency pairs. The best timeframes are M5 and higher. The system shows the market entry points in the form of arrows, and also displays the information on the strength and direction of the trend. The signals are easy to interpret. It is suitable for both novice and professional traders. With the properly selected settings, it gives the minimum number of false signals. In tests, this number did not
XPointer is a completely ready trading system. It shows the trader when to open and close a trade. It works on all currency pairs and all time frames. Very easy to use and does not require additional indicators for its operation. Even a beginner trader can start working with XPointer. But it will also be useful for professional traders to confirm the opening of orders. Features of the XPointer indicator It does not redraw its values. It works on all currency pairs and all time frames. It has al
Lobster is a ready-made trading system with a flexible market analysis algorithm. It performs most of the work for a trader. All you have to do is open and close orders following the indicator signals. The indicator will be very useful for both beginners and professionals. It is able to work with other indicators and independently. Features No signal repainting; Any pair; Any timeframe; Flexible market analysis system. How to trade When the blue arrow appears, open a buy order; When the blue c
Gets is a smart trading system with complex market analysis mechanism. The operation principle of Gets is based on neural networks and diversified collection of information from various market analyzers. Then the system analyzes the statistical databases to create a general idea of the current market situation and the further price movement. The information is displayed on the screen in a simple and intuitive way - in the form of buy and sell arrows. Also, the information on the current trend st
Scalper Zoom is a new trading system designed to facilitate the process of Forex trading both for beginners and professionals. The Scalper Zoom indicator uses an adaptive method of operation and analyzes the market using multiple trading algorithms, while selecting the most efficient one for the given currency pair and timeframe. Working with this indicator is very simple. When a red vertical line appears, open a sell order. Close it when a blue vertical line appears. Follow the opposite steps f
Brabux is a ready-made mechanical trading system. It works on all currency pairs and timeframes automatically adjusting to them. It also selects the most efficient trading parameters for receiving a necessary profit. In the indicator parameters, specify the trading period used for calculations and the least acceptable profit in points. Next, the system automatically selects the necessary trading parameters. Trading data is displayed on the info panel. After setting the indicator on the chart and
CoolLine is a signal indicator displaying on a chart points for opening and closing trade positions. The indicator signals are not redrawn. It draws arrows on the zero bar Open[0]. It works on all currency pairs and all time frames. Indicator Advantages Precisely shows the opening and closing points on the chart Does not redraw signals Works on all currency pairs and timeframes Very easy to use; suitable even for beginners Has a very flexible system of settings Can send push and email notificat
Market Scanner Elite is a new generation of indicators of the Market Scanner series. The Elite version features an improved market analysis algorithm, with a better identification of the entry points and filtering of the false signals. The logic of market analysis and calculation of effective entry points applied in this product are significantly different from those applied in Market Scanner . This indicator cannot be called a big brother, as it is a completely new product with innovative analy
The Master Figures indicator analyzed the market for the most common chart patterns. The first pattern is called Pin bar . This pattern can rightly be considered one of the most widespread. This pattern looks like a candle with a small body and large tail (wick). Once you see it on the chart, open a position against the wick. It is better to use the resistance lines for closing. Master Figures shows this pattern in the form of circles. A position should be opened when a new candle appears after
Market Trend - a comprehensive system for determining the trend direction. Analyzes the market using a formula which considers the values of multiple technical indicators and other trading strategies. IT determines not only the current trend direction, but also its movement strength. The indicator is intuitive and very easy to use. The information on the current trend direction and its movement strength are displayed on the chart. If the indicator shows "UP!" then an uptrend is currently present
Aggressive intraday scalper is a mechanical system for intraday scalping, which displays trade opening and closing signals as arrows on the chart. When a signal emerges, the indicator sends email and push notifications. So, you don't have to stay by the monitor analyzing the market and waiting for a signal. Aggressive intraday scalper will do it for you. The system has been developed for those traders who do not have their own trading system and who would love to quickly start trading using the
Jerus Line Scalper is an indicator for scalping on EURUSD, GBPUSD, AUDUSD, USDJPY and USDCAD pairs. Recommended pairs: M5, M15, M30 and H1. The trading strategy is as follows: as soon as the arrow appears, open an order in the direction of the arrow and set take profit to +10 points. Set stop loss at the indicator's stop line. Stop line is displayed in red or blue depending on the indicator signal. Also, the Martingale system can be applied in the system. If a trade is closed at a loss, the next
DotaScalping is a semi-automated trading system for scalping. The indicator shows recommended moments for opening Buy/Sell trades as dots on the chart. Signals are generated based on the algorithm for price amplitude smoothing. The indicator tries to accurately calculate the moments of the maximum peak price values ​​and produces signals based on the smoothed correlation. The indicator determines the High and Low price values and generates signals based on the trend direction. The indicator is v
ForexGumpUltra is a new and more advanced indicator of the ForexGump series. This indicator easily determines the price direction on any currency pair and any timeframe. The indicator draws its signals on the zero bar and does not redraw them (see the video). In the 34th second of the video it can be seen that this indicator uses new filters to determine the changes in price movement direction without delay, despite the market noise present at the moment (see the video on the 34th second). Once
Bomb Scalper is a ready-made mechanical trading system that analyzes the market using 12 market signals, as well as candle patterns, providing signals for opening and closing trades. On the screenshot below, you can see how the system draws the blue arrow for buying and the red one for selling. Order close signal is shown as the yellow arrow. Besides, during a closing signal, the indicator calculates potential profit/loss. How the indicator works After launching, Bomb Scalper navigates through
Stiker is a robot capable of trading in automatic or semi-automatic mode . If auto=true in the robot settings, the robot automatically opens and closes orders on its own when a signal appears. If auto=false, the robot analyzes the market and shows signals on the screen, while a trader manually confirms opening or closing orders by clicking the Open Buy and Close Order buttons. This is done to enable traders make trading decisions themselves. This reduces the trading risk. Striker is a smart syst
If you do not yet have your trading strategy, you can take advantage of our ready-made trading strategy, which is most effective for EURUSD H1 currency pair. The indicator "Ready Made Scalping System" automatically analyzes the market and shows the trader when to open and close orders. You just need to follow his instructions. When the arrow appears - open the order, when a square appears with a tick - close the warrant. For convenience of the trader, the indicator when signals appear sends a m
Amok is a fully automatic trading system that was developed for trading on the EURUSD currency pair, H1 timeframe on micro accounts. Nevertheless, as practice shows, this trading system works well in other currency pairs. Principle of work of the trading robot Amok In the algorithm of the robot, there are more than 7 different trading strategies. This was done to ensure that the robot could work more stably in different market conditions. The program part of the robot uses 12 different indicato
フィルタ:
レビューなし
レビューに返信