MACD CloseBars
- インディケータ
-
Dmitriy Moshnin
 Торговать нужно так, чтобы не было мучительно больно за бесцельно вложенные деньги...
 - バージョン: 1.1
- アップデート済み: 17 11月 2021
- アクティベーション: 5
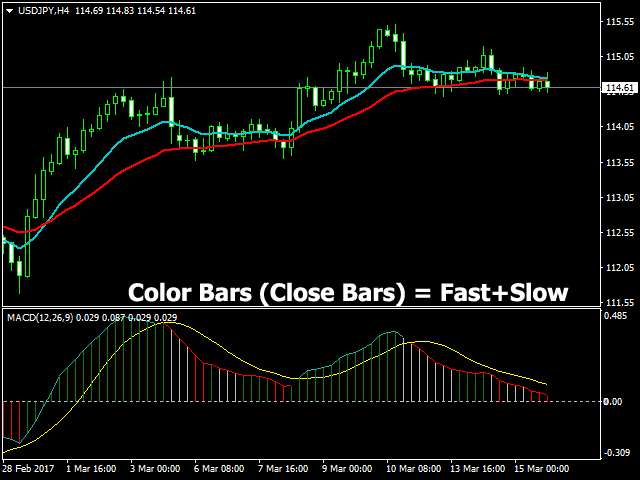
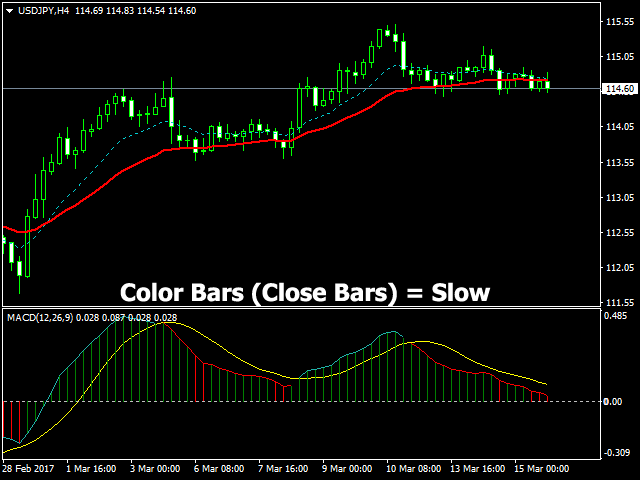
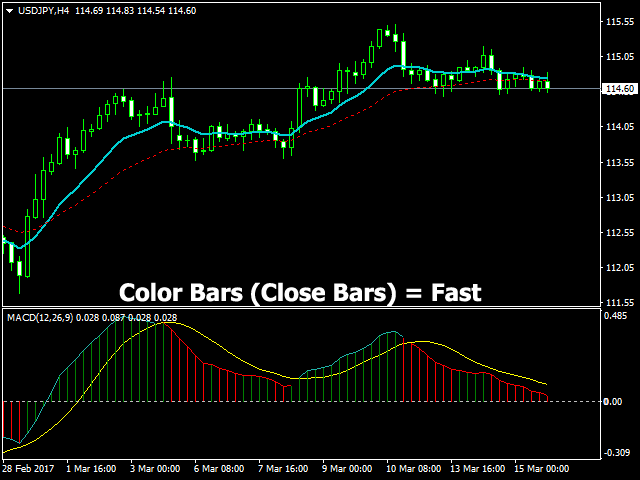
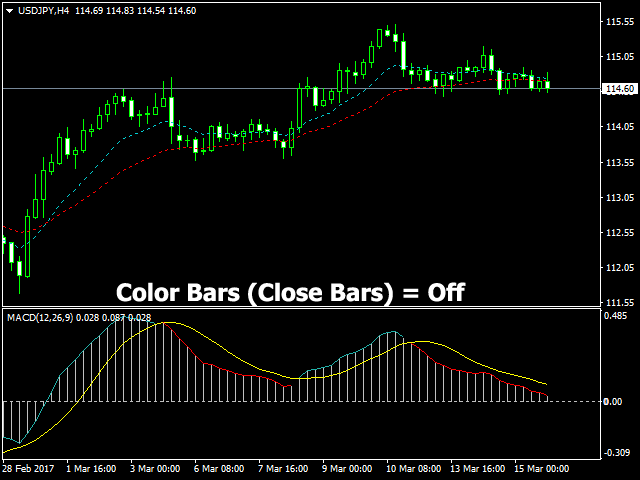
The MACD CloseBars indicator is a trading system based on the MACD indicator popular among many traders, which is built on the principle of bars closing above the moving averages selected in the indicator settings. The signal for entering/exiting the market is the frame of the bars colors according to the trend: in case the bars in the main window of the chart are closed above/below the Fast Moving Average, Slow Moving Average individually or both together.
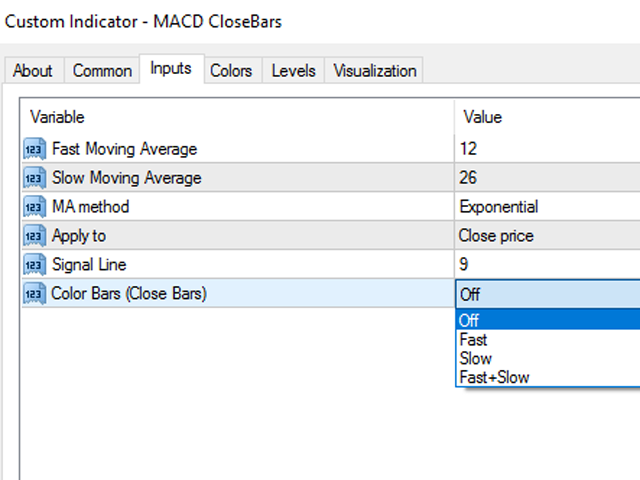
Indicator Parameters
- Fast Moving Average - period of the fast moving average;
- Slow Moving Average - period of the slow moving average;
- MA method - averaging method of the moving averages (simple averaging, exponential, smoothed and linear-weighted);
- apply to - applied price of the moving averages (Close, Open, High for the period, Low for the period, Median, Typical and Linear-Weighted);
- Signal Line - period of the signal line;
- Color Bars (CloseBars) - parameter changes the color of the indicator bars in case the bars in the main window of the chart are closed above/below the Fast/Slow Moving Average.
More functional versions of the indicator: MACD Message and MACD Converter.
Happy Trading!

ユーザーは評価に対して何もコメントを残しませんでした