Price Elevator MT4
- インディケータ
- バージョン: 1.3
- アクティベーション: 5

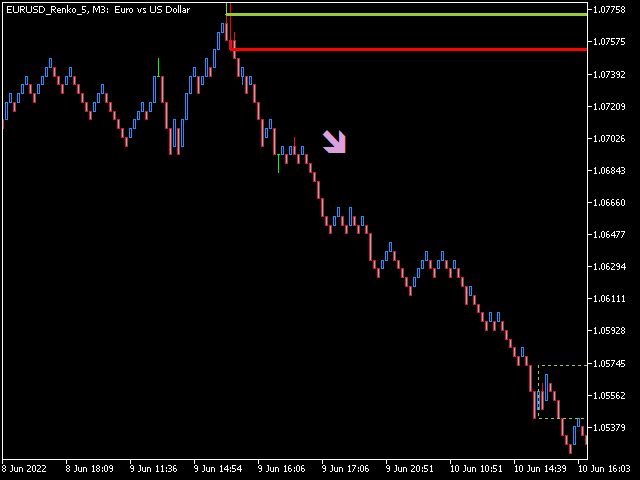
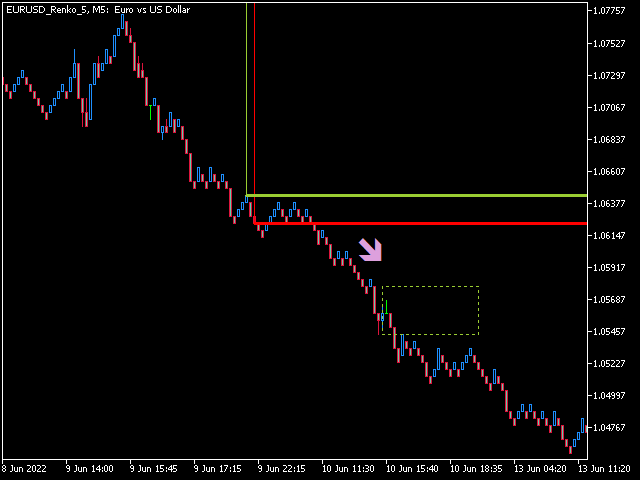
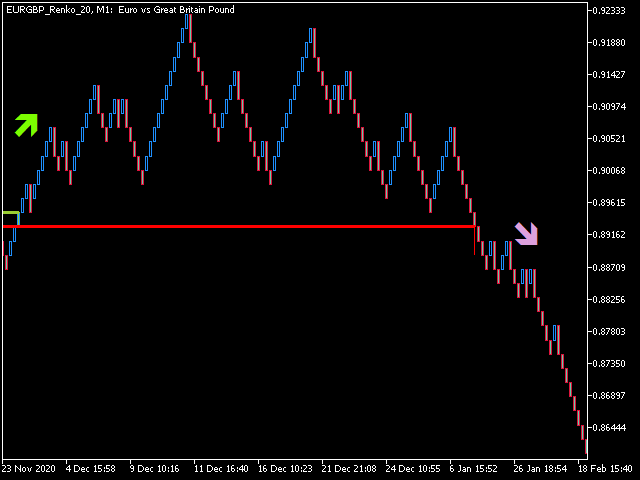
The Price Elevator indicator is developed to help you figure out the general long-term trend of the market. If the price is above the Green separator line, this is a clear indication the bulls are in control. Similarly, the bears are in control if the price continues to trend below the red separator line.
Trend Re-entry
In this case you would plan your buy entries above the green dotted box (make sure to set the Buy / Sell Retracement Floor=30). The SL should be placed below the immediate low. Sell when the red dotted box appears below the red separator and place the SL above the previous high. You can also use any other indicator or Fibonacci for your re-entry.
If you use Fibonacci, 100% retracement should be on the red /green separator line. If you want to open sells using fibo wait for the price to hit 50% mark, and then draw a rectangle between 61.8 and 38.2 lines. Go short if the price falls below the rectangle and place SL above the rectangle. Same logic applies when opening buys but your base line is the greed separator.
Trend Exhaustion
Alternatively if you want to know when the trend is almost coming to exhaustion, set the Buy / Sell Retracement Floor=80 to 95. Price will most likely retreat after pushing higher above the green dotted box or below the red dotted box.
The Price Elevator indicator is best suited to work with Renko Charts where the noise is greatly reduced.