Trend Support Resistance
- インディケータ
- バージョン: 1.11
- アップデート済み: 6 9月 2022
- アクティベーション: 5

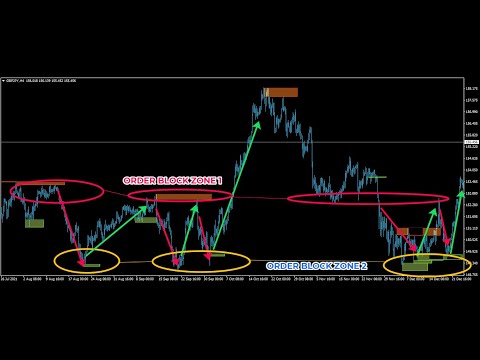
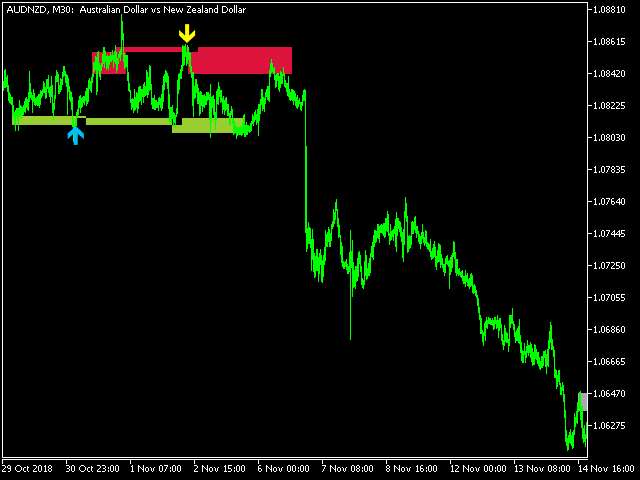
Trend Support Resistance is a fairly simple indicator that provides traders with confirmed immediate support and resistance in whatever timeframe you monitor.
It's good for short-term and long-term order blocks. With the default settings, the indicator identifies critical support and resistance areas.
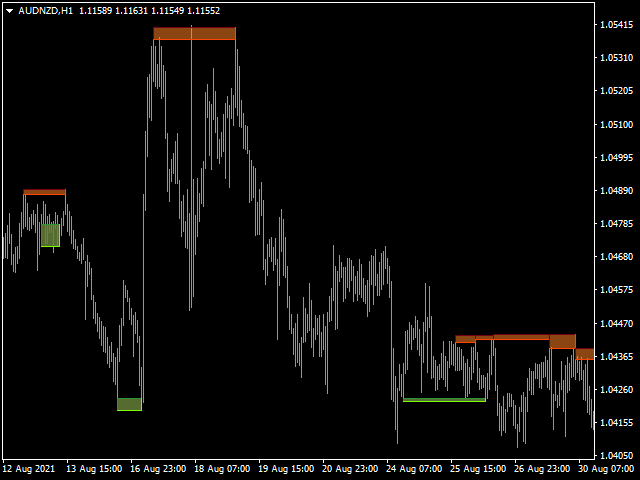
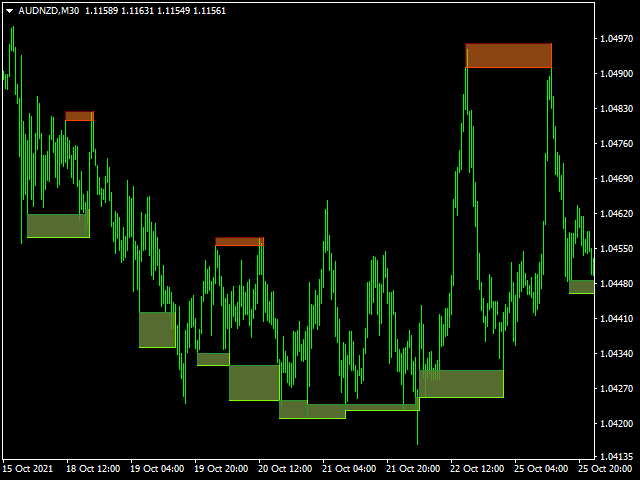
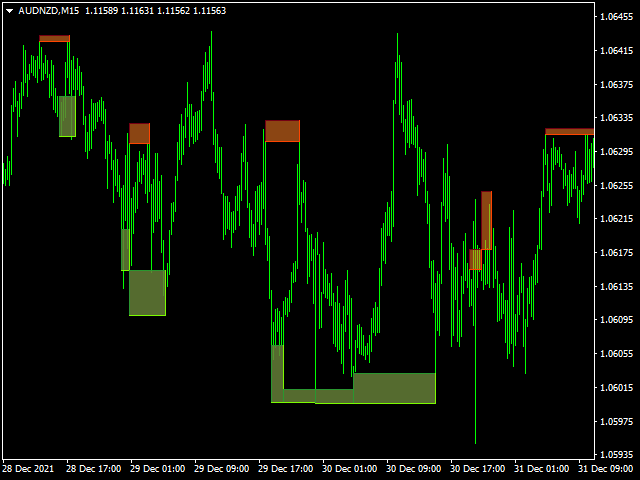
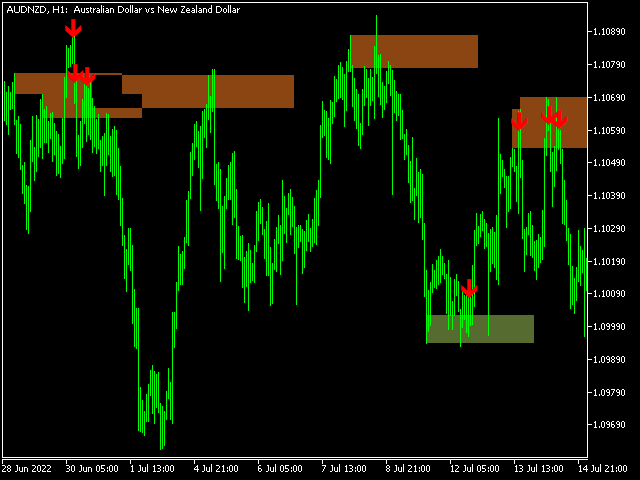
Bearish Order Blocks are around the OrangeRed areas while Bullish Order Blocks almost always form near the LawnGreen areas. We have also added a Multi-timeframe feature that can be helpful to allow you trade with an insight of higher or lower timeframes.
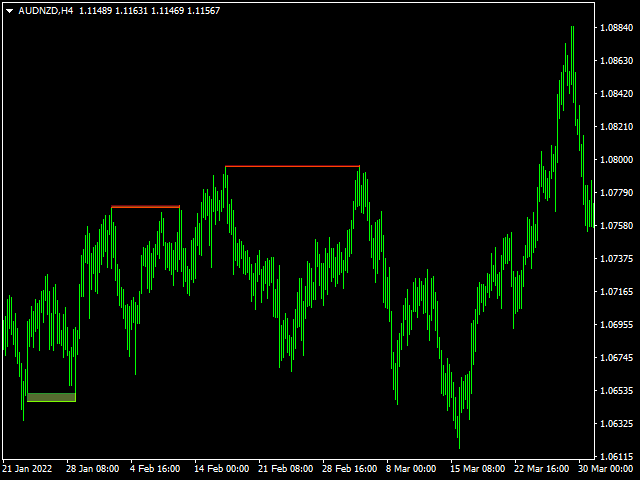
- The Peak Maximum value can be from 50 to 100 while the Bottom Minimum value is between 50 and 0.
- The Trend Price Range is the maximum size of order block area you would like the indicator to draw for you.
- The other important feature is the Combine General S/R which draws a wider S/R zone based on smaller order block zones. Besides, you can extend the zones.
- You can use the multiple instances of the indicator in same chart by changing the tag name
Starting price $40 for the first 20 customers. Next price is $60.
MT4 VERSION | [Other Great Indicators]
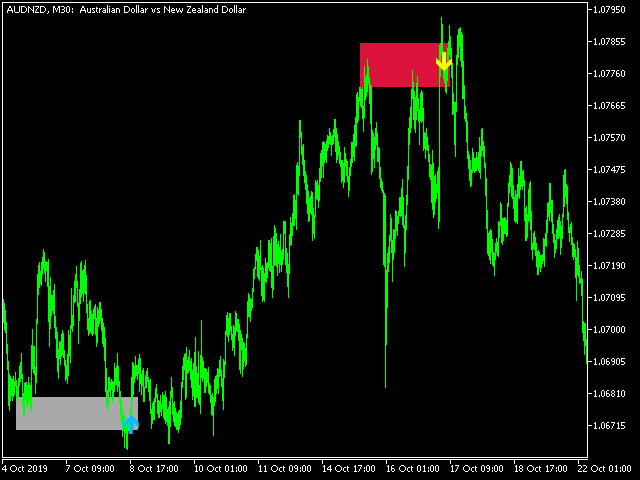
Simple Summary of Rules
Buy:
Option 1: When price opens above after re-touching the Support.
Option 2: After price breaks above and re-touches the Resistance
Sell:
Option 1: If the price re-touches the Resistance and opens below.
Option 2: After price breaks below and re-touches the Support
[The settings are straight forward. However, Contact me immediately through DM after the purchase for settings' file of different pairs]