Relative Volume MT4
- インディケータ
- バージョン: 1.1
- アップデート済み: 16 9月 2022

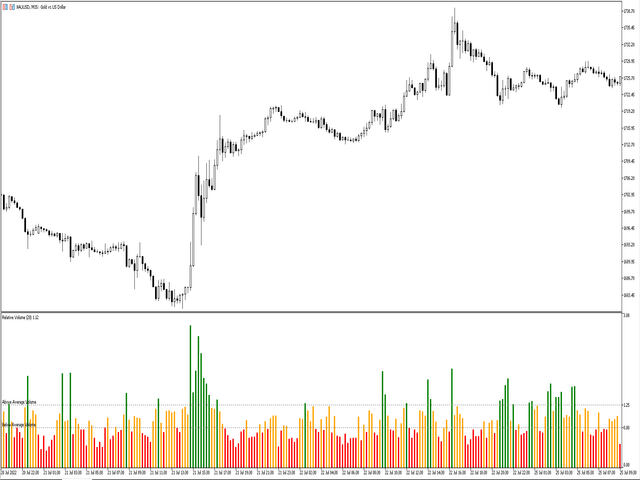
Relative Volume or RVOL is an indicator that averages the volume of X amount of days, making it easy to compare sessions volumes.
The histogram only has 3 colors:
Green - Above average volume
Yellow - Average volume
Red - Below average volume
The default setting is 20 days, which corresponds more or less to a month of trading.
With the data obtained from this indicator you can better gauge the commitment behind a move. For example, you will be better equipped to judge if a breakout of a range or the penetration of an important level really has big volume behind it supporting that move (and you can apply the same concept to judge the force of an impulsive move and it´s pullback).
Check the comments section for high resolution example images.
PS: If the histogram starts to look weird as you scroll back to the past, it means you need more historical data. So scroll back as far as you can then reload the timeframe and the histogram will recalculate.
After someone explained how to use the indicator, I like it a lot!