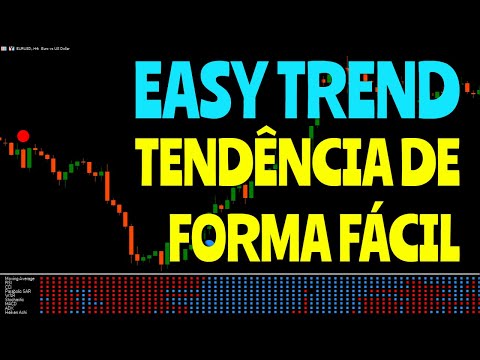
LT Easy Trend

4.33
  • インディケータ
  • Thiago Duarte
    Thiago Duarte
    こんにちは!私の名前はThiago(英語名:James)です。プログラマーをしています。
    2016年からマーケット業界に携わっており、ブラジル出身です。
    私はLitoral Tradingの創設者兼管理者であり、市場愛好家のコミュニティを運営しています。
    2019年3月からMQL5のプログラミングに取り組み、MT5に特化してあなたの成長をサポートしています。
    旅行好きで、二輪車愛好家です。
    あなたの戦略を自動化したいですか?お見積もりはお気軽にご連絡ください!
    私たちのページ:
  • バージョン: 1.3
  • アップデート済み: 11 10月 2022
  • アクティベーション: 5
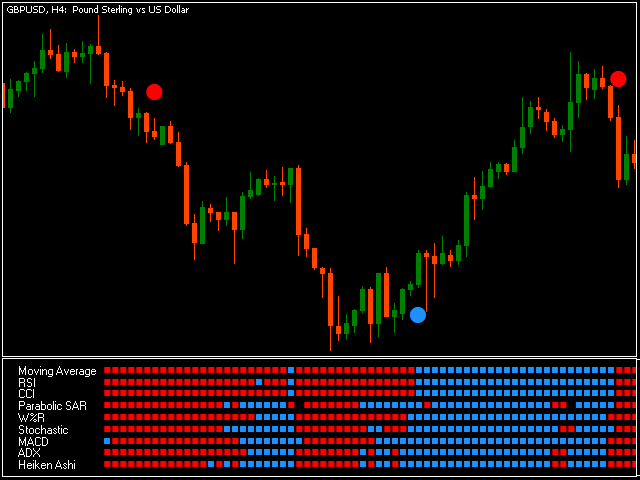
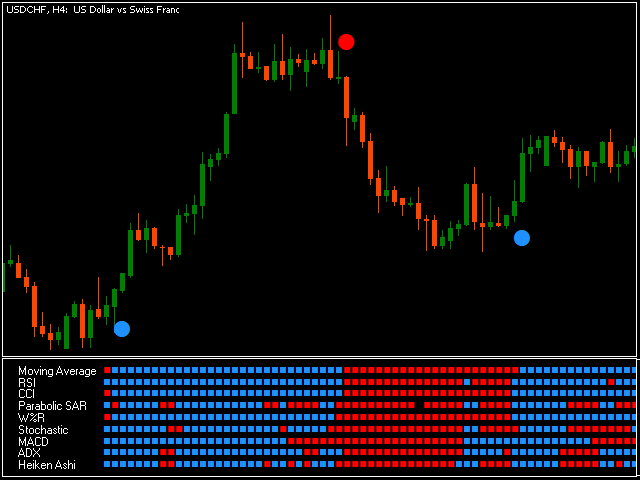
LT Easy Trend - 9つのインジケーターの根拠を1つに集約

あるインジケーターが買いを示しているのに、別のインジケーターが売りを示していて、迷ったことはありませんか?LT Easy Trendは、そのような優柔不断さを排除するために開発されました。世界で最も信頼されている9つのテクニカルインジケーターの数学的合意に基づいた、高確率なシグナルを提供します。

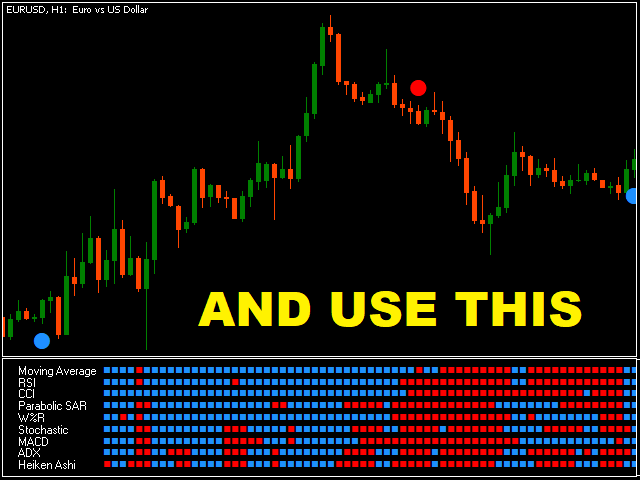
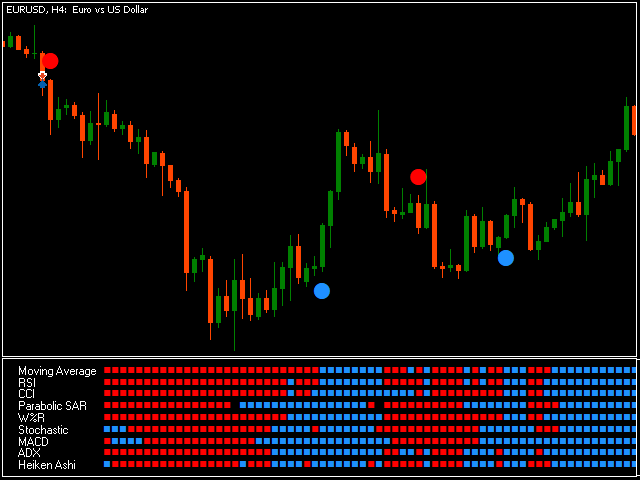
チャートを無数のウィンドウで埋め尽くす必要はありません。Easy Trendがリアルタイムですべてを処理し、すべてのフィルターが同時にトレンドを確認したときのみ、明確な視覚的シグナルを表示します。

9つのトレンドフィルターの力:

以下のすべての条件が完全に一致した場合のみ、エントリーシグナルが生成されます:

  1. 移動平均線 (MA): 価格の方向性フィルター。
  2. 相対力指数 (RSI): 強さと勢いの識別。
  3. 商品チャネル指数 (CCI): 新しいトレンドサイクルの検出。
  4. パラボリックSAR: 動的なトレンド追跡と反転の特定。
  5. ウィリアムズ%R (WPR): 買われすぎ・売られすぎ水準の読み取り。
  6. ストキャスティクス: モメンタムのクロスオーバーの検証。
  7. MACD: 収束と拡散の確認。
  8. ADX (平均方向性指数): 現在のトレンドの実際の強さを測定。
  9. ハイキンアシ (平均足): 価格ノイズを排除し、クリーンなトレンドを読み取ります。

主なメリット:

  • リペイントなし (Non-Repaint): ローソク足の確定時にシグナルが確定すると、チャート上に残り続けます。戦略に対する絶対的な信頼性を提供します。
  • カスタマイズ可能なビジュアル: シグナルのスタイル(ドットまたはスクエア)、色、矢印の距離を選択して、ご自身のテンプレートに合わせることができます。
  • 即時アラート: ターミナルでのポップアップ通知や、スマホへのプッシュ通知(MetaTraderアプリ経由)を受け取れるため、PCから離れていてもチャンスを逃しません。
  • 高い柔軟性: あらゆる時間足(M1から月足まで)およびあらゆる資産(FX、指数、仮想通貨、コモディティ、株式)に対応。
  • 完全なテクニカル設定: 内部の9つのインジケーターそれぞれのパラメーターを完全にコントロールできます。

Easy Trendでの取引方法:

このインジケーターは、明確な方向性を求める初心者から、厳格なエントリーフィルターを必要とするプロフェッショナルまで、幅広く理想的です。スクエア/ドットが表示されたら:

  • 買いシグナル (青): 9つすべてのインジケーターが上昇トレンドを確認。
  • 売りシグナル (赤): 9つすべてのインジケーターが下落トレンドを確認。

カスタマーサポート:

私たちはあなたの成功をサポートします。技術的な質問やアラート設定のサポートが必要な場合は:

  • このページの**「Comments(コメント)」**タブをご利用ください。
  • MQL5.com公式チャットシステム経由でメッセージを送信してください。迅速に対応いたします。

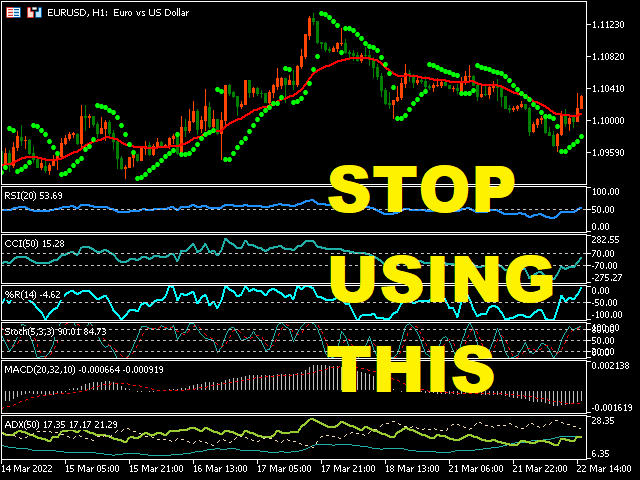
注:100%完璧なインジケーターは存在しません。取引においては常に適切なリスク管理を行ってください。


レビュー 7
Vladimir Shramchenko
557
Vladimir Shramchenko 2024.10.01 12:39 
 

Thank you for your hard work. Really great job. In this variety of such products, it is a gem in its quality of work on the chart

Eblawsch
165
Eblawsch 2024.01.06 18:31 
 

Nice indicator, I use it with an own little script. It is easy. I like it. Friendly and helpful support. Thanks a lot!

Michael Prescott Burney
71124
Michael Prescott Burney 2023.12.02 06:39 
 

In the dynamic world of trading, simplicity often proves to be the key to success, and Easy Trend lives up to its name by seamlessly combining nine essential indicators into a single, user-friendly tool. As someone who values clarity in chart analysis, I've found Easy Trend to be a breath of fresh air in streamlining my trading strategy. The brilliance of Easy Trend lies in its straightforward strategy: a buy signal when the indicator turns blue and a sell signal when it turns red. This simplicity not only makes it accessible for traders of all levels but also eliminates the clutter caused by multiple indicators on your charts. The inclusion of nine powerful indicators - Moving Average, RSI, CCI, Parabolic SAR, William's Range, Stochastic, MACD, ADX, and Heiken Ashi - ensures a comprehensive view of the market conditions. When all these indicators align in the same direction, a clear and reliable signal is triggered, providing a strong basis for confident trading decisions. Customization is another standout feature of Easy Trend. Traders have the flexibility to configure each indicator according to their preferred trading style. This adaptability ensures that the tool caters to a diverse range of trading strategies, making it a versatile companion for traders with varying preferences. The option to enable or disable signals on the chart, coupled with popup alerts, adds a layer of convenience to the trading experience. Easy Trend not only simplifies your analysis but also keeps you informed without constant monitoring, allowing you to stay ahead of market movements. Gone are the days of chart pollution with multiple indicators. Easy Trend offers a clean and efficient solution to trend analysis, enhancing the visual appeal of your charts while maintaining the depth of market insights. In conclusion, Easy Trend has become an indispensable part of my trading toolkit. Its simplicity, combined with the strength of multiple indicators, has elevated my confidence in making well-informed trading decisions. If you're looking to declutter your charts without compromising on analysis, Easy Trend is the answer. Embrace the ease, embrace the trend – Easy Trend is your shortcut to a more streamlined and profitable trading journey!

おすすめのプロダクト
Divergent Stochastic Filter II Catch Reversals Early, Filter Noise, Trade with Confidence The Edge: Why This Stochastic is Different  Every trader knows the Stochastic oscillator. But knowing when to trust its signals, that's the real challenge. The Divergent Stochastic Filter II transforms this classic indicator into a precision reversal detection system by adding critical elements: divergence intelligence, signal filtering and exhaustion detection.  While standard Stochastic oscillators fire s
CosmiCLab SMC FIBO CosmiCLab SMC FIBO is a professional trading indicator designed for traders who use Smart Money Concepts (SMC), market structure analysis and Fibonacci retracement levels. The indicator automatically detects market swings and builds Fibonacci levels based on the latest impulse movement. It also identifies market structure changes such as BOS (Break of Structure) and CHOCH (Change of Character), helping traders understand the current market direction. CosmiCLab SMC FIBO also pr
RBreaker Gold Indicatorsは、金先物の短期日内取引戦略であり、トレンドフォローと日内反転の2つの取引手法を組み合わせたものです。トレンド相場での利益を捉えるだけでなく、相場が反転した際には迅速に利確し、その流れに沿ってポジションを反転させることができます。 この戦略は、アメリカの雑誌『Futures Truth』において、15年連続で最も収益性の高い取引戦略トップ10に選ばれた実績を持ち、非常に長いライフサイクルを誇り、現在も国内外で広く使用・研究されています。 本インディケーターは、2026年の金先物の値動きに対応し、14日間のATR指標に基づいて、ブレイクアウト係数A、観察係数B、リバーサル係数Rをより合理的な値で定義しています。非常に優れたインディケーターであり、安定的な年間収益を実現しています。ぜひおすすめします〜
Price Magnet — Price Density and Attraction Levels Indicator Price Magnet is a professional analytical tool designed to identify key support and resistance levels based on statistical Price Density. The indicator analyzes a specified historical period and detects price levels where the market spent the most time. These zones act as “magnets,” attracting price action or forming a structural base for potential reversals. Unlike traditional Volume Profile tools, Price Magnet focuses on price-time d
Chỉ báo này sẽ thông báo cho bạn nếu cấu hình xu hướng thành công. Tín hiệu theo xu hướng không nên được tăng theo, nhưng tín hiệu mua ở mức giá thấp theo mô hình giao dịch thông thường của bạn, hoặc tín hiệu bán ở mức giá tốt, là một lựa chọn rất tốt. Hãy thiết lập nó trên khung thời gian lớn hơn và theo dõi các khung thời gian nhỏ hơn, bám sát các xu hướng chính. Tôi thường thiết lập ba khung thời gian gần nhau nhất và không bao giờ đi ngược tín hiệu của INdicator này. INdicator   này không có
「調整可能なフラクタル」はフラクタル インジケーターの高度なバージョンで、非常に便利なトレーディング ツールです。 - ご存知のとおり、標準フラクタル MT5  インジケーターには設定がまったくありません。これはトレーダーにとって非常に不便です。 - 調整可能なフラクタルは、この問題を解決しました。必要な設定がすべて揃っています。 - インジケーターの調整可能な期間 (推奨値 - 7 以上)。 - 価格の高値/安値からの距離を調整可能。 - フラクタル矢印のデザインを調整可能。 - インジケーターにはモバイルおよび PC アラートが組み込まれています。 高品質のトレーディングロボットとインジケーターをご覧になるにはここをクリックしてください! これは、この MQL5 Web サイトでのみ提供されるオリジナル製品です。
Caicai L&S Yield Histogram Important Notice: This indicator is an integral tool of the automated EA Caicai Long and Short Pair Trading . This indicator visually displays the percentage deviation (Yield %) of a pair's current spread relative to its own historical mean. It is an excellent tool for quickly visualizing the gross financial potential of a market distortion in Long & Short operations. Main Features: Percentage Visualization: Understand the size of the distortion in palpable percentage
ATrend
Zaha Feiz
4.83 (18)
ATrend: その仕組みと使い方 仕組み MT5プラットフォーム向けの「ATREND」インジケーターは、テクニカル分析手法の組み合わせを利用して、トレーダーに堅牢な買いと売りのシグナルを提供するように設計されています。このインジケーターは主に、ボラティリティ測定のために平均真の範囲(ATR)を活用し、潜在的な市場動向を特定するためのトレンド検出アルゴリズムを併用しています。 購入後にメッセージを残すと、特別なボーナスギフトが贈呈されます。 主な特徴: - ダイナミックなトレンド検出: インジケーターは市場トレンドを評価し、シグナルを適宜調整することで、トレーダーが優位な市場環境に合わせて戦略を立てるのを支援します。     - ボラティリティ測定: ATRを使用することで、インジケーターは最適なストップロス(SL)とテイクプロフィット(TP)レベルを決定するために不可欠な市場ボラティリティを測定します。 - シグナルの視覚化: インジケーターは、チャート上に買いと売りのシグナルを視覚的に表示することで、トレーダーの意思決定を強化します。 操作手順 入力とセッティング - TimeF
HAS RSI Signal — SL/TP自動計算機能付き プロフェッショナル・トレンドインジケーター HAS RSI Signal は、信頼性の高いクラシックな手法と最新のノイズ除去アルゴリズムを融合させた強力なトレーディングツールです。 平均足スムーズド(Heiken Ashi Smoothed) と RSI を組み合わせることで、トレンドの転換点や買われすぎ・売られすぎ圏からの脱出タイミングを正確に捉え、明確なエントリーシグナルを提示します。 主な特徴: 二重のフィルタリング: 平均足スムーズドで市場の「ノイズ」を除去し、RSIで勢い(モメンタム)の強さを確認します。 損切り・利確ラインの自動計算: 単にシグナルを出すだけでなく、ボラティリティ( ATR )に基づいた最適なストップロス(SL) と テイクプロフィット(TP)を自動で算出します。 視覚的な分かりやすさ: シグナルはチャート上にカラーキャンドルとして表示されるため、一目でトレンドを把握でき、取引画面をスッキリと保てます。 充実の通知機能: アラート、音声、スマートフォンへのプッシュ通知機能を搭載。チャンスを逃すこと
The Trend Detect indicator combines the features of both trend indicators and oscillators. This indicator is a convenient tool for detecting short-term market cycles and identifying overbought and oversold levels. A long position can be opened when the indicator starts leaving the oversold area and breaks the zero level from below. A short position can be opened when the indicator starts leaving the overbought area and breaks the zero level from above. An opposite signal of the indicator can b
STRICTLY FOR BOOM INDEX ONLY!!!!! Here I bring the Maximum Trend Arrows OT1.0 MT5 indicator. This indicator is made up of a combination of different trend indicators for entries and exits, for entries an orange arrow will paint on the chart below the current market and a red flag for closing of trades and it produces buy arrows only. When the orange arrow appears, it will appear along with it's sound to notify you. The 1H timeframe is recommended, don't use it anywhere else than on the 1H timefr
This is an advanced multi-timeframe version of the popular Hull Moving Average (HMA) Features Two lines of the Hull indicator of different timeframes on the same chart. The HMA line of the higher timeframe defines the trend, and the HMA line of the current timeframe defines the short-term price movements. A graphical panel with HMA indicator data from all timeframes at the same time . If the HMA switched its direction on any timeframe, the panel displays a question or exclamation mark with a tex
The Trend Duration Forecast MT5 indicator is designed to estimate the probable lifespan of a bullish or bearish trend. Using a Hull Moving Average (HMA) to detect directional shifts, it tracks the duration of each historical trend and calculates an average to forecast how long the current trend is statistically likely to continue. This allows traders to visualize both real-time trend strength and potential exhaustion zones with exceptional clarity. KEY FEATURES Dynamic Trend Detection:   Utiliz
Alpha Trend MT5 is a trend indicator for the MetaTrader 5 platform; it has been developed by a group of professional traders. The Alpha Trend MT5 indicator finds the most probable tendency reversal points, which allows making trades at the very beginning of a trend. This indicator features notifications, which are generated whenever a new signal appears (alert, email, push-notification). This allows you to open a position in a timely manner. Alpha Trend does not redraw, which makes it possible t
Trend Monitor MT5
Pavel Zamoshnikov
4.5 (2)
The indicator generates early signals basing on ADX reading data combined with elements of price patterns. Works on all symbols and timeframes. The indicator does not redraw its signals. You see the same things on history and in real time. For better visual perception signals are displayed as arrows (in order not to overload the chart). Features The best results are obtained when the indicator works on two timeframes. For example: M30 – the indicator shows the main trend; M5 – the indicator gen
KasTon Trend System: The Complete 2-in-1 Trading Strategy Identify the Trend, Confirm the Signal, and Trade with Confidence! Do you suffer from confusion while trading? Do you find it difficult to determine the market's direction? Are you tired of losing money on false signals? The KasTon Trend System is here as an integrated solution to all these problems. This is not just an indicator; it is a complete trading strategy built on the synergy of two powerful, custom-built indicators. Our main g
This is Gekko's Cutomized Relative Strength Index (RSI), a customized version of the famous RSI indicator. Use the regular RSI and take advantage two entry signals calculations and different ways of being alerted whenever there is potential entry or exit point. Inputs Period: Period for the RSI calculation; How will the indicator calculate entry (swing) signals: 1- Produces Exit Signals for Swings based on RSI entering and leaving Upper and Lower Levels Zones; 2- Produces Entry/Exit Signals for
This indicator can be considered as a trading system. It offers a different view to see the currency pair: full timeless indicator, can be used for manual trading or for automatized trading with some expert advisor. When the price reaches a threshold a new block is created according to the set mode. The indicator beside the Renko bars, shows also 3 moving averages. Features renko mode median renko custom median renko 3 moving averages wicks datetime indicator for each block custom notification
Be notified of every color change of Heiken Ashi (HA) candles. The indicator will trigger past and new signals every time that HA candles change their colors. ( Note : this tool is based on the code of Heiken Ashi indicator developed by MetaQuotes Software Corp.) Features The signals are triggered at closing of last bar/opening of a new bar; Any kind of alerts can be enabled: Dialog Box, Email message, SMS notifications for smartphones and tablets, and Sound alerts; By default, up arrows are pl
Crypto_Forex MT5用インジケーター「ハンマー&シューティングスターパターン」。リペイント不要、遅延なし。 - インジケーター「ハンマー&シューティングスターパターン」は、プライスアクショントレードに非常に強力なインジケーターです。 - このインジケーターは、チャート上で強気のハンマーパターンと弱気のシューティングスターパターンを検出します。 - 強気のハンマーパターン:チャート上に青い矢印シグナルを表示します(画像参照)。 - 弱気のシューティングスターパターン:チャート上に赤い矢印シグナルを表示します(画像参照)。 - PC, Mobile alerts. - インジケーター「ハンマー&シューティングスターパターン」は、サポートレベル/レジスタンスレベルと組み合わせるのに最適です。 高品質のトレーディングロボットとインジケーターをご覧になるにはここをクリックしてください! これは、このMQL5ウェブサイトでのみ提供されるオリジナル製品です。
1. Overview The Scalping PullBack Signal indicator is a powerful technical analysis tool designed to help traders identify scalping opportunities based on potential pullback and reversal signals. This tool is particularly useful on lower timeframes (below 15 minutes) but can also be applied on higher timeframes for longer-term trades. This indicator integrates several key analytical components, providing a comprehensive view of trends and potential entry/exit points, helping you make quick and e
FREE
What Is Trend Master Pro? Trend Master Pro   is a professional-grade trend trading indicator built for MetaTrader 5. It was designed with one goal in mind — to keep you on the right side of the market at all times by combining three powerful technical tools into a single, clean, easy-to-read display directly on your price chart. Instead of cluttering your screen with multiple separate indicators, Trend Master Pro fuses an   EMA Ribbon trend filter , a   ZigZag swing point engine , and a   breako
Advanced MT5 Indicator: Precision-Powered with Pivot Points, MAs & Multi-Timeframe Logic Unlock the full potential of your trading strategy with this precision-engineered MetaTrader 5 indicator —an advanced tool that intelligently blends Pivot Points , Adaptive Moving Averages , and Multi-Timeframe Analysis to generate real-time Buy and Sell signals with high accuracy.    If you want to test on Real Market, Let me know. I will give the Demo file to run on Real Account.    Whether you're a scal
== LT RAINBOW TREND - 36本の移動平均線を持つトレンドインジケーター == 概要 LT Rainbow Trendは、36本の移動平均線を同時に処理し、スマートなカラーシステム(レインボー)を搭載した先進的なトレンド分析テクニカルインジケーターです。主力のトレンド方向へ最大の視覚的明瞭さをもって取引したいトレーダーのために開発され、マルチタイムフレーム分析の複雑さを、シンプルでカラフル、かつ非常に直感的なビジュアルへと変換します。 「トレンドは友達(The trend is your friend)」であることを理解しているトレーダーに最適です。このインジケーターは、トレンドの強さ、方向、そして潜在的な反転を常に事前に見極めることを可能にします。 仕組み インジケーターは、4つのトレンドゾーンに分散された36本の移動平均線を監視します: 赤(トレンド転換ゾーン) 31〜20番目の移動平均線 トレンドが反転する可能性を示す強いサイン オレンジ(トレンド減速ゾーン) 19〜10番目の移動平均線 トレンドの勢いが失われつつあるが、継続の可能性もあるサ
Auto Optimized RSI   は、正確な売買シグナルを提供するために設計された、使いやすいスマートな矢印インジケーターです。過去のデータを使ったトレードシミュレーションに基づき、各通貨ペアや時間足に最適なRSIの買い/売りレベルを自動で見つけ出します。 このインジケーターは、独立したトレードシステムとしても、既存の戦略の一部としても使用できます。特に短期トレーダーにとって便利なツールです。 従来のRSI(70/30など)の固定レベルとは異なり、 Auto Optimized RSI   はリアルな価格の動きとバックテスト結果に基づき、ダイナミックにレベルを調整します。勝率、ドローダウン、平均利益/損失といった重要な統計をモニターし、現在の市場に適応して、本当に機能するシグナルを提供します。 RSIが最適化されたレベルをクロスすると、チャート上に買い・売りの矢印が表示され、成功率の高いエントリーポイントを見つけるのに役立ちます。 ご購入後にご連絡いただければ、追加のツールや特別なトレードのヒントを無料でお渡しいたします! 皆様のトレードが成功しますように!
BlueBoat – Prime Cycle is a technical indicator for MetaTrader 5 that visualizes market cycles based on the Fimathe cycle model (Marcelo Ferreira) . It identifies and displays historic and live cycle structures such as CA, C1, C2, C3, etc., helping traders understand the rhythm and timing of price movement across multiple sessions. This tool is ideal for manual analysis or as a supporting signal in discretionary strategies. Key Features Historical Cycle Analysis – Backtest and visualize as many
Introducing the Machine Learning Price Target Predictions, a cutting-edge trading tool that leverages kernel regression to provide accurate price targets and enhance your trading strategy. This indicator combines trend-based signals with advanced machine learning techniques, offering predictive insights into potential price movements. Perfect for traders looking to make data-driven decisions with confidence. What is Kernel Regression and How It Works Kernel regression is a non-parametric mach
Type: Oscillator This is Gekko's Cutomized Moving Average Convergence/Divergence (MACD), a customized version of the famous MACD indicator. Use the regular MACD and take advantage of several entry signals calculations and different ways of being alerted whenever there is potential entry point. Inputs Fast MA Period: Period for the MACD's Fast Moving Average (default 12); Slow MA Period: Period for the MACD's Slow Moving Average (default 26); Signal Average Offset Period: Period for the Signal A
トレンドに乗りましょう。はい、買いでも売りでも、15分枠でエントリーシグナルを待ち、30分枠でシグナルが現れたらシグナルを確認します(シグナルが現れるまでに1時間以上かかる場合もあります。戻ることができます) 15分足に戻り、30分足に戻り、メインシグナルが現れるまでこれを繰り返し、30分足にシグナルが出たら価格でエントリーし、描画ラインが変化した時点で利益確定となります。 、利益が確定したとき、または反対のシグナルが現れたとき これは非常にシンプルで、すべての主要通貨で機能します。  メタル、インジケーター、すべてのフレームですが、最も良い結果は 30 分フレームです。 ストップロスは常にローソク足の底値よりも下に設定し、資本管理を超えてはなりません 資本金の10%
Terra Infinity is a flat indicator. This improved version of the CalcFlat indicator has three additional lines that significantly increase its effectiveness. Unlike its predecessor with two static levels, Terra Infinity adds three dynamic lines above the main histogram, which are interpreted as follows: base signal line, minimum signal line, maximum signal line. These lines are formed using the additional parameter Avg, which is the average value of the histogram. Averaging produces a line cl
このプロダクトを購入した人は以下も購入しています
Neuro Poseidon is a new indicator by Daria Rezueva. It combines precise trading signals with adaptive TP/SL levels - creating best possible trades as a result! Message me and get  Neuro Poseidon Assistant  as a gift to automize your trading process! What makes it stand out? 1. Proven profitability on all assets and timeframes 2. Only confirmed BUY and SELL signals present on the chart 3. Adaptive TP & SL levels generated by the software for each trade 4. Easy to understand - suitable for al
SuperScalp Pro
Van Minh Nguyen
4.65 (26)
SuperScalp Pro – 高度なマルチフィルタースキャルピングインジケーターシステム SuperScalp Pro は、クラシックな Supertrend と複数のインテリジェント確認フィルターを組み合わせた高度なスキャルピングインジケーターです。M1 から H4 まで複数の時間足で効率的に動作し、XAUUSD、BTCUSD、主要 Forex 通貨ペア向けに最適化されています。 このインジケーターは明確な Buy / Sell シグナルを提供し、ATR に基づいてエントリー価格、Stop Loss、Take Profit を自動計算します。Fibonacci Take Profit 機能により、重要な価格帯で早期決済し、到達時に通知を送信します。 初期設定では Fibonacci Take Profit が有効化されており、より安定した取引体験を重視しています。チャートに適用するだけですぐ利用可能です。上級者向けに、すべてのパラメータは自由にカスタマイズできます。 完全なドキュメントは製品ブログにあります: [User Guide] SuperScalp Pro Auto T
このインジケーターを購入された方には、以下の特典を 無料 で提供しています: 各トレードを自動で管理し、ストップロスとテイクプロフィットを設定し、戦略ルールに基づいてポジションを決済する補助ツール 「Bomber Utility」 様々な銘柄に合わせたインジケーターの設定ファイル(セットファイル) 「最小リスク」、「バランスリスク」、「待機戦略」 の3つのモードで使用できる Bomber Utility 用の設定ファイル このトレーディング戦略をすぐに導入・設定・開始できる ステップバイステップのビデオマニュアル ご注意: 上記の特典を受け取るには、MQL5のプライベートメッセージシステムを通じて販売者にご連絡ください。 オリジナルのカスタムインジケーター 「Divergence Bomber(ダイバージェンス・ボンバー)」 をご紹介します。これは、MACDのダイバージェンス(乖離)戦略に基づいた 「オールインワン」型のトレーディングシステム です。 このテクニカルインジケーターの主な目的は、価格とMACDインジケーターの間に発生するダイバージェンスを検出 し、将来の価格の動きを示す
まず正直に言いましょう。 どんなインジケーターも、それ単体であなたを利益化させることはできません。もしそう言う人がいるなら、それは夢を売っているだけです。完璧な売買シグナル(矢印)を表示するインジケーターは、いくらでも“完璧に見せる”ことができます。正しい過去の区間を拡大して、勝ちトレードだけを切り取ればいいだけです。私たちはそれをしません。 SMC Intraday Formula はツールです。 市場構造を読み取り、最も高い確率の価格ゾーンを特定し、今この瞬間のスマートマネーの痕跡をシンプルな言葉で正確に示します。最終判断はあなたが行います。トレードを実行するのもあなたです。しかし今は「希望」ではなく「精度」でエントリーできます。 私たちはこのインジケーターを、ゴールド(XAUUSD)および主要FX通貨ペアで約3年間、日々のスキャルピングに使用してきました。M1、M5、M15、M30の主要ツールです。これは未来を予測しようとするのではなく、今まさに形成されている高確率セットアップを示し、その理由を説明します。 他のすべてのインジケーターと何が違うのか? ほとんどのトレーディングイ
Entry In The Zone and SMC Multi Timeframe is a real-time 2-in-1 market analysis tool that combines market structure analysis and a No Repaint BUY / SELL signal system into a single indicator, built on Smart Money Concepts (SMC) — a widely adopted framework used by professional traders to understand market structure. This indicator helps you see the market more clearly, make decisions based on structure rather than guesswork, and focus on high-probability zones where price is more likely to react
Power Candles V3 - 自己最適化型強弱インジケーター Power Candles V3は 、通貨や銘柄の強さを、適用されたすべてのチャート上で実行可能なトレードプランに変換します。単にローソク足を色分けするだけでなく、バックグラウンドでリアルタイムの自動最適化を実行し、目の前の銘柄に対して最適なストップロス、テイクプロフィット、およびシグナルの閾値を提示します。ワンクリックで実取引に適用でき、エントリーポイント、ストップロス、テイクプロフィットのラインが正確な価格位置にチャート上に表示され、方向性を示すアラートがリアルタイムで発動します。 このツールは、Stein Investmentsのエコシステムの一部です。  18種類以上のツールをすべて閲覧し、AIを活用したセットアップの推奨事項を入手し、  https://stein.investments でコミュニティに参加しましょう クローズしたバーごとに3,000回以上のトレードシミュレーション。9つの強さの状態。2つの戦略を並行してテスト。勝率の高い設定をワンクリックで適用。 なぜこれが必要なのか ほとんどの強
SignalTech MT5 is an unique fully rule based trading system for EURUSD, USDCHF, USDJPY, AUDUSD, NZDUSD, EURJPY, AUDJPY, NZDJPY, CADJPY.  All the winning trades with chart setups are published on the comments page. 2026-05 4107 Pips (Until 05-29 NY Closed) 2026-04 2243 Pips 2026-03 2165 Pips 2026-02 2937 Pips 2026-01 2624 Pips 2025-12 1174 Pips It can generate signals with Buy/Sell Arrows and Pop-Up/Sound Alerts. Each signal has clear Entry and Stop Loss levels, which should be automatically flag
ご紹介     Quantum Breakout PRO は 、ブレイクアウト ゾーンの取引方法を変革する画期的な MQL5 インジケーターです。 13年以上の取引経験を持つ経験豊富なトレーダーのチームによって開発されました。     クォンタム ブレイクアウト プロ   は、革新的でダイナミックなブレイクアウト ゾーン戦略により、あなたのトレーディングの旅を新たな高みに押し上げるように設計されています。 クォンタム ブレイクアウト インジケーターは、5 つの利益ターゲット ゾーンを備えたブレイクアウト ゾーン上のシグナル矢印と、ブレイクアウト ボックスに基づいたストップロスの提案を提供します。 初心者トレーダーにもプロのトレーダーにも適しています。 量子EAチャネル:       ここをクリック 重要!購入後、インストールマニュアルを受け取るためにプライベートメッセージを送ってください。 推奨事項: 時間枠: M15 通貨ペア: GBPJPY、EURJPY、USDJPY、NZDUSD、XAUUSD アカウントの種類: ECN、Raw、またはスプレッドが非常に低い R
この製品は 2026 年の市場向けに更新され、最新の MT5 ビルドに最適化されています。 価格更新のお知らせ: Smart Trend Trading System は現在 $99 で提供されています。 次の 30 件の購入 後、価格は $199 に上がります。 特別オファー: Smart Trend Trading System を購入後、私にプライベートメッセージを送ることで、 Smart Universal EA を無料 で受け取り、Smart Trend のシグナルを自動売買に変えることができます。 Smart Trend Trading System は、リペイントなし、再描画なし、遅延なしの完全なトレーディングシステムです。よりクリーンなシグナル、より明確なトレンド方向、そしてより整理された取引方法を求めるトレーダー向けに作られています。 Online course , manual and download presets . このシステムは、トレンド検出、反転ゾーン、Smart Cloud、トレーリングストップロジック、サポートとレジスタンス、ローソク足の色分け、ア
Quantum TrendPulse を ご紹介します。これは、   SuperTrend   、   RSI   、および Stochastic のパワーを 1 つの包括的なインジケーターに組み合わせて、取引の可能性を最大限に引き出す究極の取引ツールです。精度と効率を求めるトレーダー向けに設計されたこのインジケーターは、市場のトレンド、勢いの変化、最適なエントリー ポイントとエグジット ポイントを自信を持って特定するのに役立ちます。 主な特徴: SuperTrend 統合: 現在の市場動向に簡単に追従し、収益性の波に乗ることができます。 RSI精度: 買われすぎと売られすぎのレベルを検出し、市場の反転のタイミングに最適で、SuperTrendのフィルターとして使用されます。 確率的精度: 確率的振動を活用して、変動の激しい市場で隠れたチャンスを見つけます。SuperTrend のフィルターとして使用されます。 マルチタイムフレーム分析:   M5 から H1 または H4 まで、さまざまなタイムフレームで市場を常に把握します。 カスタマイズ可能なアラート: カスタム取引条件が満たされ
Azimuth Pro
Ottaviano De Cicco
5 (7)
Azimuth Pro V2:MT5向けシンセティック・フラクタル構造分析と確認済みエントリー 概要 Azimuth Pro は Merkava Labs によるマルチレベルスイング構造インジケーターです。4つのネストされたスイングレイヤー、スイングアンカーVWAP、ABCパターン検出、3タイムフレーム構造フィルタリング、そして確定バーでの確認済みエントリー — 1つのチャートで、ミクロスイングからマクロサイクルまでを網羅するワークフロー。 これはブラインドシグナル製品ではありません。ロケーション、コンテキスト、タイミングを重視するトレーダーのための構造ファーストワークフローです。 V2発売記念オファー — Azimuth Pro V2をUSD 399で(次の100本)。最終価格:USD 499。 1. V2での変更点 シンセティック・マルチタイムフレームエンジン 上位タイムフレーム分析をMeridian Proと同じ独自のシンセティックアーキテクチャで一から再構築。よりクリーンなHTFコンテキスト、安定したライブ動作、従来のMTF同期問題なし。シンセティックエンジンは 固定比率タ
FX Trend NG:次世代マルチマーケット・トレンドインテリジェンス 概要 FX Trend NG は、複数の時間足に対応したプロフェッショナル向けトレンド分析およびマーケット監視ツールです。 市場全体の構造を数秒で把握することができます。 複数のチャートを切り替える必要はありません。どの銘柄がトレンド中なのか、どこでモメンタムが弱まっているのか、そしてどの時間足で強い整合性があるのかを瞬時に確認できます。 ローンチ特別オファー – FX Trend NG を $30(6ヶ月) または $80 永久ライセンス でご利用いただけます。 すでに Stein Investments のユーザーですか? -> メッセージを送信 して、プライベートグループへアクセスしてください。 セットアップや詳細情報が必要ですか? -> Stein Investments 公式ページ をご覧ください。 1. FX Trend NG が他と異なる理由 3ステート・トレンドロジック ― Buy と Sell だけではない • 多くのインジケーターは Buy または Sell の2状態のみを表示します。
Gann Made Easy   は、ミスター・ギャンの理論を使用した取引の最良の原則に基づいた、プロフェッショナルで使いやすい外国為替取引システムです。 W・D・ガン。このインジケーターは、ストップロスとテイクプロフィットレベルを含む正確な買いと売りのシグナルを提供します。 PUSH通知を利用して外出先でも取引可能です。 ご購入後、取引方法の説明と優れた追加インジケーターを無料で入手するには、私にご連絡ください! おそらく、ギャンの取引手法についてはすでに何度も聞いたことがあるでしょう。通常、ギャンの理論は初心者のトレーダーだけでなく、すでにある程度の取引経験がある人にとっても非常に複雑なものです。なぜなら、ギャンの取引手法は理論的にはそれほど簡単に適用できるものではないからです。私はその知識を磨き、最良の原則を私の外国為替インジケーターに組み込むために数年を費やしました。 このインジケーターは非常に簡単に適用できます。必要なのは、それをチャートに添付し、簡単な取引推奨事項に従うだけです。このインジケーターは常に市場分析の仕事を行い、取引の機会を探します。適切なエントリーポイントを検
M30/H1/H4スイング版もあります M5/M15では取りきれない大きな波を狙いたい方へ。 Gold Signal Swing Pro(M30/H1/H4対応)を販売中。 1トレードで$20〜$80+の値幅を狙う。 https://www.mql5.com/en/market/product/177643 KURAMA GOLD SIGNAL PRO(MT5版)— 7層フィルター搭載 XAUUSD完全トレードシステム リペイントなし。リドローなし。ラグなし。すべてのサインは確定後に変わりません。 購入者限定特典:買い切りライセンスをご購入いただいた方に、AI Zone Radar($59相当)+PDFマニュアルを無料プレゼント。購入後にMQL5でメッセージをお送りください。 AI Zone Radar: https://www.mql5.com/en/market/product/175834 ゴールドトレーダーのコミュニティで実際に使用され、精度と使いやすさで高評価。 あなたの問題
RelicusRoad Pro: 定量的市場オペレーティングシステム 【期間限定】無制限アクセス 70% OFF - 2,000人超のトレーダーと共に なぜ多くのトレーダーは「完璧な」インジケーターを使っても失敗するのでしょうか? それは、文脈を無視して 単一の概念 だけでトレードしているからです。文脈のないシグナルは単なるギャンブルです。勝ち続けるには、 根拠の重なり(コンフルエンス) が必要です。 RelicusRoad Proは単なる矢印インジケーターではありません。完全な 定量的市場エコシステム です。独自のボラティリティモデリングを用いて、価格が推移する「適正価値の道(Fair Value Road)」をマッピングし、ノイズと真の構造的ブレイクを判別します。 推測はやめましょう。機関投資家レベルの「ロード・ロジック」でトレードを。 コアエンジン:「Road」アルゴリズム システムの中心となる Road Algo は、市場環境にリアルタイムで適応するダイナミックなボラティリティチャネルです。 安全ライン(平衡点) と、価格が数学的に反転しやすい 拡張レベル を投影します。 Si
トレンドキャッチャーインジケーター トレンドキャッチャーインジケーターは、開発者独自の適応型トレンド分析指標を組み合わせることで、市場価格の動きを分析します。短期的なノイズを除去し、根底にあるモメンタムの強さ、ボラティリティの拡大、価格構造の挙動に焦点を当てることで、真の市場方向性を特定します。また、移動平均線、RSI、ボラティリティフィルターなどの平滑化およびトレンドフィルタリング機能を備えたカスタマイズ指標も使用します。 実際の運用状況のモニタリングやその他の製品については、こちらをご覧ください: https://www.mql5.com/en/users/mechanic/seller ご注意ください。私はTelegramでEAや設定を販売していません。詐欺です。すべての設定はブログで無料で公開しています。 重要!ご購入後すぐにご連絡ください。手順とボーナスをお送りします!
ARIPoint
Temirlan Kdyrkhan
1 (1)
ARIPoint is a powerful trading companion designed to generate high-probability entry signals with dynamic TP/SL/DP levels based on volatility. Built-in performance tracking shows win/loss stats, PP1/PP2 hits, and success rates all updated live. Key Features: Buy/Sell signals with adaptive volatility bands Real-time TP/SL/DP levels based on ATR Built-in MA Filter with optional ATR/StdDev volatility Performance stats panel (Success, Profit/Loss, PP1/PP2) Alerts via popup, sound, push, or email Cu
Crystal Heikin Ashi Signals - Professional Trend & Signal Detection Indicator Advanced Heikin Ashi Visualization with Intelligent Signal System for Manual & Automated Trading Final Price: $149 ---------> Price goes up $10 after every 10 sales . Limited slots available — act fast . Overview Crystal Heikin Ashi Signals is a professional-grade MetaTrader 5 indicator that combines pure Heikin Ashi candle visualization with an advanced momentum-shift detection system. Designed for both manual traders
この製品は 2026 年の市場向けに更新され、最新の MT5 ビルドに最適化されています。 価格更新のお知らせ: Atomic Analyst は現在 $99 で提供されています。 次の 30 件の購入 後、価格は $199 に上がります。 特別オファー: Atomic Analyst を購入後、私にプライベートメッセージを送ることで、 Smart Universal EA を無料 で受け取り、Atomic Analyst のシグナルを自動売買に変えることができます。 Atomic Analyst は、リペイントなし、再描画なし、遅延なしの Price Action トレーディングインジケーターで、手動取引、シグナルの明確化、EA 自動化のために設計されています。 User manual: settings, inputs and strategy. 価格行動、強さ、モメンタム、マルチタイムフレーム方向、高度なフィルターを分析し、トレーダーがノイズを減らし、弱いセットアップを避け、より構造化された取引判断を行えるようにします。 このインジケーターは、複雑な市場計算をシンプルな視覚シ
Reversion King Indicator
Eugen-alexandru Zibileanu
5 (4)
新たな王者が登場 - インジケーター + 注文管理表示(TP1 + TP2 + TP3)+ オプションのTelegramシグナル送信機能付き(無料) (完全なトレード&シグナルシステム) ゴールド向け最高のEA: Gold Slayer このインジケーターには、高度な戦略、カスタマイズ可能な注文管理システム、そしてエンベロープ拡張を組み合わせた平均回帰システムが搭載されています。さらに、RSIなど複数のインテリジェントな確認フィルターによって、高確率の反転エントリーをBUY・SELLシグナルとして検出します。 単にトレードを学ぶだけでなく、複数ポジションを効果的に管理し、過去に利益を出しているオープンポジションで損失トレードをカバーする方法も学べます。 M5向けに構築・最適化されており、流動性が高くシグナルの精度が安定しているBTCUSDとXAUUSDで優れたパフォーマンスを発揮します。 このインジケーターは、ATRを基に自動計算されたエントリー、ストップロス、テイクプロフィットレベルを備えた明確なLong・Shortシグナルを提供するため、リスク管理が最初から組み込まれています。 マ
Market Structure Order Block Dashboard MT5 は、市場構造と主要な価格反応ゾーンをチャート上で直接読み取りたいトレーダー向けに設計された MT5 インジケーターです。BOS、ChoCH、オーダーブロック、Fair Value Gap (FVG)、流動性、Kill Zones、Volume Profile、そして素早い分析のためのコンパクトなダッシュボードを組み合わせています。 本インジケーターは、市場構造、ICT、Smart Money の概念を意思決定の枠組みとして使用するトレーダーを対象としています。トレンド継続、反転の可能性、価格の不均衡、流動性ターゲット、注目ゾーンをより構造的に特定する助けとなります。 購入者向けの付属リソース 購入後、MQL5 のプライベートメッセージにてご依頼いただくと、完全な PDF ユーザーガイドとパラメータ設定のヒントを提供いたします。MQL5 のプライベートメッセージによる直接的な技術サポート。 バージョン 1.20 では 2 つの重要な追加機能があります: Pending BOS / Pending Cho
Smart Structure Concepts MT5
Cristhian Alexander Gaibor Cuasquer
5 (1)
これは、ゾーンを描いてあなたに推測させる、もう一つの構造インジケーターではありません。 Smart Structure Concepts はあなたのために市場を読み取ります — XAUUSD(ゴールド)、外国為替、株価指数、暗号通貨、その他あらゆる市場 で Smart Money Concepts (SMC / ICT) 構造をリアルタイムでマーキングします。各ゾーンを設定するためにインプットに入る必要はもうありません: チャート上のインタラクティブなダッシュボードパネル で、ワンクリックで何を表示、非表示、調整するかを決定できます — プロパティを開く必要も、インジケーターを再起動する必要もありません。 このツールは MetaTrader 5 用の成長中のインジケーターとパネルのセットの一部です — すべて 11 言語の教育的なツールチップと、すべてのチャートに組み込まれたビジュアルメンターを備えています。 各ツールはあなたがトレードする間に教えます:任意のゾーン、シグナル、レベルにマウスを置くと、説明がチャートに直接表示されます。ブラックボックスなし、盲目的な注文なし。あなたはトレ
FX Levels: あらゆる市場における非常に高精度なサポート&レジスタンス 概要 通貨ペア、株式指数、個別銘柄やコモディティなど、どのような市場でも信頼できるサポートとレジスタンスを特定したいですか? FX Levels は伝統的な “Lighthouse” メソッドと先進的な動的アプローチを融合し、ほぼ汎用的な精度を実現します。ブローカーの実務経験を活かし、自動化されたデイリー更新とリアルタイム更新を組み合わせることで、 FX Levels は反転ポイントを見つけ、利益目標を設定し、自信をもってトレードを管理するための手助けをします。今すぐ試してみて、サポート/レジスタンス分析の正確性がどれほどトレードを向上させるかを実感してください! 1. FX Levels がトレーダーにとって非常に有用な理由 非常に正確なサポート&レジスタンスゾーン • FX Levels は異なるブローカー環境でもほぼ同一のゾーンを生成するよう設計されており、データフィードの差異や時刻設定のずれによる不一致を解消します。 • つまり、どのブローカーを利用していても一貫したレベルが得られるため、戦
Trend Forecaster – Since 2023. The Trend Forecaster indicator utilizes a unique proprietary algorithm to determine entry points for a breakout trading strategy. The indicator identifies price clusters, analyzes price movement near levels, and provides a signal when the price breaks through a level. The Trend Forecaster indicator is suitable for all financial assets, including currencies (Forex), metals, stocks, indices, and cryptocurrencies. You can also adjust the indicator to work on any time
Stratos Pali Indicator is a revolutionary tool designed to enhance your trading strategy by accurately identifying market trends. This sophisticated indicator uses a unique algorithm to generate a complete histogram, which records when the trend is Long or Short. When a trend reversal occurs, an arrow appears, indicating the new direction of the trend. Important Information Revealed Leave a review and contact me via mql5 message to receive My Top 5 set files for Stratos Pali at no cost ! Down
トレンド スクリーナー インジケーターでトレンド取引の力を解き放ちます。ファジー ロジックと複数通貨システムを活用した究極のトレンド取引ソリューションです。 ファジー ロジックを活用した革新的なトレンド インジケーターである Trend Screener を使用して、トレンド取引を向上させます。 これは、13 を超えるプレミアム ツールと機能、および 3 つの取引戦略を組み合わせた強力なトレンド追跡インジケーターであり、Metatrader をトレンド アナライザーにする多用途の選択肢となります。 期間限定オファー : トレンド スクリーナー インジケーターは、わずか 65 ドルで生涯ご利用いただけます。 (元の価格 50$ ) (オファー延長) Trend Screener の 100% 非再描画精度の揺るぎない精度を体験して、取引の決定が過去の価格変動の影響を受けないようにしてください。 マルチタイムフレームおよびマルチ通貨機能の多用途性を解放し、比類のない自信を持って外国為替、商品、暗号通貨、インデックスの世界を取引できるようにします。 Trend Screener の包括的な戦
この製品は 2026 年の市場向けに更新され、最新の MT5 ビルドに最適化されています。 価格更新のお知らせ: Smart Price Action Concepts は現在 $200 で提供されています。 次の 30 件の購入 後、価格は $299 に上がります。 特別オファー: 購入後、私にプライベートメッセージを送ることで、 無料ボーナス + ギフト を受け取ることができます。 まず、このトレーディングツールはリペイントなし、再描画なし、遅延なしのインジケーターであり、プロフェッショナルな取引に最適であることを強調しておきます。 Online course , and manual Smart Price Action Concepts Indicator は、初心者から経験豊富なトレーダーまで使える非常に強力なツールです。20 種類以上の便利なインジケーターを 1 つにまとめ、Inner Circle Trader Analysis や Smart Money Concepts Trading Strategies などの高度な取引アイデアを組み合わせています。このインジケ
スイングトレーディング は、トレンドの方向のスイングと可能な反転スイングを検出するように設計された最初のインジケーターです。トレーディングの文献で広く説明されているベースラインスイングトレーディングアプローチを使用します。インディケータは、いくつかの価格と時間のベクトルを調査して、全体的なトレンドの方向を追跡し、市場が売られ過ぎまたは買われ過ぎて修正の準備ができている状況を検出します。 [ インストールガイド | 更新ガイド | トラブルシューティング | よくある質問 | すべての製品 ] むち打ちを起こさずに市場スイングの利益 インジケーターは常にトレンドの方向を表示します 色付きの価格帯は機会のベースラインを表します 色付きのダッシュは、可能な反転スイングを表します この指標は、独自の品質とパフォーマンスを分析します 複数時間枠のダッシュボードを実装します カスタマイズ可能なトレンドおよびスイング期間 電子メール/サウンド/プッシュアラートを実装します インジケータは再描画またはバックペインティングではありません Swing Tradingとは Swing Tradingは
トレンドトレーディング は、タイミングのプルバックとブレイクアウトにより、市場で起こっているトレンドから可能な限り利益を得るように設計された指標です。確立されたトレンドの中で価格が何をしているかを分析することにより、取引の機会を見つけます。 [ インストールガイド | 更新ガイド | トラブルシューティング | よくある質問 | すべての製品 ] 自信を持って効率的に金融市場を取引する むち打ちにならずに確立されたトレンドから利益を得る 収益性の高いプルバック、ブレイクアウト、早期の逆転を認識する この指標は、独自の品質とパフォーマンスを分析します 複数時間枠のダッシュボードを実装します インジケーターは再描画されていません 電子メール/音声/視覚アラートを実装します 確立されたトレンドは多くの取引機会を提供しますが、ほとんどのトレンド指標はそれらを完全に無視しています。インジケーターの解釈はかなり簡単です: (1) トレンドの変化 (2) トレンドの方向への後退 (3) トレンドの方向へのブレイクアウト 赤いダッシュ は下降トレンド中の修正です 青いダッシュ は上昇トレンド中
BTMM State Engine Pro is a MetaTrader 5 indicator for traders who use the Beat The Market Maker approach: Asian session context, kill zone timing, level progression, peak formation detection, and a multi-pair scanner from a single chart. It combines cycle state logic with a built-in scanner dashboard so you do not need the same tool on many charts at once. What it does Draws the Asian session range; session times can follow broker server offset or be set in inputs. Tracks level progression (L
作者のその他のプロダクト
This indicator draw a watermark on the chart, with the timeframe and symbol name. You can change everything, including add a aditional watermark. Functions: Symbol watermark: Size -  text size. Font -  text font. Color -  text color. Background text -  watermark at foreground or background mode. Horizontal correction -  x correction in pixels. Vertical correction -  y correction in pixels. Separator period X symbol -  what will separate the period from symbol. Aditional watermark: Enable custom
FREE
Round numbers (or key levels) is an amazing strategy. These numbers are strong support and resistance levels. So what this indicator does is draw horizontal lines on the chart to help you find these levels. Configurations: Key levels in pips - distance between the lines. Color -   lines color. Style -   lines style. Width -  lines width. Display at background -  draw lines in front or back of candles. Selectable -  turn on or off the option to select the lines. Lines identification -  identifica
FREE
Simple indicator that draws the market hours on chart (broker, local and GMT). Functions: Horizontal distance - from border. Vertical distance - from border. Color - text color. Font - text font. Size - text size. Corner - which chart corner will be drawn. Show seconds - show or hide seconds. Draw as background - candles front or back. Label local - text before local time. Label broker - text before broker time. Label GMT - text before GMT time. Separator - separator between label and time Objec
FREE
T Trade Panel Pro 2 - 究極のリスク管理&高速注文ツール LT Trade Panel Pro   は、MetaTrader 5 において精度、スピード、そして完璧なリスク管理を求めるトレーダーのための究極のツールです。 スキャルピング   や   デイトレーダー   向けに設計されており、複雑な注文実行をワンクリックで直感的に行えるようにします。 最新の   バージョン 2   では、システムを全面的に刷新し、遅延を最小限に抑え、独自の資金保護機能を追加して最高のパフォーマンスを実現しました。 なぜ LT Trade Panel Pro を選ぶのか? 多くのトレーダーが失敗する原因は、リスク管理の規律不足にあります。 LT Trade Panel Pro   は、最も重要なプロセスである「リスクを一定に保ち、適切なタイミングでポジションを保護する」ことを自動化します。 プロップファーム (Prop Firms)   やプロフェッショナルな口座で取引する方にとって、欠かせないツールです。 主な機能: 自動ロット計算:   手動でロットを計算する必要
Volume Weighted Average Price or VWAP is an indicator wich shows different average prices on chart. This is very useful to find strong negotiation price areas and as trend following. Configurations: Day, Week and Month - Show different VWAPs according to the period. You can change each line style on "colors" tab. Any doubt or suggestion please contact us. Enjoy! This is a free indicator, but it took hours to develop. If you want to pay me a coffee, I appreciate a lot   <3 PayPal, Skrill, Nete
FREE
LT Volume
Thiago Duarte
4.73 (15)
This is a conventional volume indicator, which displays the ticks or real volume (if available from your broker). But it has others features like: 5 color schemes: single, when crossing with moving average, when crossing a specific level, when having different volume between bars and when candle change color. Being hable to have a customizable moving average. Being hable to have a value indicator line. Many thanks to  Diego Silvestrin  for the ideas to version 1.1 and   Konstantin Demidov   for
FREE
LT Trade Panel Lite - 迅速な執行と無料の注文パネル LT Trade Panel Liteは、 MetaTrader 5で最も実用的かつ高速な裁量取引(手動取引)用パネルです。 マニュアル注文において圧倒的なスピードを求めるトレーダー向けに設計されており、 インデックス(指数)、 株式、 FXのデイトレードに最適です。 この無料バージョンは、 コストをかけることなくプロフェッショナルな精度で取引するための必須ツールを提供します。 LITEバージョンで利用できる機能: 即時執行(ワンクリック注文): 1回クリックするだけで、 買い(Buy)、 売り(Sell)、 全決済(Close)が可能です。 キーボードショートカット: キーボードの「B(買い)」「S(売り)」「C(全決済)」キーを使い、 プロのように素早く操作できます。 ️ シンプルな管理: すべての注文に対して、 標準のストップロス(損切り)とテイクプロフィット(利確)をポイント単位で事前設定できます。 基本モニタリング: 当日の損益、 保有ボリューム、 リアルタイムのスプレッドをパ
FREE
This indicator draw a line on high and low levels of X number of days. It is possible to have an alert (in the software and mobile app) for when the price breaks the high or low of the current day. Configurações: Days -   past days to calculate (1 = actual day only). Alert when reach levels -   activate the alert for specific levels or both. Push notification -   enable the alert to the mobile MT5 app. Appearance High -   high level color. Low -   low level color. Size actual day -   thickness
FREE
The Weis Wave first takes the market volume and then organizes it with the price into Wave charts. It is the only software that will present the true picture of the market before you. If anyone of you, has watched an intraday price movement then you must know that it unfolds in a series of selling as well as buying waves-a procedures tearing down and building up. Wave analysis is an integral part of the trading method. The indicator helps to deal with today’s volatile market. Moreover, it works
FREE
LT Force
Thiago Duarte
5 (5)
For those who like trend the Force will be a very useful indicator. This is because it is based on the famouse ADX, which measure the strenght of a trend, but without its 3 confusing lines. Force has its very simple interpretation: if the histogram is above zero level the trend is up, otherwise it is down. You can use it to find divergences too, which is very profitable. Thanks to Andre Sens for the version 1.1 idea. If you have any doubt or suggestion, please, contact me. Enjoy! MT4 version: 
FREE
RSI with moving average is great to see when the price is overbought and oversold instead of RSI only. INPU T PARAME TERS : RSI: Period - RSI period. Price - RSI applied price. Color scheme - RSI color scheme (4 available). MOVING AVERAGE: Period - MA period. Type - MA  type. Apply - MA applica tion. Shift - MA shif t (correc tion). PRICE LINE: Show - specify if line with price, only line or nothing. Style - line style. OTHER: Overbought level - specify  the level . Overbought descriptio
FREE
This indicator show the candle remaining time on the chart and/or in the corner of the window. It also display notificaton (popup and push) when a new candle is formed (optional). You configure the timer on candles and at chart corner. I don't need to explain the functions because are very simple. MT4 version:  https://www.mql5.com/en/market/product/38677 Any doubt or suggestion please contact us. Enjoy! This is a free indicator, but it took hours to develop. If you want to pay me a coffee, I a
FREE
This indicator show the candle remaining time on the chart and/or in the corner of the window. It also display notificaton (popup and push) when a new candle is formed (optional). You configure the timer on candles and at chart corner. I don't need to explain the functions because are very simple. MT5 version:  https://www.mql5.com/pt/market/product/38470 Any doubt or suggestion to a new feature please comment. Enjoy!
FREE
New Candle Alert is a simple indicator that notify you when a new candle is formed. Func tions : Alert type - option to choose between message with sound or only sound. Message -   alert message. Push notifications -   enable push notifications. Show timeframe -  show the symbol timeframe. Show hour -   show the alarm time. Test message - if you don't want to wait a new candle formed to see the message. MT4 version:  https://www.mql5.com/pt/market/product/37988 Hope you enjoy it. Any doubt or su
FREE
Are you the trend surfing type? Do you like to follow the big sharks? Nope? So you are the type that trades reversion? Awaiting the trend exhaustion and entering on trade? So this indicator is for you ! With it is extremely easy to identify the trend and when it reverses because the chart is automatically colored according to a defined moving average. You can change it settings and make it your own (or hide it). In addition it is possible to have indicative arrows on chart and also popup and p
LT EXHAUSTION OSCILLATOR - 買い手・売り手エグゾースションオシレーター 概要 LT Exhaustion Oscillator は、独自の多層フィルタリング技術を用いて、買い手(Bulls)と売り手(Bears)の勢いの枯渇(エグゾースション)を測定する高度なインジケーターです。従来のオシレーター(RSI、ストキャスティクス、CCI)に含まれるノイズを最大 90% 削減し、本物の反転ポイントにおいて明確な買われ過ぎ・売られ過ぎシグナルを提供します。 高確率のエントリーポイントを探し、ダマシシグナルを排除したいトレーダーに最適です。 仕組み このインジケーターは、4 段階の平滑化フィルターを通じて市場の強さを分析します。 L0:Bulls Power と Bears Power の生データを取得 L1-L3:ノイズやランダムなスパイクを除去する 3 層のフィルター 結果として、ラインは 0% ~ 100% の範囲で推移します。 0-10%(売られ過ぎ):売り手の勢いが枯渇 → 買いシグナル 90-100%(買われ過ぎ):買い手の勢いが枯渇 →
Are you the type who likes to use moving averages and surf the trend? Me Too! that is why I developed this indicator. It is basically a moving average that changes the color according to the trend (up or down). Its appearance can be customized and the price method too. The setup is very simple, no need to explain. If you have any questions or find any errors please contact us! Enjoy! This is a free indicator, but it took hours to develop. If you want to pay me a coffee, I appreciate a lot   <3
FREE
Are you a  trend surfer like us? Do you use Moving Averages too? Ever wanted the are between them to be painted? Yeah, we solved this problem with the Filled MAs indicator! It is very simple, just puts two fully customizable Moving Averages on chart and fill the space between them, changing the color as they intersect. Thanks to gmbraz for the version 1.1 idea. Any questions os suggestions please contact me! Enjoy! This is a free indicator, but it took hours to develop. If you want to pay me a
FREE
This indicator draw a watermark on the chart, with the timeframe and symbol name. You can change everything, including add a aditional watermark. Functions: Symbol watermark: Size -  text size. Font -  text font. Color -  text color. Background text -  watermark at foreground or background mode. Horizontal correction -  x correction in pixels. Vertical correction -  y correction in pixels. Separator period X symbol -  what will separate the period from symbol. Aditional watermark: Enable custom
FREE
LT Easy Market - あらゆる市場を精密なトレードゾーンに変える 強いトレンド相場でトレードしようとして、迷子になったことはありませんか?あるいは、レンジ相場(保ち合い)でのエントリーポイントがはっきりと見えず、悔しい思いをしたことはありませんか?LT Easy Marketは、このジレンマを解決するために開発されました。値動きを完全に「正規化」し、常にレンジ(横ばい)状態であるかのような視覚効果を作り出すことで、買われすぎ・売られすぎのエクストリーム(極値)を外科手術のような精密さで簡単に見つけられるようにします。 == 正規化の魔法 == アセット(資産)が持つ本来の激しいボラティリティに振り回される代わりに、Easy Marketはスマートなアルゴリズムを適用し、あらゆる値動きを標準化されたスケール(尺度)に変換します。その結果、相場がトレンド状態であろうとレンジ状態であろうと、保ち合いや押し目・戻りにおける明確なエントリーチャンスを見極めることができます。 == 主な特徴 == 100% 自動正規化: ボラティリティを固定された予測可能なスケールに変換 極値(エクス
Round numbers (or key levels) is an amazing strategy. These numbers are strong support and resistance levels. So what this indicator does is draw horizontal lines on the chart to help you find these levels. Configurations: 1St level: Color - lines color. Style - lines style. Width -  lines width. 2Nd level: Second level lines? -  turn off second level lines. Color -  lines color. Style -  lines style. Width -  lines width. Space between lines in points -  I don't need explain :) Display at backg
FREE
LT Clock MT4
Thiago Duarte
4.9 (10)
Simple indicator that draws the market hours on chart (broker, local and GMT). Functions: Horizontal distance -  from border. Vertical distance -  from border. Color -  text color. Font -  text font. Size -  text size. Corner -  which chart corner will be drawn. Show seconds -  show or hide seconds. Draw as background -  candles front or back. Label local -  text before local time. Label broker -  text before broker time. Label GMT -  text before GMT time. Object ID -  identification from object
FREE
Are you tired of erasing the objects on chart and then having to put them back in? What if you had a tool that would allow you to hide and show all objects any time? Cool, huh? That is why I developed this tool as an indicator. With it you hide all objects using a shortcut button on chart or the keyboard (customizable). If you have any suggestions or find a bug, please, contact us. Enjoy!
FREE
Candle cross MA is an indicator that works "silently", that is, drawing only a moving average on the chart. It alerts you when the last candle cross with a moving average that you set. Alert is given only when the candle closes. The moving average settings are fully customizable. The indicator sends popup, and push notifications. You can also deactivate alerts when the chart is inactive. Are you the trend type?  Do not miss another opportunity!
FREE
History On Chart is an indicator that shows the "trail" of all trades made in a specific period of time. It shows the entry and exit point with their respective dates and prices. It also shows the type of trades and the cash result. Open trades are also displayed, but only the entry point. The indicator is free and fully customizable. If you have any questions please contact us. Enjoy! This is a free indicator, but it took hours to develop. If you want to pay me a coffee, I appreciate a lot   <
FREE
This is a simple indicator that shows the spread in points. It is useful for those like trade scalper, in addition to be customizable. Functions: Color - I don't need to explain :) Font type - I don't need to explain :) Font size - I don't need to explain :) First text - text in front of spread number Second text - aditional text after the spread number. Corner - specify the corner where the spread will be written. Horizontal distance - horizontal distance from the edge. Vertical distance - ve
FREE
This is an indicator that highlights the price range, specifically in the morning. So it is very easy to identify when these zones are broken, giving you an excellent entry opportunity! Range Breakout works on all symbols and timeframes. It displays past price regions and projects the current one. If you find any bug or have any suggestion, please, contact us. Enjoy!
Trailing Step is an EA that lets the order's stop loss at a specific distance of current price, set by pips. Its configuration is very simple: Trailing stop in pips - sets the stop loss distance in relation to the current price in pips. Trail step in pips - sets the "step" of stop loss in pips. Never miss a trade by forgetting to move the stop. Guarantee your profit! Any doubt or suggestion do not hesitate in contact us. Enjoy! Obs. You need to set the stoploss when you open your trades bec
FREE
This is an informant indicator, very simple. It shows how much the price has chanded in percentage in certain period (month, week, day and actual period). It is discreet and small, does not visually posslute the chart. If your MT is not on portuguese idiom the indicator will automatically change to english. Check out our most complete tool for the market, the Trade Panel:  https://www.mql5.com/en/market/product/42658 If you have any suggestion or find any bug, please, contact us. Enjoy! This is
FREE
For those who like trend the Force will be a very useful indicator. This is because it is based on the famouse ADX, which measure the strenght of a trend, but without its 3 confusing lines. Force has its very simple interpretation: if the histogram is above zero level the trend is up, otherwise it is down. You can use it to find divergences too, which is very profitable. If you have any doubt or suggestion, please, contact me. Enjoy! MT5 version:  https://www.mql5.com/en/market/product/41928 T
FREE
フィルタ:
Vladimir Shramchenko
557
Vladimir Shramchenko 2024.10.01 12:39 
 

Thank you for your hard work. Really great job. In this variety of such products, it is a gem in its quality of work on the chart

Americo Junior Laignier Tamura
130
Americo Junior Laignier Tamura 2024.02.14 15:26 
 

ユーザーは評価に対して何もコメントを残しませんでした

Thiago Duarte
258490
開発者からの返信 Thiago Duarte 2024.02.14 15:56
Olá. Vou entrar em contato contigo pelo chat.
Eblawsch
165
Eblawsch 2024.01.06 18:31 
 

Nice indicator, I use it with an own little script. It is easy. I like it. Friendly and helpful support. Thanks a lot!

Michael Prescott Burney
71124
Michael Prescott Burney 2023.12.02 06:39 
 

In the dynamic world of trading, simplicity often proves to be the key to success, and Easy Trend lives up to its name by seamlessly combining nine essential indicators into a single, user-friendly tool. As someone who values clarity in chart analysis, I've found Easy Trend to be a breath of fresh air in streamlining my trading strategy. The brilliance of Easy Trend lies in its straightforward strategy: a buy signal when the indicator turns blue and a sell signal when it turns red. This simplicity not only makes it accessible for traders of all levels but also eliminates the clutter caused by multiple indicators on your charts. The inclusion of nine powerful indicators - Moving Average, RSI, CCI, Parabolic SAR, William's Range, Stochastic, MACD, ADX, and Heiken Ashi - ensures a comprehensive view of the market conditions. When all these indicators align in the same direction, a clear and reliable signal is triggered, providing a strong basis for confident trading decisions. Customization is another standout feature of Easy Trend. Traders have the flexibility to configure each indicator according to their preferred trading style. This adaptability ensures that the tool caters to a diverse range of trading strategies, making it a versatile companion for traders with varying preferences. The option to enable or disable signals on the chart, coupled with popup alerts, adds a layer of convenience to the trading experience. Easy Trend not only simplifies your analysis but also keeps you informed without constant monitoring, allowing you to stay ahead of market movements. Gone are the days of chart pollution with multiple indicators. Easy Trend offers a clean and efficient solution to trend analysis, enhancing the visual appeal of your charts while maintaining the depth of market insights. In conclusion, Easy Trend has become an indispensable part of my trading toolkit. Its simplicity, combined with the strength of multiple indicators, has elevated my confidence in making well-informed trading decisions. If you're looking to declutter your charts without compromising on analysis, Easy Trend is the answer. Embrace the ease, embrace the trend – Easy Trend is your shortcut to a more streamlined and profitable trading journey!

Agbakeleke Idowu
734
Agbakeleke Idowu 2023.03.13 22:49 
 

Very worst indicator on Earth

valdecism
128
valdecism 2022.11.05 12:53 
 

Amazing tool! I have been trying a lot of indicators in the last years, but this one is the best I ever used. Thanks a lot man!!! Regards.

Thiago Duarte
258490
開発者からの返信 Thiago Duarte 2022.11.05 17:20
Thank you! I am glad that you liked it :D
Wolfgang Zaunschirm
1394
Wolfgang Zaunschirm 2022.04.09 09:38 
 

This is a really nice indicator to get a very fast and detailed overview about market conditions. Nevertheless during this crazy war time it is not possible to predict anything. Good job!

Thiago Duarte
258490
開発者からの返信 Thiago Duarte 2022.04.09 15:01
I am glad you liked it!
レビューに返信