Passage Victorious

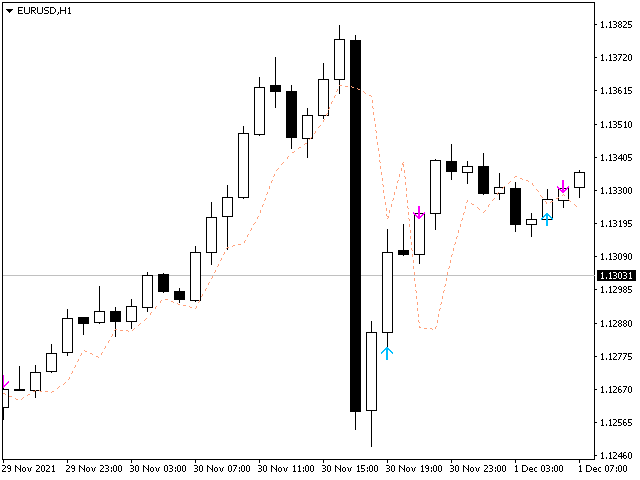
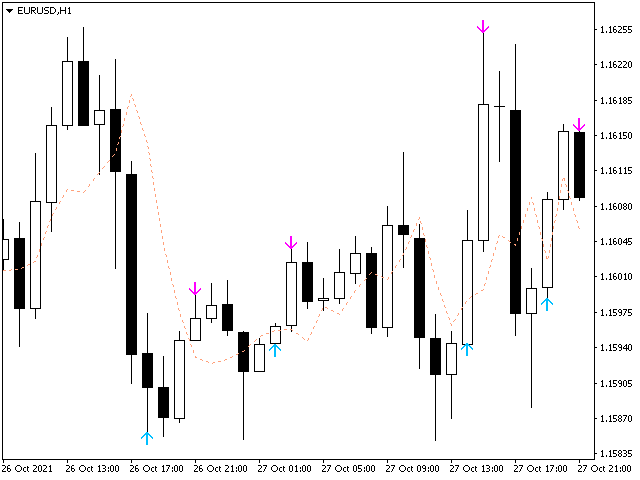
Passage Victorious is a handy tool, and even if you are used to trading on a clean chart, sometimes you need to take a look at this indicator. If you are not sure how to determine the trend inflection point and are concerned about how to draw trend lines then this indicator is for you. From now on, you do not need to sit near the computer and analyze the price, just use this indicator.

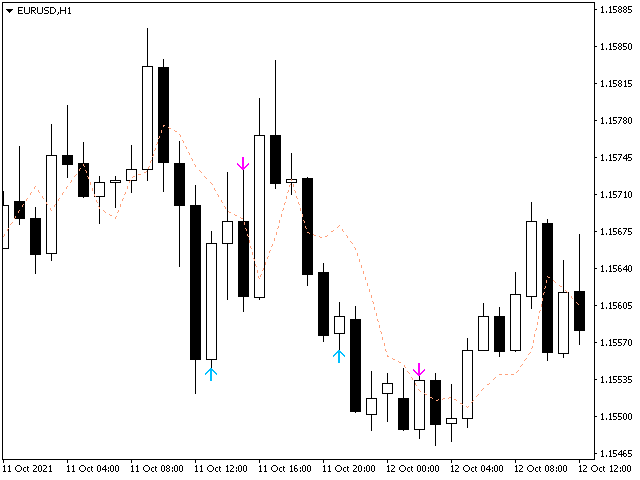
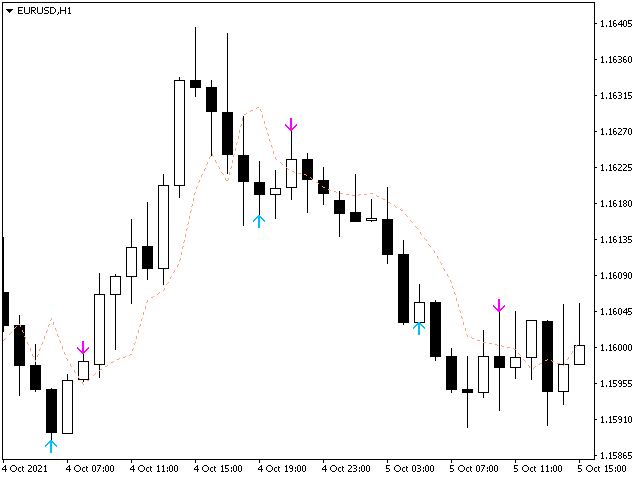
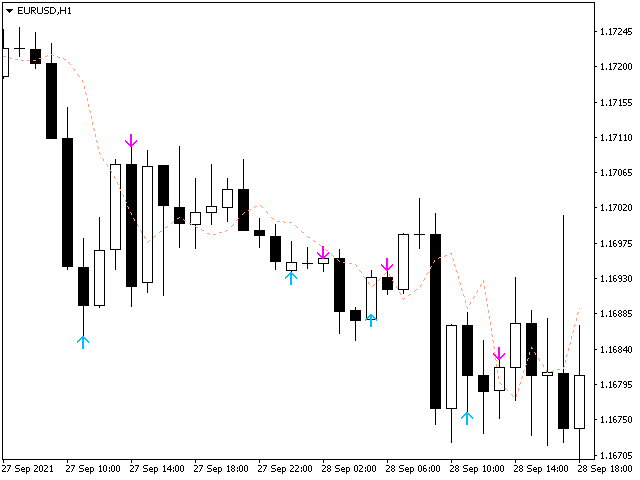
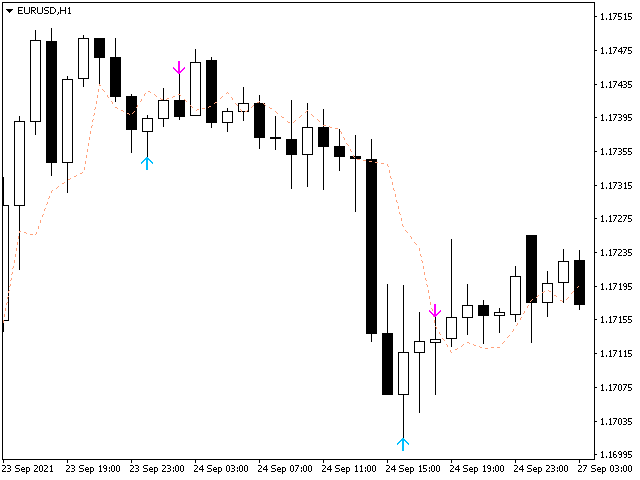
The indicator calculates saturation levels of the price chart. A signal to exit the oversold area is a buy signal. A signal to exit the overbought area is a sell signal. Most often, a good trend is visible on the price chart visually. But an experienced trader should clearly understand the current alignment of forces in the market before entering. And the indicator will help the trader make decisions by helping him with the appropriate signals.
おすすめのプロダクト
Gold Spread Monitor – Spread Display Utility for MetaTrader 5 Gold Spread Monitor is a lightweight utility for MetaTrader 5 that displays the current spread of the selected symbol directly on the chart. The tool is designed to help traders observe spread conditions in real time without switching between terminal windows. It provides a simple visual panel that shows the current spread value and its status based on predefined thresholds. Gold Spread Monitor is suitable for manual traders who want
CCI FIXED DUALとは何か CCI FIXED DUALは、プロフェッショナル向けのTrend Direction Filterであり、次の要素を正確に識別するために設計されています。 市場の支配的な方向 値動きの構造的な質 メイントレンドと加速局面との一貫性 これは直接的なエントリー指標ではありません。 これはクラシックなオシレーターではありません。 これはコンテキストツールであり、トレーダーがいつ取引すべきか、そしていつ取引すべきでないかを判断するのを助け、市場のノイズと解釈ミスを大幅に減らすために設計されています。 CCI FIXED DUALの基本哲学 CCI FIXED DUALが基づいている原則はシンプルですが非常に強力です。 シグナルは、市場構造と一貫している場合にのみ価値を持ちます。 この理由から、このインジケーターは 単一の値を使用しません 価格に衝動的に反応しません 無理に反転ポイントを探しません その代わりに、次の要素に基づいて階層的なトレンドの読みを構築します。 Typical Price上のCCI 異なる速度のLWMA移動平均 短期 中期 長期の動的
VGRSI — Visibility Graphs Relative Strength Index is a technical indicator for MetaTrader 5 based on the concept of visibility graphs applied to financial time series. Unlike classical oscillators that mainly use local price changes, VGRSI analyses the geometric structure of price movement. It detects selected past points that remain “visible” from the current price in the time–price plane and uses them to estimate the relative strength of upward and downward movements. The indicator is scaled t
概要 Candle Timer Countdown Pro は、現在のローソク足が終了するまでの残り時間を、滑らかで正確なカウントダウンとして表示します。さらに、円形のプログレスアーク(進行表示)を組み合わせることで、残り時間を瞬時に視覚的に把握できます。 ティック間で停止したり、時間がずれてしまう他のタイマーとは異なり、本インジケーターはサーバー時間の補間(Server Time Interpolation)を使用し、M1 から MN まであらゆる時間足で途切れのないスムーズなカウントダウンを実現します。 1分足でのスキャルピングでも、H4でのスイングトレードでも、現在のローソク足が正確にいつ確定するのかを把握することで、エントリータイミングの最適化、ローソク足パターンの確認、そして早すぎる判断の回避に役立ちます。 このタイマーが他と違う理由 多くの MT5 用キャンドルタイマーは TimeCurrent() のみに依存しており、新しいティックが到着したときにしか更新されません。低ボラティリティ時や上位時間足では、ティックの間隔が数秒空くことがあり、その間タイマーが停止し、その後突
MT5 Drawdown Tracker – Track Your EA’s Performance with Precision! Take your trading analysis to the next level with our MT5 indicator designed to monitor, record, and report the drawdown of any Expert Advisor. Whether you’re fine-tuning your strategies or optimizing risk management, this tool gives you the insights you need. Key Features: Effortless Tracking: Automatically monitors the drawdown levels of your EAs with precision. Comprehensive Data Storage: Accurately logs each drawdown event,
このインジケーターは、最適なテイクプロフィットとストップロスのレベルを表示します。これらのレベルは、履歴データに基づいて計算されます。最初の開始時に、インジケーターは履歴についてトレーニングされます。その後、彼は価格が将来このレベルまたはそのレベルを超える可能性を評価し、ストップオーダーを出すための最適なオプションを選択します。たとえば、利益が最大になり、価格がそのレベルに達する確率が可能な限り高くなるように、利益値を選択します。ストップロスレベルは最小限である必要がありますが、それに達する可能性は最小限である必要があります。これにより、勝つための数学的な期待値が可能な限り高いレベルになります。 また、このインジケーターは、サポートレベルとレジスタンスレベルの形で使用できます。これを行うには、さまざまな予測の長さとオフセットを組み合わせることができます。 インジケーターパラメーター: 長さ-予測の長さ。このパラメータは、バーの将来の取引の予想期間を示します。 Shift-バーをシフトします。このパラメーターのおかげで、過去のインジケーターの読み取り値を確認できます。 幅-線幅。 Cl
RBreaker Gold Indicatorsは、金先物の短期日内取引戦略であり、トレンドフォローと日内反転の2つの取引手法を組み合わせたものです。トレンド相場での利益を捉えるだけでなく、相場が反転した際には迅速に利確し、その流れに沿ってポジションを反転させることができます。 この戦略は、アメリカの雑誌『Futures Truth』において、15年連続で最も収益性の高い取引戦略トップ10に選ばれた実績を持ち、非常に長いライフサイクルを誇り、現在も国内外で広く使用・研究されています。 本インディケーターは、2026年の金先物の値動きに対応し、14日間のATR指標に基づいて、ブレイクアウト係数A、観察係数B、リバーサル係数Rをより合理的な値で定義しています。非常に優れたインディケーターであり、安定的な年間収益を実現しています。ぜひおすすめします〜
If you want test the breakeven indicator contact me here on mql5 and i send to you a demo version active for 1 week. Breakeven line is usefull tool for you trading. The aim of breakeven line is shown graphically the price level where your positions start start to be profitable. There are 2 simple functions in this breakeven indicator : 1- Is possible calculate the breakeven price only for the symbol where you attached the indicator. 2- Is possible calculate the breakeven price for all the po
Bollinger Band Scanner Pro - Multi-Symbol Signal Detector Professional Trading Tool for MT5 Transform your trading with the most advanced Bollinger Band scanner available for MetaTrader 5! Key Features Intelligent Signal Detection Precision Algorithm : Advanced multi-phase signal detection that identifies extreme BB reversals Smart Filtering : Eliminates false signals using middle-line crossing analysis Trend-Aware : Detects BUY signals in downtrends and SELL signals in uptrends only Mu
SM Zones Proインジケーターの機能をより深く理解したい場合は、まず無料のSM Zonesインジケーターをダウンロードして試してみることをお勧めします。このインジケーターは、単一のEURUSD銘柄を様々な時間枠で使用できるように調整されています。SM Zonesは、こちらのマーケットからダウンロードできます。SMZones Proは、SM Zonesとは異なり、最大10種類の銘柄を同時に分析できます。 スマートマネーマネジメント戦略の原則に基づいて開発されたSM Zones Proインジケーターは、MetaTrader 5 (MT5)プラットフォームのトレーダーにとって非常に便利なツールです。SM戦略で使用されるすべての重要なゾーン(市場構造、流動性が高まる価格水準、銘柄の価格が向かう「価格マグネット」ゾーン(不均衡、注文ブロック、fvg、ブレーカーブロック、緩和ブロック))をチャート上にグラフィカルに表示します。強気相場に影響を与えるゾーンは緑色で、弱気相場に影響を与えるゾーンは茶色で強調表示されます。これらのレベルは、価格変動の可能性のある領域を反映しており、多くの場合
トレードチャンスを逃したくないけど、ずっとチャートを見続けるのは辛い・・・・ そんなあなたのために、この商品が存在します!! Touch Alert Pro - 商品概要 価格がアラートオブジェクトに到達したら「MetaTrader5」アプリに通知を送るインジケーターです。チャート上のボタンを押して自由にアラートオブジェクトを追加・削除できます。また、アラートオブジェクトごとに通知上限回数を設定することができます。自動売買の機能はないため、トレード補助のツールとしてお使いください。 - 機能説明 ①コントロールパネル 6つのボタンで構成されています。上からボタンの機能を紹介します。 ・水平線作成ボタン:アラート機能を持つ水平線を1つチャート上に設置します。 ・チャネルライン作成ボタン:アラート機能を持つチャネルラインを1つチャート上に設置します。 ・トレンドライン作成ボタン:アラート機能を持つトレンドラインを1つチャート上に設置します。 ・フィボナッチリトレースメント作成ボタン:アラート機能を持つフィボナッチリトレースメントを1つチャート上に設置します。 ・フィボナ
Gecko EA MT5
Profalgo Limited
5 (1)
NEW PROMO: Only a few copies copies available at 349$ Next price: 449$ Make sure to check out our " Ultimate EA combo package " in our   promo blog ! Gecko runs a simple, yet very effective, proven strategy.  It looks for important recent support and resistance levels and will trade the breakouts.  This is a "real" trading system, which means it will use a SL to protect the account.  It also means it will not use any dangerous techniques like martingale, grid or averaging down. The EA shows its
Visual Dolphin Indicator
AL MOOSAWI ABDULLAH JAFFER BAQER
Visual Dolphin Indicator Unlock the rhythm of the market with the Visual Dolphin Indicator, your ultimate tool for identifying and capitalizing on market trends with clarity and confidence. Designed for both novice and experienced traders, this indicator eliminates the noise and guesswork, providing crystal-clear buy and sell signals directly on your chart. The Logic Behind the Waves The core of the Visual Dolphin Indicator is a sophisticated yet intuitive dual-wave system based on moving avera
The Standard Deviation (StdDev) indicator drawn using a tick chart. After launching it, wait for enough ticks to come. Parameters: Period - period of averaging. Method - method of averaging. calculated bar - number of bars for the indicator calculation.
Pair correlation divergence. Define your pair in indicator setting with this format : SYMBOL1:SYMBOL2,SYMBOL3:SYMBOL4 Already Defined Symbols : EURUSD:GBPUSD,AUDUSD:NZDUSD,USDCHF:EURUSD,USDCAD:Crude,XAUUSD:AUDUSD Symbol name should match the exact case as you see it in left panel where all symbols are listed. CAUTION  : If you drag any symbol on screen and indicator doesn't paint(live mode, not strategy tester) then just  Right click-> indicators list-> select divergence indicator-> edit-> ok-
Volumatic VIDYA ダッシュボード Volumatic VIDYA ダッシュボードをご紹介します — 20の通貨ペアと全タイムフレームにわたる買いと売りのシグナルを提供するだけでなく、完全なトレード設定を提供するプロフェッショナルグレードの適応型トレンドスキャナーです:エントリーゾーン、ストップロス、テイクプロフィット — すべてのシグナルで自動的に計算されます。 推測不要。手動計算不要。実行に必要なすべてを備えた適応型シグナルのみ。 これに心当たりはありませんか? トレンドエントリーを探して何十ものチャートを手動でスキャンしている — それでもほとんどを見逃している 適切なタイミングで見ていなかったため、利益の出るプルバックエントリーを逃している 数学ではなく推測に基づいてストップロスとテイクプロフィットを設定している 固定移動平均線がトレンド中に遅れすぎるか、レンジ中に偽シグナルを出している チャート分析に何時間も費やし、自信を持ってトレードを執行できていない これらのいずれかが当てはまるなら — Volumatic VIDYA ダッシュボードはまさにあなたのために作ら
Gold Jesus Blessings AI Neural EA MT5 for XAUUSD Auto Trading - New York Session Recommended - Use Latest Upgrade V22 as of 22 Jan 2026 Use Every tick Mode & 1 Mint OHLC mode for Back-test.  (Note the EA is by default set for 3 Digit Broker, for 2 Digits broker, write to me for set file-I'll share) Launch Offer for 1st 10 Copies Only at $198 - Price will be hiked to $299 after sale of 1st 10 copies. Advanced AI-Driven XAUUSD Trading Expert Advisor Gold Jesus Blessings AI Neural EA MT5 is a fu
This indicator can be considered as a trading system. It offers a different view to see the currency pair: full timeless indicator, can be used for manual trading or for automatized trading with some expert advisor. When the price reaches a threshold a new block is created according to the set mode. The indicator beside the Renko bars, shows also 3 moving averages. Features renko mode median renko custom median renko 3 moving averages wicks datetime indicator for each block custom notification
平均方向性指数(ADX)マルチカレンシースキャナー MT5 は、複数の通貨ペアを同時に分析するために設計された高度なトレーディングインジケーターです。これは、平均方向性指数に基づくリアルタイムのシグナルを提供することで、意思決定プロセスを強化したいトレーダーに利益をもたらし、効率的な市場トレンド分析を可能にします。 このツールは、トレンドの強さと方向の動きを簡単に特定できるようにし、ADXに基づく戦略を採用するトレーダーにとって不可欠な資産となっています。リアルタイムのアラートとユーザーフレンドリーなダッシュボードを備え、トレーダーは市場の状況を迅速に評価し、情報に基づいた取引選択を行うことができます。 MQL製品のインストールガイド | MT4/MT5で購入したMQL製品の更新 | 一般的なトラブルシューティングガイド | インジケーター設定 / ガイド 主な機能 バッファ統合: インジケーターの値をアクセス可能なバッファとして公開し、Expert Advisorが自動取引のためにシグナルデータを利用できるようにします。 視覚的矢印シグナル: シグナルキャンドルのチャート上に明確なB
Hello community, on this occasion I'm here to introduce you to Universal Professional Trading System MAIN PURPOSE This is an advanced and universal technical indicator designed to work in any market (Forex, Metals, Cryptocurrencies, etc.) and any timeframe. It's not an EA that trades automatically, but rather a comprehensive analysis and signals system. KEY FEATURES 1. AUTOMATIC SYMBOL DETECTION Automatically identifies asset types (Forex, Gold, Silver, Crypto, JPY pairs) Automatically
インディケータは現在のクオートを作成し、これを過去のものと比較して、これに基づいて価格変動予測を行います。インジケータには、目的の日付にすばやく移動するためのテキスト フィールドがあります。 オプション: シンボル - インジケーターが表示するシンボルの選択; SymbolPeriod - 指標がデータを取る期間の選択; IndicatorColor - インジケータの色; HorisontalShift - 指定されたバー数だけインディケータによって描画されたクオートのシフト; Inverse - true は引用符を逆にします。false - 元のビュー。 ChartVerticalShiftStep - チャートを垂直方向にシフトします (キーボードの上下矢印)。 次は日付を入力できるテキストフィールドの設定で、「Enter」を押すとすぐにジャンプできます。
ICT Silver Bullet – Time Window Indicator The ICT Silver Bullet indicator automatically marks the ICT Silver Bullet time windows on your chart, helping you stay focused on the highest-probability setups defined by the ICT methodology. This tool is especially powerful when combined with a Fair Value Gap (FVG) indicator – simply wait for an FVG setup to form inside the Silver Bullet window, and you’ll have a precise time-based confirmation for your entries. Key Features: Automatic Silver Bullet Wi
概要 MetaTrader 5専用に設計された、強力かつ遅延ゼロのツール「KS Invert Chart Pro Indicator」で、チャート分析に新たな視点を取り入れましょう。この革新的なインジケーターは、バーやローソク足を数学的に反転させる(価格データに-1を乗じる)ことで、従来の視点では見落とされがちな隠れたパターン、逆張り(コントラリアン)の好機、そして逆相関関係を浮き彫りにします。相関戦略、マルチタイムフレーム分析、あるいはヘッジ状況のモニタリングを行う上級トレーダーに最適なツールです。現在のチャート上に潜む捉えにくいパターンを特定する場合でも、外部シンボル(銘柄)のデータをリアルタイムで同期させる場合でも、このインジケーターは一切の遅延なく、即座に有益な洞察を提供します。 主な特長: 即時反転:チャートを上下反転させ、逆転した視点で表示します。パターン認識や逆張りトレードに最適です。 外部シンボル同期:任意のブローカーシンボル(例:EUR/USDとGBP/USD)を、同一または異なる時間足上で同時に表示し、反転させることができます。 多用途な活用:ドルインデッ
Trend Hunter は、外国為替、仮想通貨、CFD 市場におけるトレンド指標です。 このインジケーターの特別な特徴は、価格がトレンドラインをわずかに突き抜けたときにシグナルを変更することなく、自信を持ってトレンドに従うことです。 インジケーターは再描画されず、バーが閉じた後に市場に参入するシグナルが表示されます。 トレンドに沿って移動すると、インジケーターにはトレンドの方向に追加のエントリーポイントが表示されます。 これらのシグナルに基づいて、小さなストップロスで取引できます。 トレンドハンターは正直な指標です。 インジケーター信号の上にマウスを置くと、信号の潜在的な利益と可能なストップが表示されます。 新しい信号が表示されると、次の通知を受け取ることができます。 アラート プッシュ通知 メールによる通知 電報での通知 チャートのスクリーンショットも Telegram に送信されるため、取引を決定するために端末を開く必要はありません。 インジケーターシグナルは、電報チャネル https://www.mql5.com/ja/market/product/11085#!ta
The indicator - "ATR Line" determines the current trend and gives signals to buy (green arrow to the top) or sell (red arrow to the bottom). The indicator calculation is based on the deviation of the average price of the instrument from its average true range - ATR. The moving average of prices is used to reduce "market noise". If the main line of the indicator - "ATR Line" is lower the instrument price chart, then the market is in a "bullish" trend. If the main line of the indicator is higher t
Trade Today
Gayathiri Gopalakrishnan
TRADE TODAY — Advanced Pattern Recognition Indicator for MetaTrader 5 TRADE TODAY is a chart pattern recognition indicator that detects price structures in real time, scores each signal using trend and momentum filters, and displays entry, stop-loss, and take-profit levels directly on the chart. Push notifications, email, and sound alerts are supported. How It Works The indicator scans recent price action for swing points at multiple depths and identifies the following structures: Double Top, Do
RED ZONE Monitor Loss-Cut & Break-Even Risk Monitor for Averaging Traders (MT5) RED ZONE Monitor is a risk management indicator for traders who use averaging, scaling-in, or multiple open positions . It visually displays: The loss-cut (liquidation) risk zone The break-even price Based on current open positions, lots, and margin conditions This indicator does not provide entry signals. It does not promise profits. It shows where your account actually fails if price moves against you. What RED ZO
Complete SMC/ICT Indicator MT5 — Smart Money Concepts ツール Complete SMC/ICT Indicator は、チャートウィンドウ上で直接動作する独立型の Smart Money Concepts 分析ツールです。市場構造、不均衡、流動性ゾーンを機関投資家レベルで検出し、完全なカスタマイズとアラート機能を備えています。   機能   このインジケーターは 10 の主要な SMC 要素を検出します:スイング高値と安値、公正価値ギャップ、オーダーブロック、構造のブレイク、キャラクターの変化、マーケットストラクチャーシフト、等しい高値と安値、流動性スイープ、ディスプレースメントキャンドル、プレミアム/ディスカウントゾーン。各機能はドラッグ可能なパネルから個別に切り替え可能で、ゾーンは設定に応じてチャート上に前方へ拡張されます。   マルチタイムフレーム分析   最大 3 つのタイムフレームで同時に動作可能で、TF1、TF2、TF3 に独立した設定を行えます。トレーダーはパネルから直接表示タイムフレームを切り替えることができ、再
HAS RSI Signal — SL/TP自動計算機能付き プロフェッショナル・トレンドインジケーター HAS RSI Signal は、信頼性の高いクラシックな手法と最新のノイズ除去アルゴリズムを融合させた強力なトレーディングツールです。 平均足スムーズド(Heiken Ashi Smoothed) と RSI を組み合わせることで、トレンドの転換点や買われすぎ・売られすぎ圏からの脱出タイミングを正確に捉え、明確なエントリーシグナルを提示します。 主な特徴: 二重のフィルタリング: 平均足スムーズドで市場の「ノイズ」を除去し、RSIで勢い(モメンタム)の強さを確認します。 損切り・利確ラインの自動計算: 単にシグナルを出すだけでなく、ボラティリティ( ATR )に基づいた最適なストップロス(SL) と テイクプロフィット(TP)を自動で算出します。 視覚的な分かりやすさ: シグナルはチャート上にカラーキャンドルとして表示されるため、一目でトレンドを把握でき、取引画面をスッキリと保てます。 充実の通知機能: アラート、音声、スマートフォンへのプッシュ通知機能を搭載。チャンスを逃すこと
TransitBlueOcean
Bonginkosi Innocent Khumalo
5 (1)
TransitBlueOcean is indicator system that uses ocean wave's pattern, to help one to know when to buy and when to sell. The indicator system is very powerful like the ocean waves. Join the mql5 channel for TransitBlueOcean  https://www.mql5.com/en/channels/transitblueocean   How to use: Zoom in so that the Ocean will appear on your chart. Buy when you see the candles, the candle will be above the ocean wave (buying signal). Sell when you can't see the candles, the candles will be inside the wav
このプロダクトを購入した人は以下も購入しています
ARIPoint is a powerful trading companion designed to generate high-probability entry signals with dynamic TP/SL/DP levels based on volatility. Built-in performance tracking shows win/loss stats, PP1/PP2 hits, and success rates all updated live. Key Features: Buy/Sell signals with adaptive volatility bands Real-time TP/SL/DP levels based on ATR Built-in MA Filter with optional ATR/StdDev volatility Performance stats panel (Success, Profit/Loss, PP1/PP2) Alerts via popup, sound, push, or email Cu
このインジケーターを購入された方には、以下の特典を 無料 で提供しています: 各トレードを自動で管理し、ストップロスとテイクプロフィットを設定し、戦略ルールに基づいてポジションを決済する補助ツール 「Bomber Utility」 様々な銘柄に合わせたインジケーターの設定ファイル(セットファイル) 「最小リスク」、「バランスリスク」、「待機戦略」 の3つのモードで使用できる Bomber Utility 用の設定ファイル このトレーディング戦略をすぐに導入・設定・開始できる ステップバイステップのビデオマニュアル ご注意: 上記の特典を受け取るには、MQL5のプライベートメッセージシステムを通じて販売者にご連絡ください。 オリジナルのカスタムインジケーター 「Divergence Bomber(ダイバージェンス・ボンバー)」 をご紹介します。これは、MACDのダイバージェンス(乖離)戦略に基づいた 「オールインワン」型のトレーディングシステム です。 このテクニカルインジケーターの主な目的は、価格とMACDインジケーターの間に発生するダイバージェンスを検出 し、将来の価格の動きを示す
SignalTech MT5 is a fully rule based trading system for EURUSD, USDCHF, USDJPY, AUDUSD, NZDUSD, EURJPY, AUDJPY, NZDJPY, CADJPY.  All the winning trades with chart setups are published on the comments page. 2025-12 1174 Pips 2026-01 2624 Pips 2026-02 2937 Pips 2026-03 2165 Pips 2026-04 2243 Pips It can generate signals with Buy/Sell Arrows and Pop-Up/Sound Alerts. Each signal has clear Entry and Stop Loss levels, which should be automatically flagged on the chart, as well as potential Targets 1,
ご紹介     Quantum Breakout PRO は 、ブレイクアウト ゾーンの取引方法を変革する画期的な MQL5 インジケーターです。 13年以上の取引経験を持つ経験豊富なトレーダーのチームによって開発されました。     クォンタム ブレイクアウト プロ   は、革新的でダイナミックなブレイクアウト ゾーン戦略により、あなたのトレーディングの旅を新たな高みに押し上げるように設計されています。 クォンタム ブレイクアウト インジケーターは、5 つの利益ターゲット ゾーンを備えたブレイクアウト ゾーン上のシグナル矢印と、ブレイクアウト ボックスに基づいたストップロスの提案を提供します。 初心者トレーダーにもプロのトレーダーにも適しています。 量子EAチャネル:       ここをクリック 重要!購入後、インストールマニュアルを受け取るためにプライベートメッセージを送ってください。 推奨事項: 時間枠: M15 通貨ペア: GBPJPY、EURJPY、USDJPY、NZDUSD、XAUUSD アカウントの種類: ECN、Raw、またはスプレッドが非常に低い R
Azimuth Pro
Ottaviano De Cicco
5 (7)
Azimuth Pro V2:MT5向けシンセティック・フラクタル構造分析と確認済みエントリー 概要 Azimuth Pro は Merkava Labs によるマルチレベルスイング構造インジケーターです。4つのネストされたスイングレイヤー、スイングアンカーVWAP、ABCパターン検出、3タイムフレーム構造フィルタリング、そして確定バーでの確認済みエントリー — 1つのチャートで、ミクロスイングからマクロサイクルまでを網羅するワークフロー。 これはブラインドシグナル製品ではありません。ロケーション、コンテキスト、タイミングを重視するトレーダーのための構造ファーストワークフローです。 V2発売記念オファー — Azimuth Pro V2をUSD 399で(次の100本)。最終価格:USD 499。 1. V2での変更点 シンセティック・マルチタイムフレームエンジン 上位タイムフレーム分析をMeridian Proと同じ独自のシンセティックアーキテクチャで一から再構築。よりクリーンなHTFコンテキスト、安定したライブ動作、従来のMTF同期問題なし。シンセティックエンジンは 固定比率タ
まず第一に、この取引ツールはノンリペイント、ノンリドロー、ノンラグの指標であり、プロの取引に理想的ですことを強調する価値があります。 オンラインコース、ユーザーマニュアル、デモ。 スマートプライスアクションコンセプトインジケーターは、新米から経験豊富なトレーダーまで、非常 に強力なツールです。Inner Circle Trader AnalysisやSmart Money Concepts Trading Strategiesなど、20以上の有用な指標を1つに組み合わせています。このインジケーターはスマートマネーコンセプトに焦点を当て、大手機関の取引方法を提供し、彼らの動きを予測するのに役立ちます。 特に、流動性分析に優れており、機関がどのように取引しているかを理解しやすくしています。市場のトレンドを予測し、価格の動きを慎重に分析するのに優れています。機関の戦略とトレードを合わせることで、市場の動向についてより正確な予測ができます。このインジケーターは多目的であり、市場構造を分析し、重要な注文ブロックを特定し、さまざまなパターンを認識するのに優れています。 このインジケーター
RelicusRoad Pro: 定量的市場オペレーティングシステム 【期間限定】無制限アクセス 70% OFF - 2,000人超のトレーダーと共に なぜ多くのトレーダーは「完璧な」インジケーターを使っても失敗するのでしょうか? それは、文脈を無視して 単一の概念 だけでトレードしているからです。文脈のないシグナルは単なるギャンブルです。勝ち続けるには、 根拠の重なり(コンフルエンス) が必要です。 RelicusRoad Proは単なる矢印インジケーターではありません。完全な 定量的市場エコシステム です。独自のボラティリティモデリングを用いて、価格が推移する「適正価値の道(Fair Value Road)」をマッピングし、ノイズと真の構造的ブレイクを判別します。 推測はやめましょう。機関投資家レベルの「ロード・ロジック」でトレードを。 コアエンジン:「Road」アルゴリズム システムの中心となる Road Algo は、市場環境にリアルタイムで適応するダイナミックなボラティリティチャネルです。 安全ライン(平衡点) と、価格が数学的に反転しやすい 拡張レベル を投影します。 Si
Meridian Pro
Ottaviano De Cicco
5 (2)
Meridian Pro 2.00:MT5向けプロ仕様マルチタイムフレーム・トレンドマトリクス Meridian Pro 2.00 は、MetaTrader 5 向けのプロ仕様の適応型トレンドマトリクスです。オリジナルの Meridian トレンドエンジン、クリーンなチャート ribbon、確定足ベースのシグナル矢印、8時間足 dashboard、Fuel momentum、weighted consensus、synthetic HTF processing、そしてチャート上に直接表示される上位足コンテキストラインを統合します。 目的はシンプルです。現在のトレンド、マルチタイムフレーム構造、強度、momentum、EA-ready 状態を、複数チャートに無関係なインジケータを重ねるのではなく、1つの整理された workflow で読むことです。 Meridian Pro の違い 1つの適応型エンジン - 同じ volatility-aware Meridian ロジックを M1 から W1 まで適用します。 Synthetic HTF architecture - 上位足行は下位足デ
Quantum TrendPulse を ご紹介します。これは、   SuperTrend   、   RSI   、および Stochastic のパワーを 1 つの包括的なインジケーターに組み合わせて、取引の可能性を最大限に引き出す究極の取引ツールです。精度と効率を求めるトレーダー向けに設計されたこのインジケーターは、市場のトレンド、勢いの変化、最適なエントリー ポイントとエグジット ポイントを自信を持って特定するのに役立ちます。 主な特徴: SuperTrend 統合: 現在の市場動向に簡単に追従し、収益性の波に乗ることができます。 RSI精度: 買われすぎと売られすぎのレベルを検出し、市場の反転のタイミングに最適で、SuperTrendのフィルターとして使用されます。 確率的精度: 確率的振動を活用して、変動の激しい市場で隠れたチャンスを見つけます。SuperTrend のフィルターとして使用されます。 マルチタイムフレーム分析:   M5 から H1 または H4 まで、さまざまなタイムフレームで市場を常に把握します。 カスタマイズ可能なアラート: カスタム取引条件が満たされ
多くの矢印インジケーターは、シグナルだけを表示して、その後の判断をすべてトレーダーに任せてしまいます。KT Alpha Hunter Arrows は、完整なトレードプランをチャート上に提示します。 各シグナル矢印が表示されるたびに、エントリーライン、ストップロス、4つのテイクプロフィット水準、そして現在の銘柄と時間足が今トレードに値するかどうかを示すリアルタイムのエッジ判定が、すでに描画された状態で表示されます。付属の Trade Manager EA は、あなたが手動でエントリーした後の実行管理を担当し、相場が荒れて判断がぶれやすい場面でも規律あるトレードを保ちやすくします。リペイントなし。確定足シグナルのみ。Forex、ゴールド、指数、その他あなたが取引するあらゆる銘柄に対応します。 主な機能 リペイントしない買い矢印と売り矢印を、足の確定後にのみ表示。 各シグナルに、エントリーライン、構造的ストップロス、4つのテイクプロフィット水準を表示。 Edge Dashboard が、現在のチャートで買いセットアップと売りセットアップを別々に評価。 判定システム:No Edge、Mar
BTMM State Engine Pro is a MetaTrader 5 indicator for traders who use the Beat The Market Maker approach: Asian session context, kill zone timing, level progression, peak formation detection, and a multi-pair scanner from a single chart. It combines cycle state logic with a built-in scanner dashboard so you do not need the same tool on many charts at once. What it does Draws the Asian session range; session times can follow broker server offset or be set in inputs. Tracks level progression (L
優れたテクニカルインジケーター「Grabber」をご紹介します。これは、すぐに使える「オールインワン」トレーディング戦略として機能します。 ひとつのコードに、市場のテクニカル分析ツール、取引シグナル(矢印)、アラート機能、プッシュ通知が強力に統合されています。 このインジケーターを購入された方には、以下の特典を無料で提供します: Grabberユーティリティ:オープンポジションを自動で管理するツール ステップバイステップのビデオマニュアル:インジケーターのインストール、設定、取引方法を解説 カスタムセットファイル:インジケーターをすばやく自動設定し、最大限の成果を出すための設定ファイル 他の戦略はもう忘れてください!Grabberだけが、あなたを新たなトレードの高みへと導いてくれるのです。 Grabber戦略の主な特徴: 推奨タイムフレーム:M5〜H4 対応通貨ペア・資産:どれでも使用可能ですが、私が実際に検証した以下を推奨します(GBPUSD、GBPCAD、GBPCHF、AUDCAD、AUDUSD、AUDSGD、AUDCHF、NZDUSD、NZDCAD、EURCAD、EURUSD、E
これはMT5のインジケーターで、再描画なしで取引に参入するための正確なシグナルを提供します。 外国為替、暗号通貨、金属、株式、インデックスなど、あらゆる金融資産に適用できます。かなり正確な見積もりを提供し、取引を開始して終了するのに最適な時期を教えてくれます。1つのシグナルを処理しただけでインジケーターの元が取れた例の 動画 (6:22)をご覧ください。Entry PointsPro インジケーターの助けを借りたほとんどのトレーダーの最初の1週間の結果が改善しています。 Telegramグループ に登録してください。Entry Points Proインジケーターのメリットは次の通りです。 再描画のないエントリーシグナル 再描画されるインジケーターでは一度表示されたシグナルが削除されて大きな金銭的損失につながることがありますが、これと異なり、表示されて確認されたシグナルは消えることがありません。 エラーなしの取引開始 インジケーターアルゴリズムによって取引を開始する(資産を売買する)理想的な瞬間を見つけることができます。それを使用するすべてのトレーダーの成功率が向上します。 あら
Trend Forecaster – Since 2023. The Trend Forecaster indicator utilizes a unique proprietary algorithm to determine entry points for a breakout trading strategy. The indicator identifies price clusters, analyzes price movement near levels, and provides a signal when the price breaks through a level. The Trend Forecaster indicator is suitable for all financial assets, including currencies (Forex), metals, stocks, indices, and cryptocurrencies. You can also adjust the indicator to work on any time
トレンドラインプロ   市場の真の方向転換点を理解するのに役立ちます。この指標は、真のトレンド反転と主要プレーヤーが再び参入するポイントを示します。 分かりますか     BOSライン   複雑な設定や不要なノイズなしに、より長い時間足でのトレンドの変化と重要なレベルを把握できます。シグナルは再描画されず、バーが閉じた後もチャート上に残ります。 MT4バージョン   -   RFI LEVELS PRO インジケーター と組み合わせることで、その最大限の能力を発揮します インジケーターが示す内容: 本当の変化   トレンド(BOSライン) 一度シグナルが現れたら、それは有効です!これは、リペイント機能を持つインジケーターとの重要な違いです。リペイント機能を持つインジケーターは、シグナルを発した後、それを変更し、資金の損失につながる可能性があります。これにより、より高い確率と精度で市場に参入できます。また、矢印が現れた後、目標値(利益確定)に達するか、反転シグナルが現れるまで、ローソク足の色を変更する機能もあります。 繰り返しエントリ   主要プレーヤーの補充 エントリーポイントを探す
このインジケーターは、反転ポイントと価格戻りゾーンを正確に表示します。     主要プレーヤー 。新たなトレンドが形成される場所を把握し、最大限の精度で意思決定を行い、すべての取引をコントロールします。 TREND LINES PRO インジケーターと組み合わせることで、その潜在能力を最大限に発揮します。 VERSION MT4 インジケーターが示す内容: 新しいトレンドの始まりに活性化する反転構造と反転レベル。 リスクと報酬の比率を最小限に抑えた利益 確定 と 損失停止の レベルの表示     RR 1:2   。 インテリジェントな削減ロジックによるストップロス。 指定されたインジケーターから 2 つのトレンド タイプの反転パターンを表示します。 指標: トレンドを追う   TREND LINES PRO   (世界的なトレンドの変化) TREND PRO   (クイックトレンド変更) シンプルで効果的   スキャナー   リアルタイムトレンド(新機能)。 マルチタイムフレームのインストゥルメント フィルタリング。 画面   利益     LOGIC AI信号の後。 当日プラス方
OmniSync Projection
Antonio-alin Teculescu
5 (1)
Chronos Fractal Engine is an innovative price projection indicator for MetaTrader 5, designed to transform your technical analysis by intelligently identifying and projecting historical price patterns. Built upon an advanced correlation algorithm and the fractal principles of the market, this powerful tool visualizes potential future price movements, giving you a unique edge in your trading decisions. What is Chronos Fractal Engine? At its core, the Chronos Fractal Engine employs a sophisticat
The Zone Trading Indicator is a technical analysis tool for MetaTrader 5 that automatically identifies and displays tradable price zones across multiple timeframes to assist with structured market analysis. The indicator plots Monthly, Weekly, Daily, and H4 tradable zones , allowing traders to view higher- and lower-timeframe price areas simultaneously. These zones are designed to support one-candle–based entry approaches by highlighting predefined areas where price interaction may be monitored.
このインディケータは、価格アクション分析とドンチャンチャネルのみを使用して、ジグザグ方式で価格の反転を検出します。再描画やバックペインティングを一切行わずに、短期取引向けに特別に設計されています。それは彼らの操作のタイミングを増やすことを目指している賢明なトレーダーにとって素晴らしいツールです。 [ インストールガイド | 更新ガイド | トラブルシューティング | よくある質問 | すべての製品 ] 驚くほど簡単に取引できます すべての時間枠で価値を提供します 自己分析統計を実装します 電子メール/音声/視覚アラートを実装します 可変長のブレイクアウトと混雑ゾーンに基づいて、インディケータは価格アクションのみを使用して取引を選択し、市場が非常に高速に行っていることに反応します。 過去のシグナルの潜在的な利益が表示されます この指標は、独自の品質とパフォーマンスを分析します 負けブレイクアウトは強調表示され、説明されます インジケータは、非バックペインティングおよび非再ペイントです この指標は、日中のトレーダーが単一の価格反転を見逃さないようにするのに役立ちます。ただし、すべての
初心者やエキスパートトレーダーに最適なソリューション! このインジケーターは、独自の機能と新しい計算式を取り入れた、ユニークで高品質、かつ手頃な価格のトレーディングツールです。たった1枚のチャートで28の為替ペアの通貨強度を読み取ることができます。新しいトレンドやスキャルピングチャンスの引き金となるポイントを正確に特定することができるので、あなたのトレードがどのように改善されるか想像してみてください。 ユーザーマニュアルはこちら  https://www.mql5.com/en/blogs/post/697384 これが最初の1本、オリジナルだ! 価値のないクローンを買わないでください。 特別な サブウィンドウの矢印で強い通貨の勢いを表示 GAPがあなたのトレードを導く! 基準通貨や気配値が売られすぎ・買われすぎのゾーン(外相フィボナッチレベル)にあるとき、個別チャートのメインウィンドウに警告表示。 通貨がレンジの外側から反落した場合、プルバック/リバーサルのアラート。 クロスパターンの特別なアラート 複数の時間枠を選択可能で、トレンドを素早く確認できます。通貨強度のライン
Smart Structure Concepts MT5
Cristhian Alexander Gaibor Cuasquer
Smart Structure Concepts MT5 は MetaTrader 5 で最も完全な機関投資家向け SMC ツールキットです — 4言語の教育的ツールチップと、価格がゾーンに入った瞬間のライブプッシュアラートを備えています。 ほとんどの SMC インジケーターはボックスを描くだけで、あなたに推測を強いります。このインジケーターはチャート上で各シグナルを直接説明します。任意の BOS、CHoCH、Order Block、FVG、流動性レベルにマウスを合わせれば、その意味と次に何をすべきかが即座にわかります — 英語、スペイン語、ポルトガル語、フランス語で。 含まれる機能 — Internal & Swing BOS / CHoCH をリアルタイムで検出(リペイントなし) — Internal & Swing Order Blocks と自動ミティゲーション — 上昇・下降 Fair Value Gaps — Equal Highs & Lows(EQH / EQL)流動性マッピング — Premium / Discount / Equilibrium ゾーン —
MetaTrader 5 向けスマート多層ブレイクアウト&プルバック検出器 「スマート・シンプル・ファスト!」 高確率のブレイクアウトエントリーを見逃すことにうんざりしていませんか? 複数のチャートを何時間もスキャンし、ブレイクアウトをトレンド方向と通貨のモメンタムに合わせようとして、それでも動きを逃してしまうことはありませんか? Break Pullback は、1つのインジケーターでそのすべてを解決します。 Break Pullback とは何ですか? Break Pullback は、マーケットストラクチャー、ブレイクアウト、トレンド継続のセットアップを取引するトレーダー向けに特別に設計されたプロフェッショナルグレードの MetaTrader 5 インジケーターです。 リアルタイムで複数の通貨ペアにわたるブレイクとプルバックの形成を自動的に検出し、3層の確認を通じてすべてのシグナルをフィルタリングします: ストラクチャラルブレイクアウト検出 — チャート上の主要なブレイクレベルを特定 HTF 日足バイアス — エントリーを支配的な日足トレンド方向に合わせる 通貨強弱指数 —
ARICoin is a powerful trading companion designed to generate high-probability entry signals with dynamic TP/SL/DP levels based on volatility. Built-in performance tracking shows win/loss stats, PP1/PP2 hits, and success rates all updated live. Key Features: Buy/Sell signals with adaptive volatility bands Real-time TP/SL/DP levels based on ATR Built-in MA Filter with optional ATR/StdDev volatility Performance stats panel (Success, Profit/Loss, PP1/PP2) Alerts via popup, sound, push, or email Cust
Introducing Indicator for PainX and GainX Indices Traders on Weltrade Get ready to experience the power of trading with our indicator, specifically designed for Weltrade   broker's PainX and GainX Indices.  Advanced Strategies for Unbeatable Insights Our indicator employs sophisticated strategies to analyze market trends, pinpointing optimal entry and exit points.  Optimized for Maximum Performance To ensure optimal results, our indicator is carefully calibrated for 5-minute timeframe charts on
CRT Multi-Timeframe Market Structure & Liquidity Sweep Indicator Non-Repainting | Multi-Asset | MT4 Version Available Important Notice: Due to a  temporary support accommodation case, the MT4 version is currently available at a special reduced price at $30  for the next 24-hours, actual price $126. If you already tested the demo and were waiting for access, this is the best time to secure the full version before pricing returns to normal. MT4 Version: https://www.mql5.com/en/market/product/1625
Meta Cipher A
SILICON HALLWAY PTY LTD
5 (1)
Meta Cipher A:価格アクションのための高精度オーバーレイインジケーター Meta Cipher A は、人気のある Market Cipher A のコンセプトを MetaTrader 5 に導入した高精度のオーバーレイ型インジケーターです。価格チャート上に先行シグナルを直接表示するよう設計されており、 8本のEMAリボン 、WaveTrend分析、そして8種類の異なるシグナルを組み合わせることで、エントリーやエグジット、リスクの高い環境を事前に把握できます。 Meta Cipher A は単体でも強力なツールですが、 Meta Cipher B と組み合わせることで、より深い分析と確認が可能になります。 機能概要 動的なEMAをトレンドベースのカラーで描画し、視覚的な分かりやすさのために塗りつぶしエリアを採用したオーバーレイシステムです。さらに、 Blood Diamond (反転シグナル)、 Yellow Cross (操作警告)、 Blue Triangle (継続パターン)など8種類の特殊シグナルを備えています。 WaveTrendオシレーターはバックグラウンドで
Master Editionは、ボリュームとマネーフローの視点を通じて市場構造を可視化するために設計されたプロフェッショナルグレードの分析ツールです。標準のボリュームインジケーターとは異なり、このツールはチャート上に日足ボリュームプロファイルを直接表示し、価格発見がどこで行われたか、そして「スマートマネー」がどこに位置しているかを正確に確認できます。 このMaster Editionは、明確さとスピードを考慮して設計されており、ロード時にチャートレイアウトを即座に美化するユニークな自動テーマ同期システムを備えています。 主な機能: 真のマネーフロー計算: 標準のティックボリュームを超えます。「Use Money Flow」を有効にすると、ボリュームは価格によって重み付けされ、特定の価格レベルでの実際の資本コミットメントが明らかになります。 バリューエリア (VA) の可視化: バリューエリア(デフォルトではボリュームの70%)を自動的に計算します。 VA Fill: コントロールゾーンを即座に識別するために、バリューエリアの背景をシェーディングします。 主要レベル: コントロールポイン
メタトレンドプロ   これは、トレードにおける推測を排除し、市場が既に決定を下したポイントを示すトレンドフォローツールです。この指標は、トレンド、動向、構造が変化する重要なポイントを特定し、主要プレーヤーがポジションを取るべき価格の戻り領域を強調表示します。 単に値動きを見るだけでなく、その背後にある論理を理解できます。すべてのシグナルはローソク足が確定した後に記録され、再描画されることなくチャートに保存されるため、自信を持って状況を分析し、意思決定を行うことができます。トレード目標(利益確定)も表示されます。 この指標の有効性について完全に確信を持っていただくために、自動統計機能をご利用いただけます。 方向転換のたびに、インジケーターはストップロスレベルとそのインテリジェントな段階的移動(Move SL)も表示します。これは非常に重要です。     削減   リスク   ポジション別。 損切り/利益確定/リスクリワード 右側の内蔵パネルには、現在の世界的なトレンドの方向における市場参入ポイントが表示され、過去のデータからもこれらのシグナルが確認できます。 任意の時間枠/ツール この指
==================================================================== SMC Pro v6.1 APEX AI — XAUUSD Gold Empire MetaTrader 5 Indicator · Smart Money Concepts · Predictive Intelligence Engine ==================================================================== SMC Pro v6.1 APEX AI is a professional Smart Money Concepts indicator system built exclusively for XAUUSD (Gold) on MetaTrader 5. It combines the complete SMC framework — Order Blocks, Liquidity sweeps, Fair Value Gaps, Break of Structure,
ご購入後、ご連絡いただければ、本インジケーターをベースにしたEA(自動売買システム)を無料ボーナスとしてご提供いたします。 ChandraSAR Optimizer:自己適応型・定量的トレンドエンジン ほとんどのトレンドインジケーターが機能しなくなる理由は単純です。それは「市場は変化するのに、静的なパラメーターは変化しないから」です。 ChandraSAR Optimizer は、単なるシグナル生成と高度なアルゴリズムテストの壁を取り払います。本製品は、配列ベースの高効率なウォークフォワード(Walk-Forward)最適化エンジンをチャートに直接組み込むことで、ボラティリティ変動の問題を解決するMetaTrader 5用のダイナミックなトレンドフォローシステムです。 シャンデリア・エグジット(Chandelier Exit)の精度と、パラボリックSAR(Parabolic SAR)のモメンタム追従性を融合させたChandraSARは、単にシグナルを生成するだけではありません。現在の相場環境に合わせて、自らのパラメーターを継続的にテスト、スコアリングし、適応させます。手動での調整は一
作者のその他のプロダクト
The indicator calculates the saturation levels of the price chart. A signal to exit the resale area is a buy signal. A signal to exit the overbought area is a sell signal. Usually, you need to set relative values ​​for the overbought and oversold levels of Bottom and Top - for this indicator. Most often, a good trend is visible on the price chart visually. But an experienced trader must clearly understand the current balance of power in the market before entering. And the indicator will help t
This indicator can track the steady price movement in a certain direction. In this case, the movement itself can be downward, upward or lateral, when the market movement does not have a pronounced focus. The indicator works on the basis of two moving average as well as an oscillator. Using the signal search algorithm, the indicator generates signals in the form of arrows. Benefits. Allows you to determine the current trend. You can quickly enough understand which particular trend is currently
Dolphin Bands indicator works equally well on any timeframes. For medium-duration trends, it is recommended to use the standard setting. To study long-term trends, it is recommended to use an indicator value greater than the standard. To analyze short-term trends, it is better to use a lower indicator value. Most often, an exponential method is used to calculate the indicator, but other varieties can also be used. Dolphin Bands is a collection of lines. The two center lines of the indicator ar
Martingals indicator works on all currency pairs and on all timeframes. The arrows indicate the optimal entry points for future Martingale averaging, even with a zero exponent. The indicator shows a signal to close the series only if all previous signals can be closed in profit. After closing a series in profit, you need to immediately open an order in the direction of the signal. Thus, the close signal is at the same time the reverse opening point to the other side of the new order. The probabi
Levels Market is one of the simplest, but no less effective tools from this. Pivot points can be built from these levels, levels are constructed as statistical significance at a given point in time. Trading by levels is a classic in the work of a trader. You can use them as a ready-made trading strategy or as an additional filter in your trading system. In the settings you can specify the offset for building levels. Interpretation of levels: Lines 8/8 and 0/8 (Final Resistance). These lines ar
Trend New Trend Indicator, shows the signals for entry. Displays both entry points and the trend itself. Shows statistically calculated moments for entering the market with arrows. When using the indicator, it is possible to optimally distribute the risk factor. Settings: Uses all one parameter for settings. Selecting a parameter, it is necessary to visually resemble it so that the appropriate graph has a projection of extremes. Options: Length - the number of bars for calculating the indica
Condors TMA  ( Triangular Moving Average ) is a channel indicator without redrawing, built on the basis of moving averages. The key difference between the Condor TMA indicator and other channel indicators (for example, from the same Bollinger indicator) is that Condor TMA takes into account not simple moving averages, but twice smoothed ones, which allows one to more clearly determine the market movement, and on the other hand makes the indicator less sensitive.
Cancer indicator is great for trend trading! An intelligent indicator algorithm with high probability shows the points of potential market reversal. If you are trading in a trend, then a trading strategy built on the basis of this indicator is perfect for you. The indicator filters out market noise, almost everything and all the necessary functions for working with a thread are built into one tool. It works on all currency pairs and on all timeframes, indicator setting - according to your desire
A very simple and convenient trend indicator based on price divergence. He showed himself well in scalping. Help in finding entry points for analysis. It can be used as a filter in trade. It has two parameters: Period and Level. The Level parameter helps to filter out excess signals. For example, for EURUSD, the Level parameter may be 0.0001. The indicator can work both for entry points and as a filter. The indicator reflects information in a visual form. We must not forget that the approach to
Calculated trend indicator, can be used with an optimal risk to profit ratio, shows successful signals. Uses two options for settings. Shows favorable moments for entering the market with arrows. The probability of a successful trend is not very bad! The indicator can be used both for pipsing on small periods, and for long-term trading. The indicator does not redraw and does not lag. It works on all currency pairs and on all timeframes.
XStrain
Vitalii Zakharuk
The XStrain expert system works on all types of accounts. It works both in 4 and 5-digit quotes. Spread and requotes are not critical, any broker is suitable. To optimize the expert system, one year is recommended for the period H1 or H4. Optimization can be carried out at opening prices, the results differ little from testing on real ticks, since the bot works at opening prices. It is enough to optimize once a month! To get better results, it is recommended to work on several different pairs.
An expert of a new type Formulas has been created - it works using sharp tick movements. The uniqueness of the expert is that it can be launched on any hour period, any currency pair, and on the server of any broker. What makes the expert attractive enough to use for trading. It is recommended to work on liquid forex pairs with a low spread. The lower the commission and spread, the greater the profit. You can start using it with $ 100 and a lot of 0.01. A small initial deposit also contributes
The Trend Distinctive indicator smoothes price fluctuations during signal formation by averaging the data. This gives the trader the opportunity to visually determine what trend will be present at a particular time interval. This is an auxiliary tool for technical analysis, which helps to determine the exact direction of the trend: either an upward or downward movement of the price of a trading instrument. Although the indicator is a little late, it still generates the most reliable signals th
Red Bot
Vitalii Zakharuk
The mechanism of work of the Red Bot Expert Advisor is designed so that before opening a transaction, they undergo instant implicit filtering, which, if there are competent and practical settings, allows the buyer to level the number of unprofitable and unproductive transactions. The adviser has a large number of internal regulators, software installations and special codes that help to safely and efficiently trade. This is a fully automated Expert Advisor, built on the scalping strategy, work
Introduced expert system   Stable Ex works with the EURUSD currency pair and only with it. This system implemented the principle of five orders - that is, a maximum of five orders can be placed in one direction, after which the total position of the series must be closed by stops, either real or virtual. The trading system is designed to work separately with a series of buy orders and separately with a series of sell orders. which makes the trading system versatile enough. The expert passes all
The presented expert system works with the GBPUSD currency pair and only with it. This system implemented the principle of seven orders - that is, a maximum of seven orders can be made in one direction, after which the total position of the series should be closed by stops, either real or virtual. The trading system is designed to work separately with a series of buy orders and separately with a series of sell orders. which makes the trading system versatile enough. The expert passes all types
Transition indicator can track a steady price movement in a certain direction. In this case, the movement itself can be downward, upward or sideways, when the market movement does not have a pronounced focus. The indicator works on the basis of two moving average as well as an oscillator. Using the signal search algorithm, the indicator generates signals in the form of arrows. Trading based on trend indicators is the simplest and often the most effective. If you correctly determine the beginni
Global Trend Indicator, shows the signals for entry. Displays both entry points and the trend itself. Shows statistically calculated moments for entering the market with arrows. When using the indicator, the risk factor can be optimally distributed. Settings: Uses all one parameter for settings. Choosing a parameter, it is necessary to visually resemble it so that the appropriate graph has a projection of extremes. Parameters: Length - the number of bars for calculating the indicator. Use
Trend DI is an auxiliary tool for technical analysis that helps determine the exact direction of a trend: either an upward or downward movement of the price of a trading instrument. Although the Trend DI indicator is a bit late, it still generates the most reliable signals that a trader can safely navigate. The Trend DI indicator smooths price fluctuations during signal formation by averaging data. This gives the trader the opportunity to visually determine which trend will be present in a par
The Trend ZVD Trend Indicator is important for identifying trends in financial markets. However, this indicator works equally well during consolidation periods. The Trend ZVD trend indicator indicates the direction in which the asset of your choice can move. The Trend ZVD trend indicator copes with the main task of trading: to find the entry point to the market at the time the trend is created and the exit point at the time it is completed. A trend in trade is the steady movement of quotes in
An indicator from the zigzag family with levels. First of all, I will point out arguments in favor of the advisability of using a level indicator. They give the trader the following benefits: Alternative points of view - the level indicator helps to look at the levels from the side, compare them with several automatic systems, identify errors; Saving time - reducing the cost of effort for self-building lines; Exact mathematical calculation - quick calculation of levels, ratios of indicators
The Progress Scalp strategy is based on tick trading principles. At its core, this strategy is fenders, that is, the trader receives signals for opening positions during pullbacks from the main movement. A distinctive feature of this strategy is that transactions are concluded only during periods of strong tick movements in the forex market. The Progress Scalp strategy was developed for trading with different currency pairs. You need to choose a currency pair with the lowest spreads and virtual
Long
Vitalii Zakharuk
The Long expert system works with the EURUSD currency pair and only with it. The trading system is designed to work separately with a series of buy orders and separately with a series of sell orders. which makes the trading system versatile enough. The expert passes all types of testing throughout the history for the specified currency pair. Also, the expert system is tested with various delay values, it works in fully automatic mode! No settings are needed, use only the default settings. Thi
The indicator is simple and clear, making the work of the trader as easy as possible and giving clear signals to enter the market. This indicator has two settings for the period. Which makes it more flexible. And at the same time, many false signals do not appear. The larger the period, the smoother the indicator itself will be. It can be used both independently and together with other indicators of technical analysis (including with oscillators), as well as with another same indicator (with
Индикатор отображает регнессионный канал с сопровождением каналов фактически создавая уровни поддержки и сопротивления. Уровни поддержки и сопротивления являются одним из важнейших элементов технического анализа. С этим утверждением согласится любой трейдер. Уровни в трейдинге используются непосредственно, открывая и закрывая ордера у границ диапазона, очерченного ими. Также уровни применяют баланс спроса и предложения в своих торговых стратегиях на различных временных интервалах. Визуальное
An expert of a new type Anniversary - works using sharp tick movements, the algorithm that was created earlier is significantly improved. The uniqueness of the expert is that it can be launched on any hour period, any currency pair, and on the server of any broker. What makes the expert attractive enough to use for trading. It is recommended to work on liquid forex pairs with a low spread. The lower the commission and spread, the greater the profit. You can start using it with $ 100 and a lot o
The Trends Signal indicator displays the direction of the trend with arrows, works in a simple and clear way. It uses a combination of reliable and simple indicators to analyze prices. The signals of the Trends Signal indicator can be interpreted as follows: buy when the bars are colored blue, and sell when they are red. An effective indicator with a wide range of three parameters for trading. Parameters: Length - The number of bars to calculate. LevelUP, LevelDN - Levels for determining overb
The Open Trend indicator calculates the saturation levels of the price chart. Most often, a good trend is visible on a price chart visually. But an experienced trader should clearly understand the current balance of power in the market before entering. A signal to exit the oversold area is a buy signal. A signal to exit the overbought area is a sell signal. Usually, you need to set the relative values ​​for the overbought and oversold levels Bottom and Top for this indicator. The Open Trend i
Sharp
Vitalii Zakharuk
Sharp expert system works with a deposit of $ 100! The classic method of scalping. It is also worth noting that with the allowable level of the spread, the bot goes through any historical period on any currency pair. The key for the Sharp bot is the spread, it works with default settings, it is possible to work with a spread of up to 10. If the spread is more than 10, then you need to select other settings. Testing should be performed with a spread of up to 10 on all ticks. There is no point i
Are you tired of the constant ups and downs? It is not worth becoming a victim of unstable market movements, it is time to somehow get rid of it! Already now, you can use Business Trend solutions to balance the analysis of price movements and get a clearer picture of price behavior. Business Trend is a trend indicator for the MetaTrader 4 trading platform. This indicator allows you to find the most likely trend reversal points. You will no longer find a copyright indicator like this. A simple
フィルタ:
レビューなし
レビューに返信