Hidden Takeproffit and Stoploss
- ユーティリティ
-
Jinsong Zhang
 MT5 Articles List - Traders' Blogs: https://www.mql5.com/en/blogs/post/90
 - バージョン: 1.0
- アクティベーション: 5
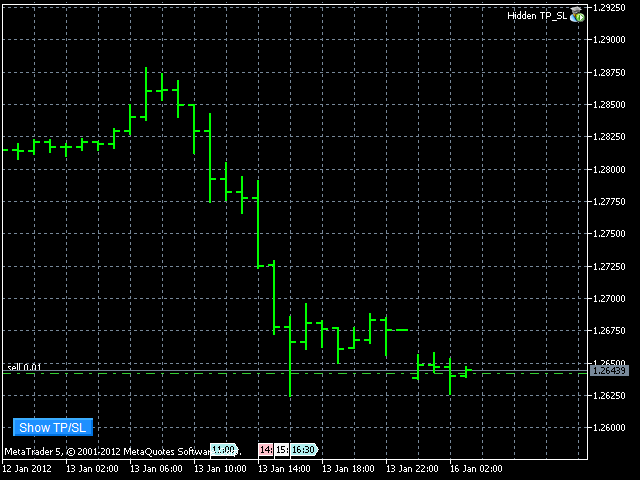
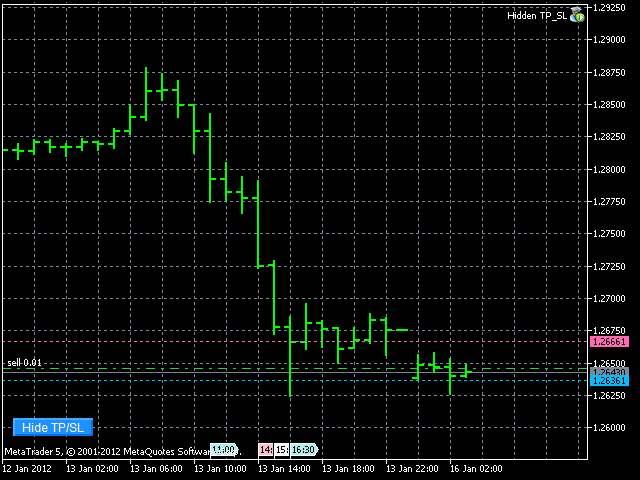
Some traders don't like expose Take Profit/Stop Loss level in their positions, this Expert Advisor can help them.
Put it to chart and set Take Profit/Stop Loss pips (0 means ignore), it watch the price of the symbol on chart and close the position if price reach Hidden TP/SL level.
It hide user's Takeprofit and Stoploss price in effect.
You can drag the horizontal line to set a new Takeprofit and Stoploss price.