Pyramid OM
- ユーティリティ
- バージョン: 1.1
- アクティベーション: 10

Pyramid Order Manager is a utility based on the work of two indicators SM ZigZag and SM trend cloud .
With the help of this utility, the trader has the opportunity to set instant or pending orders on the chart in a short time with his lot, take profit and stop loss, as well as the number of orders in the grid, the coefficients of the lot and step change. The utility has two built-in indicators, listed above, with the ability to disable them.
A distinctive feature of this utility is the possibility of automatic trading, if in the settings UseBuy/UseSell=true, or the buttons are pressed on the panel (green means the Enabled state) Not SELL/Not BUY. And then Pyramid OM will turn into a wonderful Expert Advisor with the possibility of manual trading!
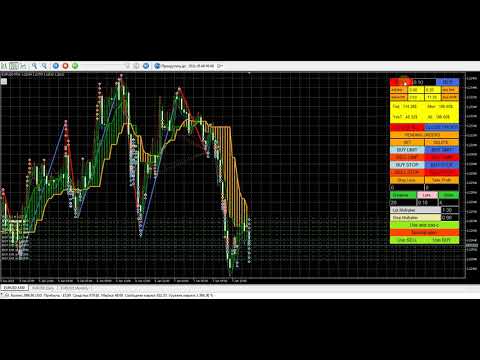
The signal to open BUY or SELL orders is formed based on the data received from the " SM ZigZag "indicator. As soon as the indicator shows the formation of a downtrend (red line), the Expert Advisor places a BUY order with the set lot (the ability to choose in the settings whether it will be fixed or dynamic).
After placing the first BUY order with the initial lot, until the indicator has formed a blue line (an uptrend), the next BUY orders are placed after a certain step, which is changed according to the coefficient and with an increase in the lot, according to the coefficient.
All this continues until the " SM ZigZag " indicator forms a blue line (an uptrend). As soon as the trend change line is formed, the process of placing SELL orders begins, according to the same scheme as the previous one with BUY. The strategy can be changed by changing the trigger in the "ReverceOrders" settings, or on the control panel by clicking the "Reverse open" button. In this case, the orders being opened are reversed, SELL will be opened instead of BUY and vice versa.
The value of the main settings:
Order setting - everything is clear here according to the method of calculating the lot. Use Buy/Use Sell-enable / disable auto trading (these are the buttons of the same name on the panel). Next are the SL and TP settings, the values of which can be selected in points, money or % from the deposit. The values that are not selected must have "0".
Grids setting - grid settings, everything is clear there.
and-zad-c - settings of the SM trend cloud indicator
Zig Zag Color setting- SM ZigZag indicator settings
Technical setting - the settings of the trawl, the reverse of the opened orders, the setting of virtual TP and SL (hidden from the broker), the settings for protecting orders from drawdown are intuitive.
The value of the "Uselossinsurance"settings( protection of open orders from drawdown): LossInsuranceMoney and LossInsurancePercent if both are greater than zero, then the lowest total value is selected (money is calculated from the equity percentage), MinimumLoss is the minimum loss in one direction. LossInsuranceMoney and LossInsurancePercent - if both are equal to zero, then just the profit in one direction should be greater than the loss in the other (meaning open BUY and SELL orders). MinimumLoss - you can also put zero, then the loss should simply be less than zero.
The second indicator, " SM trend cloud ", which is used both for monitoring (you can disable it in the settings) and for auto trading as an auxiliary one, has an equally important task. It forms "clouds" of two colors, green – an uptrend and orange – a downtrend. If a BUY order command is formed on the first indicator, i.e. after the formation of the red line, and the cloud of the second indicator is green, the step and lot increment coefficients work as described above. If the cloud is orange, the lot and the step of subsequent orders in this series are equal to the first value, i.e. they are not multiplied by coefficients, but correspond to the original values with equal intervals and Lots with an unchanged lot. These actions are necessary to reduce the drawdown in the event of a sudden trend reversal. But they can be disabled by using "Use_AndZadC=false" in the settings or by clicking on the "Not use and-zad-c" button on the panel. In this case, the coefficients applied to the lot and step when building the grid will always be applied, regardless of the " SM trend cloud "readings.