Market Sessions Indicator MT5

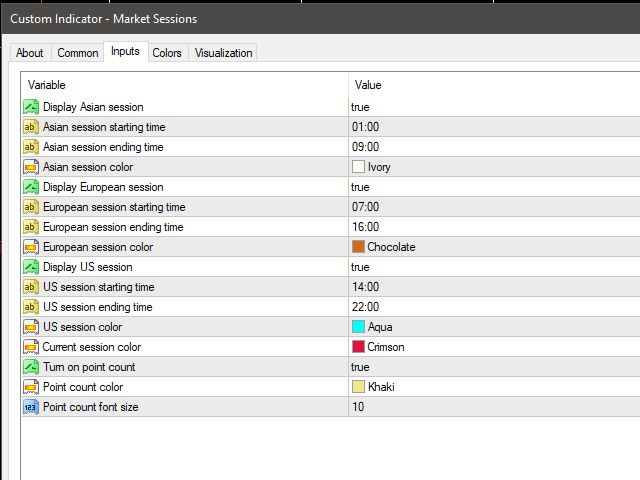
The  Market Sessions Indicator for MT5 helps you  predict market turnarounds by detecting major supply and demand areas.

These pivot points tend to occur after a new session has started and the previous one is still open.

It is also used to gauge how many points or pips the market moves on average during a session.

This helps us to place better our take profits and stop losses.

The indicator works on all forex pairs, gold, silver, commodities, stocks, indices and any other instrument that your broker offers.

Best used on 1 minute to 1 hour time frames.

おすすめのプロダクト
Calendar Dashboard – a compact, real‑time economic calendar that sits directly on your MT5 charts and never gets in the way . Why traders love Calendar Dashboard See upcoming and past news at a glance, with clear time, currency, and impact so you know exactly when markets may move . Instantly spot high‑impact events thanks to color‑coding and a simple legend; past events are marked with a small asterisk for quick reference . Stay aligned across brokers with Broker Time and GMT Time displayed si
FREE
SMC Workflow Auto EA
Choawana Malaikitsanachalee
English – Product Description (V1.42) SMC Workflow Auto EA — SR / OB / FVG with BOS–CHOCH Confirmation Smart-Money-Concepts Expert Advisor that trades only when a clean SMC setup appears: Order-Block retest after Break of Structure (BOS / CHOCH) confirmation, with optional SR and Fair Value Gap (FVG) confluence. The EA uses pending limit orders, fixed SL/TP or RR-based exits, step-lock trailing and strict risk-controls designed to pass broker validation. What it does Detects swing structure usi
FREE
Market Ticker Pro MT5
John Louis Fernando Diamante
The only Market Ticker on the market! Add a professional novelty to your workspace, with built in mini-charts A scrolling Market Ticker that displays price changes from all symbols in the Market Watch list. Provides an easy snapshot of symbol prices, and keeps scrolling automatically while you trade and analyse the chart. The ticker color (+/- price changes) are based on either the current or completed candle, and the previous candle. Options include: - MTF, eg choose to show price changes of t
Previous Candle Levels MT5
Wachinou Lionnel Pyrrhus Sovi Guidi
1 (1)
Previous Candle Levels MT5 shows the previous candle levels, it shows the previous candle Open High Low Close levels (OHLC Levels) in different time frame. It's designed to help the trader to analyse the market and pay attention to the previous candle levels in different time frame.  We all know that the OHLC Levels in Monthly, Weekly and Daily are really strong and must of the time, the price strongly reacts at those levels. In the technical analysis, the user can use them as a support and res
FREE
E2C Lines
Eduardo Cristian De Carvalho
Descubra o poder do nosso indicador de alta precisão, projetado para identificar as regiões de alvo e exaustão de qualquer ativo. Testado e validado por mais de 3 anos nos mercados de mini dólar e mini índice, ele oferece confiabilidade e eficácia incomparáveis. Transforme sua estratégia de trading e alcance novos patamares de sucesso com nossa ferramenta inovadora.
回帰取引を意味する専門的かつ定量的なアプローチを実装する独自の指標。これは、価格が予測可能かつ測定可能な方法で迂回して平均に戻るという事実を利用しており、非定量的な取引戦略を大幅に上回る明確な出入りルールを可能にします。 [ Installation Guide | Update Guide | Troubleshooting | FAQ | All Products ] 明確な取引シグナル 驚くほど簡単に取引できます カスタマイズ可能な色とサイズ パフォーマンス統計を実装します ほとんどの取引戦略を上回ります 適切なSLおよびTPレベルを表示します 電子メール/音声/視覚アラートを実装します 使い方 インディケータは、より高い時間枠からの完全にカスタマイズ可能な移動平均の周りの標準偏差を測定し、トレンドフォローアプローチを使用して正確に取引を見つけます。取引は、現在のチャートの価格アクションに飛び込むことによって見つけられ、価格が選択したより高い時間枠から計算された平均価格帯に戻ったときに閉じられます。それがコード化される方法のために、指標は高ボラティリティと強いトレンドの市場か
The Get Trend indicator was created to neutralize temporary pauses and rollbacks. It analyzes the behavior of the price and, if there is a temporary weakness of the trend, you can notice this from the indicator, as in the case of a pronounced change in the direction of the trend. Currency pairs never rise or fall in a straight line. Their rises and falls are interspersed with pullbacks and turns. Every growth and every fall is reflected in your emotional state: hope is replaced by fear, and wh
The Visual Dragon Cloud Indicator is a powerful and unique tool designed to provide traders with deep insights into market behavior. Priced at $65, it offers a robust framework for understanding price dynamics through its sophisticated strategy, while allowing users to optimize and customize it to fit their unique trading styles. Please note: this indicator is not optimized and is intentionally crafted for you to fine-tune it for your personal trading approach. Strategy and Logic Behind the Ind
MT5 Session Indicator: Track Global Market Hours with Precision Boost your trading strategy with this FREE Session Indicator for MetaTrader 5 , designed to help you effortlessly identify active trading sessions across global markets. Perfect for forex, stocks, and commodities traders, this tool highlights key market hours (Asian, European, North American, and overlaps) directly on your chart, ensuring you never miss high-liquidity periods. Key Features: Visual Session Overlays : Clear color-c
FREE
「上位足のトレンド方向を確認したいけど、いちいちチャートの時間足を切り替えるの、面倒だな~」 そんなあなたのために、この商品が存在します!! Trend Map - 商品概要 各時間足(あるいは各フラクタル構造)において、トレンド方向を記録して常にチャート上に表示しておけるツールです。時間足を変更してもパネルの表示はそのままなので、こまめに時間足を変更しながらチャートを見る方にオススメです。トレードする際に素早くトレンド方向を確認できるので、ノンストレスでトレードを行うことが可能になります。また、各時間足(フラクタル構造)での高安値を認識するためのラインをワンボタンで生成・削除することができます。自動売買の機能はないため、トレード補助のツールとしてお使いください。 - 機能説明 ①パネルユニット パネルUI全体のうち、縦一列分を指します。最大10個まで表示可能です。パネルユニットごとにテーマカラーを設定できます。 ②説明ラベル パネルユニットの一番上のラベルです。時間足の表示など好きなテキストを設定できます。また、設定から表示をOFFにすることもできます。 ③矢印
Sobre la base del concepto físco de  "Cantidad de Movimiento"  construimos este indicador/oscillador, que pretende darnos idea de entradas y salidas en el mercado. En mecánica clásica, la   cantidad de movimiento   se define como el producto de la masa del cuerpo (volumen) y su velocidad (rapidez con la varía el precio) en un instante determinado. p=M*V Se trata de un indicador/oscilador que pretende identificar momentos de entrada y salida basados en la fuerza o presión a ambos lados del preci
DYJ BoS インジケーターは、次のような市場構造の変化の主な要素を自動的に識別してマークします。 構造のブレイクアウト (BoS): 価格が大きく変動し、構造の前のポイントを突破したときに発生します。 彼は上昇トレンドと下降トレンドの可能性のあるライン(UP と DN、つまり連続した新高値と新安値)をマークし、価格がこれらのラインを突破すると、赤(弱気)と緑(強気)の矢印でマークします。 BoS は通常、価格が以前の価格変動によって確立されたスイング安値または高値を決定的に突破したときに発生します。価格がスイング高値を上回ったりスイング安値を下回ったりすると、単に以前に形成された市場構造から抜け出すだけなので、「ブレイクアウト」構造と呼ばれます。これは多くの場合、市場センチメントとトレンドの方向の変化を示し、既存のトレンドの継続または新しいトレンドの始まりを示唆します。 ポジションのクローズの精度を高めるために、通常はストップロスとテイクプロフィットを設定しないことが推奨されます。最終ポジションは通常、同じ方向の次のブレイクスルー ポイント、または反対方向のブレイクスルー
The TMA Centered Bands Indicator for MT5 draws bands on the chart and shows the overall price trend. It displays three bands - the lower and upper boundaries of the channel and the median.   The bands are made up of moving averages, and each of them has an MA period. The name TMA comes from triangular moving averages, as the indicator draws triangular bands.   The price will fluctuate between these ranges whenever the trend changes direction, thus creating entry and exit points.   How to trade
FREE
Divergent Stochastic Filter II Catch Reversals Early, Filter Noise, Trade with Confidence The Edge: Why This Stochastic is Different  Every trader knows the Stochastic oscillator. But knowing when to trust its signals, that's the real challenge. The Divergent Stochastic Filter II transforms this classic indicator into a precision reversal detection system by adding critical elements: divergence intelligence, signal filtering and exhaustion detection.  While standard Stochastic oscillators fire s
GEN TrendPivot Hunter Developer: Gede Egi Overview GEN TrendPivot Hunter is a multifunctional indicator for MetaTrader 5. It combines Pivot-based Support & Resistance, Fair Value Gaps (FVG), and Trendlines into one analytical tool. The indicator helps visualize possible price reaction areas and market structures directly on the chart. All drawing styles, alerts, and notifications can be customized through the input parameters. The tool does not generate trading signals automatically; it is inte
The Swing High Low and Fibonacci Retracement Indicator is a powerful technical analysis tool designed to identify key price levels and potential reversal zones in the market. It automatically detects recent swing highs and swing lows on the chart and overlays Fibonacci retracement levels based on these points. This indicator helps traders: Visualize market structure by highlighting recent swing points. Identify support and resistance zones using Fibonacci ratios (e.g., 38.2%, 50%, 61.8%). Adapt
SMC Venom Model BPR インジケーターは、スマート マネー (SMC) コンセプトで取引するトレーダー向けのプロフェッショナル ツールです。価格チャート上の 2 つの主要なパターンを自動的に識別します。 FVG   (フェアバリューギャップ) は、3 本のローソク足の組み合わせで、最初のローソク足と 3 番目のローソク足の間にギャップがあります。ボリュームサポートのないレベル間のゾーンを形成し、価格修正につながることがよくあります。 BPR   (バランス価格範囲) は、2 つの FVG パターンの組み合わせで、「ブリッジ」を形成します。これは、価格がボリュームアクティビティの少ない動きで動くときに、ブレイクアウトしてレベルに戻るゾーンで、ローソク足の間にギャップを作成します。 これらのパターンは、大規模な市場プレーヤーと一般参加者の相互作用が発生するチャート上のボリュームと価格動向の分析に基づいて、トレーダーが主要なサポート/レジスタンス レベル、ブレイクアウト ゾーン、エントリ ポイントを識別するのに役立ちます。 インジケーターは、長方形と矢印の形でパターンを視覚
Xtrade Trend Detector is an indicator capable of finding the best opportunities to take a position in any stock market. Indeed, it is a great tool for scalpers but also for Daytraders. You could therefore use it to identify areas to trade, it fits easily on a chart. I use it to detect trends on Big timeframes and take positions on Small timeframes. Don't hesitate to give me a feedback if you test it.
Trend Strength Overview is a MetaTrader 5 indicator for analyzing trend strength across multiple symbols and timeframes . The values help you identify the best trend opportunities and indicate reversals It displays a compact panel on the main chart and a strength oscillator in a separate window. The panel allows fast comparison of trend conditions, while the oscillator helps visualize bullish, bearish, and neutral phases on the current chart. Clicking a panel cell switches the chart to the se
Auto Fractal Support And Resistance is a powerful multi-timeframe indicator designed for traders who want to trade lower timeframes with higher timeframe accuracy. When your mouse cursor is on a line you can easily see fractal describtion and index of fractal candle  and timeframe of that fractal candle.  This indicator automatically detects H1 and D1 fractal levels and draws clean horizontal support and resistance lines on any lower timeframe chart (M1, M5, M15, M30). Now you can see where the
A heatmap is a graphical representation of data in two dimensions, using colors to display different factors. Heatmaps are a helpful visual aid for viewers, enabling the quick dissemination of statistical or data-driven information. The MP Heatmap indicator provides a graphical representation of the relative strengths of major currencies compared to others, organizing data from pairs into color-coded results and producing a clear overview of the entire Forex market. The MP Heatmap indicator dis
FREE
Visual Trend Flux Analyzer: Your Ultimate Guide to Market Momentum Unlock a clearer, more intuitive way to view market trends and momentum with the Visual Trend Flux Analyzer. This powerful indicator for MetaTrader 5 is designed to cut through market noise and provide you with a clean, visual representation of trend strength and potential reversals. Stop guessing the market's direction and start making informed decisions based on a sophisticated, multi-layered analysis. For just $30, you can eq
Advanced Trading Chaos  The main purpose of the indicator is to help the trader detect the signals described by Bill Williams in his books to make a quick and correct trading decision. 1)Bullish/Bearish Reversal Bar(BDB) 2) Divergent Bar(DB) 3) Second Sage Signal — the third consecutive Awesome Oscillator bar  4) Working fractals (Fractals that worked above/below the red forehead  5) Three bar coloring modes 5.1) Coloring of bars according to the AO indicator (Including the squatting bar) 5.2
Smart Money Structure & Precision Trading Indicator (MT5) Smart Money Structure & Precision Trading Indicator  is a powerful Smart Money Concepts (SMC) indicator for MetaTrader 5, designed to help traders identify high-probability entries with institutional logic . This indicator automatically detects market structure in real time , highlights key liquidity levels , and provides clear, non-repainting signals so you can trade with confidence and precision. Whether you are a scalper, day trader, o
プレミアムレベルは、正しい予測の精度が80%を超える独自の指標です。 この指標は、最高のトレーディングスペシャリストによって2か月以上テストされています。 あなたが他のどこにも見つけられない作者の指標! スクリーンショットから、このツールの正確さを自分で確認できます。 1は、1キャンドルの有効期限を持つバイナリーオプションの取引に最適です。 2はすべての通貨ペア、株式、商品、暗号通貨で機能します 手順: 赤い矢印が表示されたらすぐにダウントレードを開き、青い矢印が表示されたら閉じます。青い矢印の後に開くこともできます。 試してテストしてください!推奨設定はデフォルトです! 日足チャートで最高の精度を示します! インディケータは、2600 Pipsの収益性に対して、約10Pipsという非常に小さなマージンを使用します。
Environment Pro MT5 What is Environment Pro? Environment Pro is a real-time market scanning dashboard that monitors multiple symbols and timeframes in a single panel. It helps you quickly identify which pairs show clear directional bias, which are stuck in range, and where unusual volatility is appearing. Built as a practical environment-assessment tool for MT5, it can be used with Forex pairs, Gold, indices, and crypto symbols supported by your broker. The Problem It Solves - You enter a trade
ROC acceleration-deceleration is the manual system for medium-term scalping. Indicator based on custom ROC system which defines bullish/bearish market and especially  acceleration-deceleration of tendention in the market's main direction. Buy arrow is plotted during bearish market when current trend decelerates and sell  arrow is plotted during bullish market when current trend decelerates. Main Indicator's Features Signals are not repaint,non-late or disappear(exept cases when system recalculat
Candle Reversal , is designed to identify and highlight key candlestick patterns that signal potential trend reversals or continuations in the market. It focuses on two primary types of patterns: 3-Line Strike Patterns   (Bullish and Bearish) Engulfing Patterns   (Bullish and Bearish) The indicator provides visual cues (arrows and text labels) on the chart to help traders quickly identify these patterns, making it easier to make informed trading decisions.  use with MACD or awesome oscilator to
Quick Draw Panel lets you instantly draw custom present trading objects (zones and trendlines) instantly with one click from the panel fixed neatly in any chart corner. No more searching through toolbars or menus one click, one object, done. Fully customizable colors, line size, and style.  Ideal For: Institutional / Smart Money Concept (SMC) / Supply and Demand traders. Supply and Demand zone marking. Technical Analysis marking. Liquidity and ICT Order Block marking. Clean, minimalist charting
このプロダクトを購入した人は以下も購入しています
SuperScalp Pro
Van Minh Nguyen
4.72 (18)
SuperScalp Pro — 高度なマルチフィルター対応スキャルピングインジケーターシステム SuperScalp Pro は、クラシックな Supertrend と複数のインテリジェントな確認フィルターを組み合わせた高度なスキャルピング用インジケーターシステムです。M1〜H4 のすべての時間足で効率的に機能し、特に XAUUSD、BTCUSD、および主要なFX通貨ペアに適しています。単体のシステムとして、また既存の取引戦略へ柔軟に統合して使用できます。 本インジケーターは 11 以上のフィルターを統合しており、短期・長期の EMA、トレンド判定に用いる 3 本の EMA、EMA スロープ(EMA slope)、RSI、ADX、出来高、VWAP、ボリンジャーバンドのブレイクアウト、MACD ダイバージェンスフィルターなどを含みます。スマートキャンドルフィルターはローソク足の終値を確認して弱いシグナルを排除し、3 本の EMA と MACD ダイバージェンスを組み合わせたトレンド認識メカニズムにより勝率の高いシグナルの選別を支援します。 SuperScalp Pro は ATR に基
Power Candles – あらゆる市場に対応した強度ベースのエントリーシグナル Power Candles は、Stein Investments が長年培ってきた強度分析を価格チャート上に直接反映します。価格だけに反応するのではなく、各ローソク足は実際の市場の強さに基づいて色分けされ、モメンタムの蓄積、強度の加速、明確なトレンド転換を瞬時に把握できます。 すべての市場に共通する単一ロジック Power Candles は すべての取引シンボル で自動的に動作します。現在のシンボルが Forex か非 Forex 市場かを自動判別し、内部で適切な強度モデルを適用します。 Forex および Gold :FX Power のデルタ値を使用(絶対値レンジ最大 100) 指数、暗号資産、CFD :IX Power の強度値を使用(絶対値レンジ最大 50) 必要な強度計算は Power Candles に直接組み込まれています。ローソク足のカラーリングやシグナルロジックに、追加のインジケーターは不要です。 価格ノイズではなく「強度状態」 各ローソク足は、以下の 9 つの明確に定義された強
Entry In The Zone and SMC Multi Timeframe is a real-time 2-in-1 market analysis tool that combines market structure analysis and a No Repaint BUY / SELL signal system into a single indicator, built on Smart Money Concepts (SMC) — a widely adopted framework used by professional traders to understand market structure. This indicator helps you see the market more clearly, make decisions based on structure rather than guesswork, and focus on high-probability zones where price is more likely to react
このインジケーターを購入された方には、以下の特典を 無料 で提供しています: 各トレードを自動で管理し、ストップロスとテイクプロフィットを設定し、戦略ルールに基づいてポジションを決済する補助ツール 「Bomber Utility」 様々な銘柄に合わせたインジケーターの設定ファイル(セットファイル) 「最小リスク」、「バランスリスク」、「待機戦略」 の3つのモードで使用できる Bomber Utility 用の設定ファイル このトレーディング戦略をすぐに導入・設定・開始できる ステップバイステップのビデオマニュアル ご注意: 上記の特典を受け取るには、MQL5のプライベートメッセージシステムを通じて販売者にご連絡ください。 オリジナルのカスタムインジケーター 「Divergence Bomber(ダイバージェンス・ボンバー)」 をご紹介します。これは、MACDのダイバージェンス(乖離)戦略に基づいた 「オールインワン」型のトレーディングシステム です。 このテクニカルインジケーターの主な目的は、価格とMACDインジケーターの間に発生するダイバージェンスを検出 し、将来の価格の動きを示す
Azimuth Pro
Ottaviano De Cicco
5 (6)
Azimuth Pro V2:MT5向けシンセティック・フラクタル構造分析と確認済みエントリー 概要 Azimuth Pro は Merkava Labs によるマルチレベルスイング構造インジケーターです。4つのネストされたスイングレイヤー、スイングアンカーVWAP、ABCパターン検出、3タイムフレーム構造フィルタリング、そして確定バーでの確認済みエントリー — 1つのチャートで、ミクロスイングからマクロサイクルまでを網羅するワークフロー。 これはブラインドシグナル製品ではありません。ロケーション、コンテキスト、タイミングを重視するトレーダーのための構造ファーストワークフローです。 V2発売記念オファー — Azimuth Pro V2をUSD 399で(次の100本)。最終価格:USD 499。 1. V2での変更点 シンセティック・マルチタイムフレームエンジン 上位タイムフレーム分析をMeridian Proと同じ独自のシンセティックアーキテクチャで一から再構築。よりクリーンなHTFコンテキスト、安定したライブ動作、従来のMTF同期問題なし。シンセティックエンジンは 固定比率タ
OmniSync Projection
Antonio-alin Teculescu
5 (1)
Chronos Fractal Engine is an innovative price projection indicator for MetaTrader 5, designed to transform your technical analysis by intelligently identifying and projecting historical price patterns. Built upon an advanced correlation algorithm and the fractal principles of the market, this powerful tool visualizes potential future price movements, giving you a unique edge in your trading decisions. What is Chronos Fractal Engine? At its core, the Chronos Fractal Engine employs a sophisticat
このインジケーターを購入すると、プロ仕様のトレードマネージャーを無料で差し上げます。 まず第一に、このトレーディングシステムがノンリペイント、ノンリドロー、ノンラグのインジケーターであることを強調する価値がある。これにより、手動取引とロボット取引の両方に理想的なものになっています。 オンラインコース、マニュアル、プリセットのダウンロード。 「スマートトレンドトレーディングシステム MT5」は、新規および経験豊富なトレーダー向けにカスタマイズされた包括的なトレーディングソリューションです。10以上のプレミアムインジケーターを組み合わせ、7つ以上の堅実なトレーディング戦略を備えており、多様な市場状況に対応する多目的な選択肢となっています。 トレンドフォロー戦略:トレンドを効果的に乗り越えるための正確なエントリーとストップロス管理を提供します。 リバーサル戦略:潜在的なトレンドの反転を特定し、トレーダーがレンジ相場を活用できるようにします。 スキャルピング戦略:高速で正確なデイトレードおよび短期取引のために設計されています。 安定性:すべてのインジケーターはノンリペイント、ノンリドロー、ノ
トレンド スクリーナー インジケーターでトレンド取引の力を解き放ちます。ファジー ロジックと複数通貨システムを活用した究極のトレンド取引ソリューションです。 ファジー ロジックを活用した革新的なトレンド インジケーターである Trend Screener を使用して、トレンド取引を向上させます。 これは、13 を超えるプレミアム ツールと機能、および 3 つの取引戦略を組み合わせた強力なトレンド追跡インジケーターであり、Metatrader をトレンド アナライザーにする多用途の選択肢となります。 期間限定オファー : トレンド スクリーナー インジケーターは、わずか 100 ドルで生涯ご利用いただけます。 (元の価格 50$ ) (オファー延長) Trend Screener の 100% 非再描画精度の揺るぎない精度を体験して、取引の決定が過去の価格変動の影響を受けないようにしてください。 マルチタイムフレームおよびマルチ通貨機能の多用途性を解放し、比類のない自信を持って外国為替、商品、暗号通貨、インデックスの世界を取引できるようにします。 Trend Screener の包括的な
Meridian Pro
Ottaviano De Cicco
5 (1)
Meridian Pro:MT5用プロフェッショナル・マルチタイムフレーム・トレンドマトリックス 概要 Meridian Pro は Merkava Labs が開発したマルチタイムフレーム・トレンドマトリックスで、方向性の状態、強度、モメンタムの状況、マトリックスの合意をひとつのコンパクトなパネルに集約します。ひとつのアダプティブエンジンがM1からW1まで一貫して適用されます。シンボルごとの調整は不要。インジケーターの積み重ねも不要。すべてのアセットとすべてのタイムフレームをカバーするひとつの構造化された読み取りです。 発売キャンペーン — Meridian Proを USD 99 (導入価格)で入手。通常価格:USD 149 。 1. Meridian Proが他と異なる理由 ひとつのエンジン、バラバラなインジケーターのダッシュボードではない 多くのMTFダッシュボードは、タイムフレームごとに生のインジケーター値を繰り返すだけです。Meridian Proはマトリックス全体でひとつのアダプティブ・トレンドエンジンを使用するため、パネルの各行が同じ構造化フレームワークから導出されます
Quantum TrendPulse を ご紹介します。これは、   SuperTrend   、   RSI   、および Stochastic のパワーを 1 つの包括的なインジケーターに組み合わせて、取引の可能性を最大限に引き出す究極の取引ツールです。精度と効率を求めるトレーダー向けに設計されたこのインジケーターは、市場のトレンド、勢いの変化、最適なエントリー ポイントとエグジット ポイントを自信を持って特定するのに役立ちます。 主な特徴: SuperTrend 統合: 現在の市場動向に簡単に追従し、収益性の波に乗ることができます。 RSI精度: 買われすぎと売られすぎのレベルを検出し、市場の反転のタイミングに最適で、SuperTrendのフィルターとして使用されます。 確率的精度: 確率的振動を活用して、変動の激しい市場で隠れたチャンスを見つけます。SuperTrend のフィルターとして使用されます。 マルチタイムフレーム分析:   M5 から H1 または H4 まで、さまざまなタイムフレームで市場を常に把握します。 カスタマイズ可能なアラート: カスタム取引条件が満たされ
BTMM State Engine Pro is a MetaTrader 5 indicator for traders who use the Beat The Market Maker approach: Asian session context, kill zone timing, level progression, peak formation detection, and a multi-pair scanner from a single chart. It combines cycle state logic with a built-in scanner dashboard so you do not need the same tool on many charts at once. What it does Draws the Asian session range; session times can follow broker server offset or be set in inputs. Tracks level progression (L
FX Trend NG:次世代マルチマーケット・トレンドインテリジェンス 概要 FX Trend NG は、複数の時間足に対応したプロフェッショナル向けトレンド分析およびマーケット監視ツールです。 市場全体の構造を数秒で把握することができます。 複数のチャートを切り替える必要はありません。どの銘柄がトレンド中なのか、どこでモメンタムが弱まっているのか、そしてどの時間足で強い整合性があるのかを瞬時に確認できます。 ローンチ特別オファー – FX Trend NG を $30(6ヶ月) または $80 永久ライセンス でご利用いただけます。 すでに Stein Investments のユーザーですか? -> メッセージを送信 して、プライベートグループへアクセスしてください。 セットアップや詳細情報が必要ですか? -> Stein Investments 公式ページ をご覧ください。 1. FX Trend NG が他と異なる理由 3ステート・トレンドロジック ― Buy と Sell だけではない • 多くのインジケーターは Buy または Sell の2状態のみを表示します。
Gann Made Easy   は、ミスター・ギャンの理論を使用した取引の最良の原則に基づいた、プロフェッショナルで使いやすい外国為替取引システムです。 W・D・ガン。このインジケーターは、ストップロスとテイクプロフィットレベルを含む正確な買いと売りのシグナルを提供します。 PUSH通知を利用して外出先でも取引可能です。 ご購入後、取引方法の説明と優れた追加インジケーターを無料で入手するには、私にご連絡ください! おそらく、ギャンの取引手法についてはすでに何度も聞いたことがあるでしょう。通常、ギャンの理論は初心者のトレーダーだけでなく、すでにある程度の取引経験がある人にとっても非常に複雑なものです。なぜなら、ギャンの取引手法は理論的にはそれほど簡単に適用できるものではないからです。私はその知識を磨き、最良の原則を私の外国為替インジケーターに組み込むために数年を費やしました。 このインジケーターは非常に簡単に適用できます。必要なのは、それをチャートに添付し、簡単な取引推奨事項に従うだけです。このインジケーターは常に市場分析の仕事を行い、取引の機会を探します。適切なエントリーポイントを検
ARICoin is a powerful trading companion designed to generate high-probability entry signals with dynamic TP/SL/DP levels based on volatility. Built-in performance tracking shows win/loss stats, PP1/PP2 hits, and success rates all updated live. Key Features: Buy/Sell signals with adaptive volatility bands Real-time TP/SL/DP levels based on ATR Built-in MA Filter with optional ATR/StdDev volatility Performance stats panel (Success, Profit/Loss, PP1/PP2) Alerts via popup, sound, push, or email Cust
Trend Ai indicatorは、トレンドの識別と実用的なエントリポイントと反転アラートを組み合わせることで、トレーダーの市場分析を強化する優れたツールです。 この指標は、ユーザーが自信と正確さで外国為替市場の複雑さをナビゲートすることを可能にします トレンドAiインジケーターは、主要なシグナル以外にも、プルバックやリトレースメント中に発生するセカンダリエントリポイントを識別し、トレーダーが確立されたトレンド内の価格修正を活用できるようにします。 重要な利点: *MT4およびMT5の仕事 *明確な買いまたは売りシグナル *再描画しません ·すべての資産で動作します 私はeaやセットをtelegram it詐欺で販売しないように注意してください。 すべての設定はここでブログで無料です。  重要! 指示とボーナスを得るために購入後すぐに私に連絡してください! 私の他のプロダクトと同様、実質操作の監視はここに見つけることができます: https://www.mql5.com/en/users/mechanic/seller&nbsp ; 設定および入力: すべての
あなたのシンボルでどの戦略が実際に機能するか確認しましょう - リアルマネーをリスクにさらす前に。 Power Barは、あらゆるシンボルとあらゆるタイムフレームで 極端な価格バー を検出し、3つの異なるトレード戦略を即座にバックテストします。勝率、プロフィットファクター、損益を並べて比較できます。すべてが1つのインタラクティブなパネルに集約されています。 推測なし。カーブフィッティングなし。データだけです。 Power Barが特別な理由 ほとんどのインジケーターはシグナルを出すだけで、それが機能するかどうかは推測に任されます。Power Barはさらに先を行きます - すべてのシグナルを 3つの戦略 に対してテストし、統計を表示します。FlipFlop、Momentum、Reversalをワンクリックで切り替え、数値が即座に変化するのを確認できます。 FlipFlop - 常にポジションを保有。シグナルでエントリーし、反対シグナルでイグジット。当社のリサーチでは、US30、US500、DAXなどのトレンドのあるインデックスで最も効果的です。 Momentum - シグナルの方向に
まず第一に、この取引インジケーターは再描画されず、再描画されず、遅延しないことを強調する価値があります。これにより、手動取引とロボット取引の両方に理想的なものになります。 ユーザーマニュアル:設定、入力、戦略。 アトミックアナリストは、価格の強さとモメンタムを利用して市場でより良いエッジを見つけるためのPA価格アクションインジケーターです。ノイズや誤ったシグナルを除去し、取引ポテンシャルを高めるための高度なフィルターを備えています。複雑なインジケーターの複数のレイヤーを使用して、アトミックアナリストはチャートをスキャンし、複雑な数学的計算をシンプルなシグナルと色に変換します。これにより、どのような初心者トレーダーでも理解して使用し、一貫した取引の決定を行うことができます。 「アトミックアナリスト」は、新規および経験豊富なトレーダー向けにカスタマイズされた包括的な取引ソリューションです。プレミアムインジケーターとトップノッチの機能を1つの取引戦略に組み合わせ、すべてのタイプのトレーダーにとって汎用性のある選択肢にします。 デイリートレーディングとスキャルピング戦略:高速で正確なデイ
まず第一に、この取引ツールはノンリペイント、ノンリドロー、ノンラグの指標であり、プロの取引に理想的ですことを強調する価値があります。 オンラインコース、ユーザーマニュアル、デモ。 スマートプライスアクションコンセプトインジケーターは、新米から経験豊富なトレーダーまで、非常 に強力なツールです。Inner Circle Trader AnalysisやSmart Money Concepts Trading Strategiesなど、20以上の有用な指標を1つに組み合わせています。このインジケーターはスマートマネーコンセプトに焦点を当て、大手機関の取引方法を提供し、彼らの動きを予測するのに役立ちます。 特に、流動性分析に優れており、機関がどのように取引しているかを理解しやすくしています。市場のトレンドを予測し、価格の動きを慎重に分析するのに優れています。機関の戦略とトレードを合わせることで、市場の動向についてより正確な予測ができます。このインジケーターは多目的であり、市場構造を分析し、重要な注文ブロックを特定し、さまざまなパターンを認識するのに優れています。 このインジケーター
Crystal Heikin Ashi Signals - Professional Trend & Signal Detection Indicator Advanced Heikin Ashi Visualization with Intelligent Signal System for Manual & Automated Trading Final Price: $149 ---------> Price goes up $10 after every 10 sales . Limited slots available — act fast . Overview Crystal Heikin Ashi Signals is a professional-grade MetaTrader 5 indicator that combines pure Heikin Ashi candle visualization with an advanced momentum-shift detection system. Designed for both manual traders
FX Power: 通貨の強弱を分析して、より賢い取引を実現 概要 FX Power は主要通貨と金の実際の強弱をあらゆる市場状況で理解するための必須ツールです。強い通貨を買い、弱い通貨を売ることで、 FX Power は取引の意思決定を簡素化し、高い確率の取引機会を見出します。トレンドを追従する場合でも、極端なデルタ値を使用して反転を予測する場合でも、このツールはあなたの取引スタイルに完全に適応します。ただ取引するだけではなく、 FX Power で賢く取引をしましょう。 1. なぜ FX Power がトレーダーにとって非常に有益なのか 通貨と金のリアルタイム強弱分析 • FX Power は主要通貨と金の相対的な強弱を計算し、マーケットダイナミクスに関する明確な洞察を提供します。 • どの資産がリードしているか、または後れを取っているかを監視して、取引するペアを賢く選びましょう。 マルチタイムフレームの包括的なビュー • 短期、中期、長期のタイムフレームで通貨と金の強弱を追跡し、マーケットトレンドに基づいて取引戦略を調整できます。 • スキャルピングからスイングトレード
Auto Optimized Parabolic RSI: 高度な3Dモメンタムエンジン ほとんどのリテール向けインジケーターは、市場のボラティリティが変化した瞬間に破綻する静的な入力値に依存しているため、失敗に終わります。Auto Optimized Parabolic RSIは、自らの数学的優位性を継続的に再計算することで「インジケーターの陳腐化」問題を解決し、機関投資家レベルの定量的適応力をMT5ターミナルに直接もたらします。 最大の強み: カスタムインメモリ3D最適化 標準的な自動最適化ツールは、インジケーターの呼び出しで端末に過負荷をかけるため、頻繁にMT5プラットフォームをフリーズさせます。本ツールは、このボトルネックを完全に回避しています。RAMベースのカスタムネイティブ計算機を内蔵した内部エンジンは、チャートを読み込んだりタイムフレームを変更したりするたびに、超高速の3Dグリッド探索を実行します。RSI期間(頻度)、SARステップ(加速度)、SAR最大値(制限速度)を同時にスイープし、プラットフォームを遅延させることなく、数万通りものパラメーターの組み合わせを絶対的なミ
Bill Williams Advanced is designed for automatic chart analysis using Bill Williams' "Profitunity" system. The indicator analyzes four timeframes at once. Manual (Be sure to read before purchasing) Advantages 1. Analyzes the chart using Bill Williams' "Profitunity" system. Signals are displayed in a table in the corner of the screen and on the price chart. 2. Finds all known AO and AC signals, as well as zone signals. Equipped with a trend filter based on the Alligator. 3. Finds "Divergence Bar
Introducing Indicator for PainX and GainX Indices Traders on Weltrade Get ready to experience the power of trading with our indicator, specifically designed for Weltrade   broker's PainX and GainX Indices.  Advanced Strategies for Unbeatable Insights Our indicator employs sophisticated strategies to analyze market trends, pinpointing optimal entry and exit points.  Optimized for Maximum Performance To ensure optimal results, our indicator is carefully calibrated for 5-minute timeframe charts on
RelicusRoad Pro: 定量的市場オペレーティングシステム 【期間限定】無制限アクセス 70% OFF - 2,000人超のトレーダーと共に なぜ多くのトレーダーは「完璧な」インジケーターを使っても失敗するのでしょうか? それは、文脈を無視して 単一の概念 だけでトレードしているからです。文脈のないシグナルは単なるギャンブルです。勝ち続けるには、 根拠の重なり(コンフルエンス) が必要です。 RelicusRoad Proは単なる矢印インジケーターではありません。完全な 定量的市場エコシステム です。独自のボラティリティモデリングを用いて、価格が推移する「適正価値の道(Fair Value Road)」をマッピングし、ノイズと真の構造的ブレイクを判別します。 推測はやめましょう。機関投資家レベルの「ロード・ロジック」でトレードを。 コアエンジン:「Road」アルゴリズム システムの中心となる Road Algo は、市場環境にリアルタイムで適応するダイナミックなボラティリティチャネルです。 安全ライン(平衡点) と、価格が数学的に反転しやすい 拡張レベル を投影します。 Si
このインジケーターは、反転ポイントと価格戻りゾーンを正確に表示します。     主要プレーヤー 。新たなトレンドが形成される場所を把握し、最大限の精度で意思決定を行い、すべての取引をコントロールします。 TREND LINES PRO インジケーターと組み合わせることで、その潜在能力を最大限に発揮します。 VERSION MT4 インジケーターが示す内容: 新しいトレンドの始まりに活性化する反転構造と反転レベル。 リスクと報酬の比率を最小限に抑えた利益 確定 と 損失停止の レベルの表示     RR 1:2   。 インテリジェントな削減ロジックによるストップロス。 指定されたインジケーターから 2 つのトレンド タイプの反転パターンを表示します。 指標: トレンドを追う   TREND LINES PRO   (世界的なトレンドの変化) TREND PRO   (クイックトレンド変更) シンプルで効果的   スキャナー   リアルタイムトレンド(新機能)。 マルチタイムフレームのインストゥルメント フィルタリング。 画面   利益     LOGIC AI信号の後。 当日プラス方
CGE Trading Suite
Carl Gustav Johan Ekstrom
5 (1)
CGE Trading Suite delivers the analytical edge typically reserved for professional trading desks. The platform integrates a full suite of analytical tools into one seamless workflow: dynamic grid mapping, liquidity behavior analysis, ECM, trend lines, MIDAS, trade cycles, and directional channel projections. Together, these provide a unified view of market structure and momentum. Directional clarity is further enhanced by the capital flow index, which measures currency basket strength to identif
Berma Bands
Muhammad Elbermawi
5 (8)
Berma Bands (BBs) インジケーターは、市場のトレンドを特定して活用したいトレーダーにとって貴重なツールです。価格と BBs の関係を分析することで、トレーダーは市場がトレンド段階にあるか、レンジ段階にあるかを判断できます。 詳細については、[ Berma Home Blog ] をご覧ください。 バーマ バンドは、上部バーマ バンド、中部バーマ バンド、下部バーマ バンドの 3 つの異なる線で構成されています。これらの線は価格の周りにプロットされ、全体的な傾向に対する価格の動きを視覚的に表します。これらのバンド間の距離から、ボラティリティや潜在的な傾向の反転についての洞察を得ることができます。 バーマ バンドの線がそれぞれ離れると、市場が横ばいまたはレンジ相場の期間に入っていることを示すことがよくあります。これは、明確な方向性の偏りがないことを示しています。トレーダーは、これらの期間中にトレンドを特定するのが難しいと感じる可能性があり、より明確なトレンドが出現するまで待つ場合があります。 バーマ バンドの線が 1 本の線に収束すると、強いトレンド環境の兆候となること
ARIPoint is a powerful trading companion designed to generate high-probability entry signals with dynamic TP/SL/DP levels based on volatility. Built-in performance tracking shows win/loss stats, PP1/PP2 hits, and success rates all updated live. Key Features: Buy/Sell signals with adaptive volatility bands Real-time TP/SL/DP levels based on ATR Built-in MA Filter with optional ATR/StdDev volatility Performance stats panel (Success, Profit/Loss, PP1/PP2) Alerts via popup, sound, push, or email Cu
現在33%オフ 初心者にもエキスパートトレーダーにも最適なソリューション このインジケーターは独自の機能と新しい公式を多数内蔵しており、ユニークで高品質かつ手頃な取引ツールです。このアップデートでは、2つの時間枠ゾーンを表示できるようになります。より長いTFだけでなく、チャートTFとより長いTF(ネストゾーンを表示)の両方を表示できます。すべてのSupply Demandトレーダーの皆さんのお気に召すはずです。:) 重要情報の公開 Advanced Supply Demandの可能性を最大化するには、 https://www.mql5.com/ja/blogs/post/720245 にアクセスしてください。   エントリーまたはターゲットの正確なトリガーポイントを正確に特定できれば取引がどのように改善されるか想像してみてください。新しい基盤となるアルゴリズムに基づいて構築されているため、買い手と売り手の間の潜在的な不均衡をさらに簡単に特定できます。これは、最も強い需要と供給のゾーンと、過去のパフォーマンス(古いゾーンを表示)がグラフィカルに表現されるためです。これらの機能は、最適な
トレンドトレーディング は、タイミングのプルバックとブレイクアウトにより、市場で起こっているトレンドから可能な限り利益を得るように設計された指標です。確立されたトレンドの中で価格が何をしているかを分析することにより、取引の機会を見つけます。 [ インストールガイド | 更新ガイド | トラブルシューティング | よくある質問 | すべての製品 ] 自信を持って効率的に金融市場を取引する むち打ちにならずに確立されたトレンドから利益を得る 収益性の高いプルバック、ブレイクアウト、早期の逆転を認識する この指標は、独自の品質とパフォーマンスを分析します 複数時間枠のダッシュボードを実装します インジケーターは再描画されていません 電子メール/音声/視覚アラートを実装します 確立されたトレンドは多くの取引機会を提供しますが、ほとんどのトレンド指標はそれらを完全に無視しています。インジケーターの解釈はかなり簡単です: (1) トレンドの変化 (2) トレンドの方向への後退 (3) トレンドの方向へのブレイクアウト 赤いダッシュ は下降トレンド中の修正です 青いダッシュ は上昇トレンド中
作者のその他のプロダクト
Open trades knowing what your risk will be. The calculator returns the lot size for the MT4 desktop terminal and the units for mobile terminals. It works on every instrument that your broker offers (forex, gold, commodities, etc.) It can also be used to open market and pending orders with just one click. This system  adds an improvement to MT4's user interface.
The  Market Sessions Indicator for MT4 helps you predict market turnarounds  by detecting major supply and demand areas. These pivot points tend to occur after a new session has started and the previous one is still open. It is also used to gauge how many points or pips the market moves on average during a session. This helps us to place better our take profits and stop losses. The indicator works on all forex pairs, gold, silver, commodities, stocks, indices and any other instrument that your b
Multi instrument and multi time frame EA, with the best indicators.  The MSD EA can be used for automated and manual trading. Click on the '?' button on the dashboard to obtain information about the various elements of the MSD EA. Uses ATR Take Profits, ATR Stop Losses and ATR Trailing Stops. Comes with an FX Currency Strength meter and a Market Sessions indicator. Has the option to place Trade Lines (Buy, Sell, Close, Alarm). When the price reaches the trendline, the EA will perform the approp
Contact me to receive the set files for the EURUSD currency pair. The EA only opens trades at the beginning of a new candle and the user has the option to input fixed TP, SL and TS or ATR (dynamic) targets. The Expert can open multiple trades if the user decides to average down the entry price. When Max. number of trades is greater than 1, the EA will calculate its own Stop Loss. Fully automated trading Expert Advisor that works on every financial instrument, currency pair and time frame. To le
Multi Strategy Dashboard Utility Some functions of the MSD Utility can only be used on the full version. Multi instrument and multi time frame scanner, with the best indicators.  Comes with an order management panel. The MSD Utility can be used for manual trading. Click on the '?' button on the dashboard to obtain information about the various elements of the MSD Utility. Uses ATR Take Profits, ATR Stop Losses and ATR Trailing Stops. Comes with an FX Currency Strength meter and a Market Session
Easy to use indicator that will help you place your pending and market orders with great accuracy. The indicator plots the order blocks based on how price reacts to current market structure. These key levels represent supply and demand zones and the Smart Blocks Trading System indicator uses price to assess whether an asset is being accumulated or distributed. It can be used on any financial instrument, and on any given time frame. BoS stands for Break of (market) Structure. The blue and red d
Simple but convenient trade panel that will allow you to place market orders and manage your positions. Can be used to; Place a stop loss and take profit order.  Move your stop loss to break even. Move your trailing stop. Reduce your position after price has moved X pips/points in your favor. Delete and close all your open positions. Can be used on any financial asset and time frame. It works on all brokers.
Contact me to receive the set files for the EURUSD currency pair. The EA only opens trades at the beginning of a new candle and the user has the option to input fixed TP, SL and TS or ATR (dynamic) targets. The Expert can open multiple trades if the user decides to average down the entry price. When Max. number of trades is greater than 1, the EA will calculate its own Stop Loss. Fully automated trading Expert Advisor that works on every financial instrument, currency pair and time frame. To le
Multi instrument and multi time frame EA, with the best indicators.  The MSD EA can be used for automated and manual trading. Click on the '?' button on the dashboard to obtain information about the various elements of the MSD EA. Uses ATR Take Profits, ATR Stop Losses and ATR Trailing Stops. Comes with an FX Currency Strength meter and a Market Sessions indicator. Has the option to place Trade Lines (Buy, Sell, Close, Alarm). When the price reaches the trendline, the EA will perform the approp
Multi Strategy Dashboard Utility MT5        Some functions of the MSD Utility can only be used on the full version. Multi instrument and multi time frame scanner, with the best indicators.  Comes with an order management panel. The MSD Utility can be used for manual trading. Click on the '?' button on the dashboard to obtain information about the various elements of the MSD Utility. Uses ATR Take Profits, ATR Stop Losses and ATR Trailing Stops. Comes with an FX Currency Strength meter and a Mar
フィルタ:
are1971
747
are1971 2022.05.30 11:27 
 

ユーザーは評価に対して何もコメントを残しませんでした

Bolacha
116
Bolacha 2021.02.25 22:52 
 

ユーザーは評価に対して何もコメントを残しませんでした

ozcoz
278
ozcoz 2021.02.17 12:01 
 

ユーザーは評価に対して何もコメントを残しませんでした

Aleksandr Tamonin
4108
Aleksandr Tamonin 2021.01.23 13:28 
 

ユーザーは評価に対して何もコメントを残しませんでした

レビューに返信