TD Combo Scanner Metatrader 4
- インディケータ
- バージョン: 1.1
- アクティベーション: 20

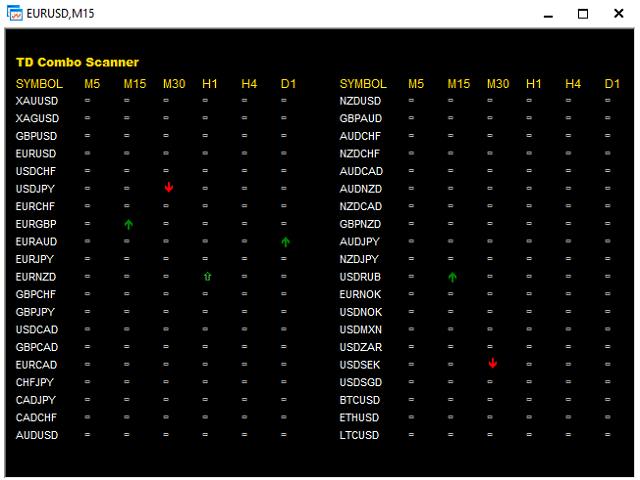
The indicator scans for TD Combo signals in multiple timeframes for the all markets filtered and shows the results on Dashboard.
Key Features
- Dashboard can be used for all markets
- It can scan for signals on MN1, W1, D1, H4, H1, M30, M15 ,M5, M1 timeframes
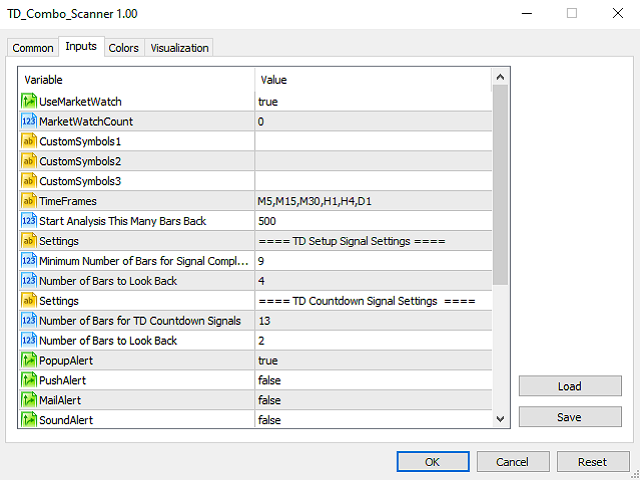
Parameters
- UseMarketWatch: Set true to copy all symbols available in market watch
- MarketWatchCount : Set the number of symbols that you want to copy from the market watch list.
- CustomSymbols: Enter the custom symbols that you want to be available in dashboard.
- Timeframes: Set the timeframes for dashboard.
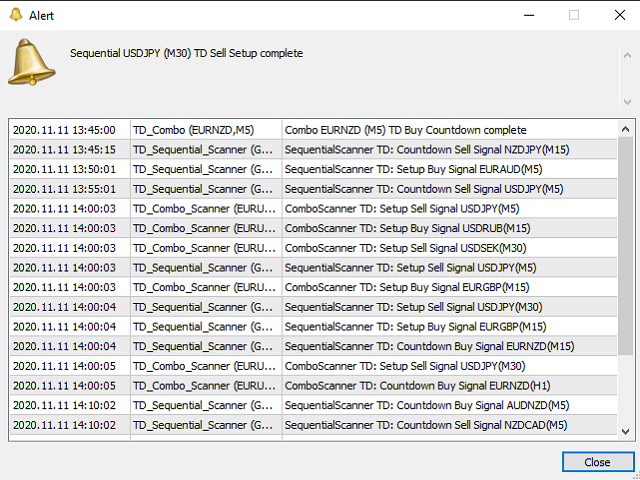
- Popup Alert: Set True to enable window popup and sound alert on the terminal when a fresh signal is generated. Set False to disable
- Email Alert: Set True to receive email notifications when a fresh signal is generated. Set False to disable.
- Push Alert: Set True to receive push notifications on your Apple or Android devices when a fresh signal is generated. Set False to disable
For MT5 version; please visit ► https://www.mql5.com/en/market/product/59019
For My Other Products; please visit ► https://www.mql5.com/en/users/samil34/seller