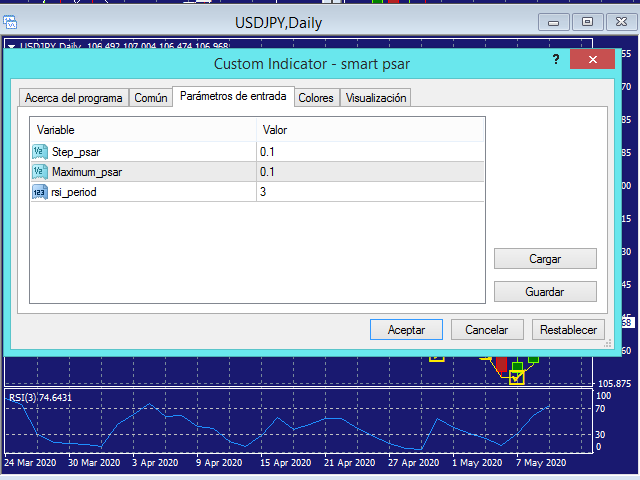
Smart Psar

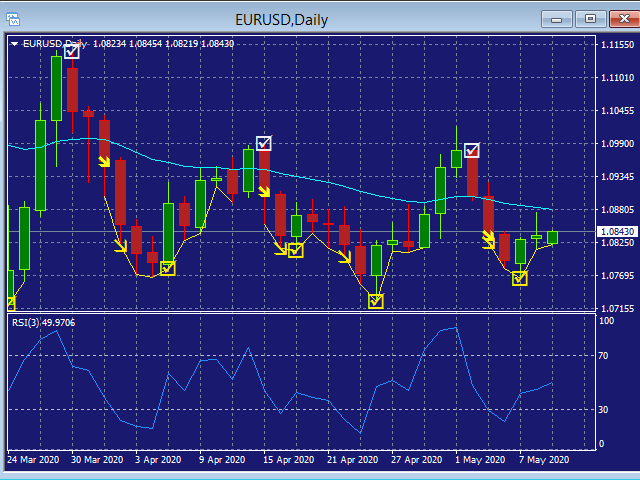
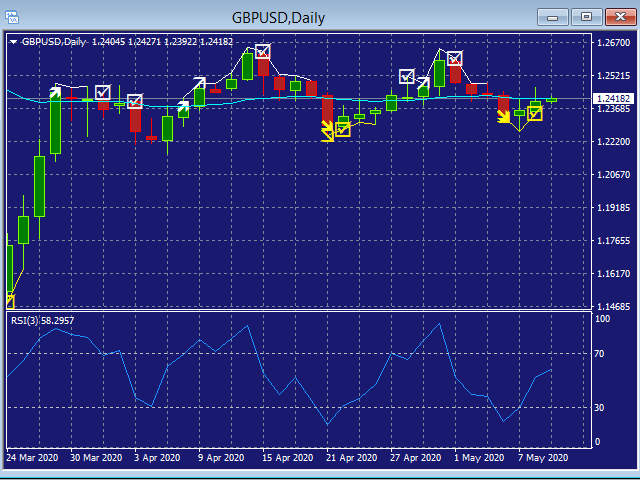
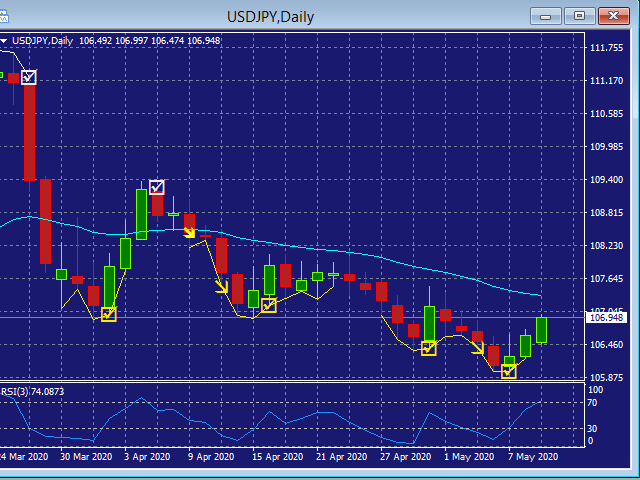
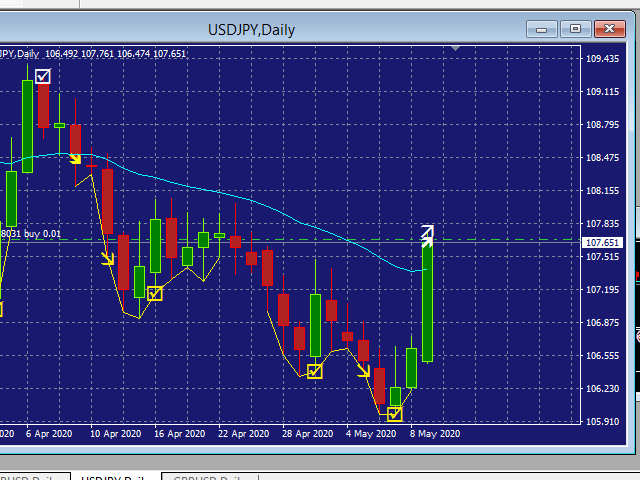
Smart Psar its an strategy indicator, based on the strategy of parabolic sar and exponencial moving average of 30 periods, when them aim to a long trend, then a white arrow will spawn in the high of the candle and it will a draw a line to follow the trade near the candles , before a time when the conditions are gived ,then a close position signal will be appear like a white check,but also if them aim to a shoty trend, then the arrow will be turn yellow spawning in the low of the candle and it will a draw a line to follow the trade near the candles , before a time when the conditions are gived ,then a close position signal will be appear like a yellow check, well its a so easy indicator to use, and so powerfull too, whit better results if use it for trade in long term, like swingtrading.
おすすめのプロダクト
Rainbow Price Visualizer v1.21 See where the market really breathes. Turns your MT4 chart into an ultra-precise heatmap that highlights price zones favored by big players. Why it matters 300 price levels at 0.2‑pip resolution — microscopic detail. 8 visual themes (Rainbow, Fire, Ocean…) for instant readibility. Smart opacity: low noise fades, real zones pop. Lightweight rendering with automatic cleanup. Fully customizable: saturation, opacity, resolution, history depth. Bands project into the f
Great Indicator
Ruben David Santana Rodriguez
Les presento un indicador que funciona como estrategia por si solo , trabaja muy bien en periodos de 4 horas pero puedes aplicarlo a cualquier timeframe , las señales son muy faciles de interpretar , en momento en que la linea naranja pasa hacia arriba las media azul y roja , se entra en largos , la operativa se mantiene abierta hasta que la linea naranja cruce la media mas cercana ya sea la azul o la roja , si la operacion era long y la linea azul cruza hacia arriba la linea roja y la naranja c
The indicator detects and displays 3 Drives harmonic pattern (see the screenshot). The pattern is plotted by the extreme values of the ZigZag indicator (included in the resources, no need to install). After detecting the pattern, the indicator notifies of that by a pop-up window, a mobile notification and an email. The indicator highlights the process of the pattern formation and not just the complete pattern. In the former case, it is displayed in the contour triangles. After the pattern is com
KDJ Index 4   交易实用必备工具指标 波浪自动计算指标,通道趋势交易 完美的趋势-波浪自动计算通道计算 , MT4版本 完美的趋势-波浪自动计算通道计算 , MT5版本 本地跟单复制交易 Easy And Fast Copy , MT4版本 Easy And Fast Copy , MT5版本 本地跟单复制交易 模拟试用 Easy And Fast Copy , MT4 模拟账号运行 Easy And Fast Copy , MT5 模拟账号运行 "Cooperative QQ:556024  "  "Cooperation wechat:556024"  "Cooperative email:556024@qq.com" 强烈推荐趋势指标, 波浪的标准自动计算   和   波浪的标准自动计算MT5版本     KDJ指标又叫 随机指标 ,是一种相当新颖、实用的技术分析指标,它起先用于期货市场的分析,后被广泛用于股市的中短期趋势分析,是期货和股票市场上最常用的技术分析工具。 随机指标KDJ一般是用于股票分析的统计体系,根据统计学原理,通过一个特定的周期(常为9日、9周等)
The indicator detects and displays Shark harmonic pattern (see the screenshot). The pattern is plotted by the extreme values of the ZigZag indicator (included in the resources, no need to install). After detecting the pattern, the indicator notifies of that by a pop-up window, a mobile notification and an email. The indicator highlights the process of the pattern formation and not just the complete pattern. In the former case, it is displayed in the contour triangles. After the pattern is comple
Are you ready to get Alert,aim,shot and take profit? well nice to meet you im Martin del NEGRO from Argentina, let me introduce you about your new indicator, this one have the knowledge to find pivot points in the chart ,more specifically when the price its starting a new strong trend (buy)bullish or bearish(sell) ,and when "Victory Ravage Days.ex4" indicator find this one pivot point, he will immediately get in touch with you send you a notification to take advantage of this fresh and new oport
NTF Pro(プロ仕様のトレンド追従型インディケーター)   は、現代の金融市場向けに特別に設計されたインテリジェントなトレンド分析ツールです。従来のテクニカル分析と人工知能アルゴリズムを融合し、投資家に高精度で多角的な市場トレンドの分析評価を提供します。リアルタイムの動的パラメーター最適化、複数の時間軸データの統合、市場センチメントの感知を通じて、NTF Proは取引判断の精度を大幅に向上させ、市場の転換点とトレンド継続の機会を捉えるのに役立ちます。 デイトレーダー向け: 1分~15分足チャートでのトレンド捕捉を実現し、出来高急増のアラートと連動します。 スイングトレーダー向け: 週足チャートにおける主要な上昇トレンドを識別し、中期調整リスクを回避するのに役立ちます。 三色ラインの機能と目的:赤 | 緑 | 黄 赤いラインより上 のエリアは強気(買い)優勢圏、 緑のラインより下 のエリアは弱気(売り)優勢圏と見なします。 明確な取引機会は、 両方のラインが同じ色を示した時のみ と判断します。 緑→黄→赤 への変化は、弱気圧力の終息と強気トレンドの始まりを示すシグナルです。 緑→
The Four Moving Averages indicator ( please see the description and video ), a version of Four Moving Averages Message , concurrently displays four Moving Averages with default settings in the main chart window: Green and Red ones represent a short-term trend, Red and Blue ones - mid-term trend, while Blue and Yellow ones - long-term trend. You can change the moving average settings and colors. However, these parameters have been configured so that to allow trading on all time frames. Take a loo
The well-known ZigZag indicator that draws rays based on the “significant movement” specified by the pips parameter. If a ray appears, it will not disappear (the indicator is not redrawn), only its extremum will be updated until the opposite ray appears. You also can display text labels on each rays describing the width of the ray in bars and the length of the ray in points.
The block of bars is collected under condition of divergence . If the divergence conditions are not met, the block is deleted. More precisely, the condition is the transition of the block of bars from the state of divergence to the state of convergence . Blocks are formed selectively with gaps. Gaps are characterized by the state of convergence of bars. The indicator shows the value and direction of the price in the divergence block . To determine the divergence value, see here , the line of ext
The arrow indicator without redrawing shows potential entry points into the market in the form of arrows of the appropriate color: the up arrows (usually green) suggest opening a purchase, the red down arrows suggest selling. The appearance of arrows may be accompanied by beeps. It is usually assumed to enter at the next bar after the pointer, but there may be non-standard recommendations. Arrow indicators visually "unload" the price chart and save time for analysis: no signal – no deal, if ther
「Auto FIBO Pro」Crypto_Forex インジケーターは、取引の補助ツールとして最適です。 - インジケーターは、フィボナッチ レベルとローカル トレンド ライン (赤色) を自動的に計算してチャート上に配置します。 - フィボナッチ レベルは、価格が反転する可能性のある重要な領域を示します。 - 最も重要なレベルは、23.6%、38.2%、50%、61.8% です。 - リバーサル スキャルピングやゾーン グリッド取引に使用できます。 - Auto FIBO Pro インジケーターを使用して、現在のシステムを改善する機会も多数あります。 - Info Spread Swap Display があり、接続されている外国為替ペアの現在のスプレッドとスワップを表示します。 - ディスプレイには、アカウントの残高、エクイティ、マージンも表示されます。 - Info Spread Swap Display は、チャートのどのコーナーにも配置できます。 0 - 左上コーナー、1 - 右上、2 - 左下、3 - 右下。 高品質のトレーディングロボットとインジケーターをご覧にな
Super Reversal Pattern Indicator Unlock the power of advanced pattern recognition with our Super Reversal Pattern Indicator. Designed for traders seeking precision and reliability, this indicator identifies one of the most effective reversal patterns in technical analysis, offering a significant edge in your trading strategy. Key Features: Non-Repainting Accuracy: Enjoy the confidence of non-repainting technology. Once a Super Reversal Pattern is detected, it remains static, providing consiste
The indicator shows the potential trend direction by cyclical-wave dependence. Thus, all the rays of the intersection will be optimal rays, in the direction of which the price is expected to move, taking into account the indicator period. Rays can be used as a direction for potential market movement. But we must not forget that the approach must be comprehensive, the indicator signals require additional information to enter the market.
The Range Directional Force Indicator is designed to help traders analyze market trends, reversals, and directional strength. It focuses on price movements within defined ranges, identifying key moments when the market is gaining momentum or preparing for a shift. By dividing the chart into dynamic price ranges, the indicator detects critical support and resistance levels. It calculates the directional force of price movements, highlighting potential entry and exit points based on market sentim
Reversal Signals   [AlgoAlpha] – Master Market Reversals with Precision! Elevate your trading strategy with the Reversal Signals indicator by AlgoAlpha. This advanced tool is designed to pinpoint potential bullish and bearish reversals by analyzing price action and, optionally, volume confirmations. It seamlessly combines reversal detection with trend analysis, giving you a comprehensive view of market dynamics to make informed trading decisions. Key Features   Price Action Reve
Advanced ADX indicator that allows operating on many timeframes simultaneously! Unique indicator with the ability to display ADX charts not only on the current timeframe, but also on higher ones. The example attached shows how it is possible to see 3 ADX chart on M5, M15 and M30 timeframes respectively. This functionality allows to significantly improve the accuracy of determining the trend. The Timeframe Delta parameter specifies how much the indicator’s timeframe should be different from the t
PW Oscillator
Svyatoslav Kucher
5 (1)
PW Oscillator   - индикатор предназначенный для поиска локальных экстремумов, определения текущей тенденции. В расчетах индикатора используется авторская методика. С помощью индикатора можно определять места возможного разворота цены желательно в направлении тенденции, но также с достаточной точностью и против нее. Также с помощью индикатора можно определять текущую тенденцию. Индикатор подходит для любых валютных пар, но для адекватного отображения показания необходимо, чтобы было достаточно ис
Phase Analytics Pro: Advanced Cyclic Market Analyzer Phase Analytics Pro is a sophisticated technical tool designed for traders who prioritize mathematical precision over lag-heavy traditional indicators. Based on the principles of digital signal processing, this indicator decomposes price action into phase and quadrature components to identify the dominant market cycle. How it works: The algorithm calculates the instantaneous phase of the market, allowing it to distinguish between trending and
This indicator is the logical continuation of the well-known equidistant channel indicator: https://www.mql5.com/en/market/product/8723 . The main purpose of the indicator is the visualization of price levels relative to the parallel channel using Fibo Bobokus levels in a separate window and the price history. This often allows forecasting the future price movement with a sufficiently high degree of probability. The Fibo levels calculation equation is as follows: FiboLevel = (50-(100*((Close[i]-
Indicator. "Indicator wave or Indicator Ma". Using 23 standard indicators and the author's algorithm, the levels of purchases (from 0 to +100) and sales (from 0 to -100) are calculated. Then, using the calculated levels, the "Wave Indicator" draws a wave with 21 moving averages. The wave number is equal to the averaging period of the calculated levels. Waves # 1 - 7 Fast Moving Averages Waves from No. 8 -14 moving averages Waves from No. 15-21 slow moving averages Looking at the figures drawn
Decent Trading Tools, The ones that separate the Winners from the Losers, do not have to be expensive. This is the second out of a series of two indicators from the magic series. This indicator is Magic Correlation , this is the Middle Indicator in the screenshot. The indicator plots up to 30 instruments and visualizes events like: Time, Start, End and Duration of the events. Underlying Correlation. Trend Strength. Front Runners and Laggards. Directions. Patterns. What normally remains hidden be
Pivot Point Breakout & Reversal is a fully automated Expert Advisor (EA) designed for intraday trading on the M15 timeframe . The EA trades breakouts of the Central Pivot Range (CPR) as well as reversals from support and resistance levels (R2, R1, S1, S2). Only one order of each type can be opened simultaneously. All orders are opened with StopLoss and TakeProfit. The order volume can be either fixed or variable . The EA implements various tactics of the full and partial order closure to decreas
A   professional version of the ZigZag indicator for visualizing the structure of price movements by fractals. Fractal ZigZag fixes the flaws of the standard version of the ZigZag indicator MT4. It uses Price action and a unique filtering algorithm to determine fractals. Suitable for all types of trading. Ideal for trading according to the WM pattern "Sniper" strategy !!! Features Marks the place of price reversal during the formation of a new fractal with specified parameters. Suitable for al
Relative Trend Bias The Relative Trend Bias indicator is a simple indicator that helps you identify the current directional movement bias of a financial instrument based on the number of bars specified. Helps you identify the current trend based on a bar period of your choice Shows you level "safety zones" for reversals Shows you when the trade bias changes while the indicator is active on the chart  Indicator is forward facing.  It does not backdraw/backpaint but it can be tested on the indica
VR Cub
Vladimir Pastushak
VR Cub は、質の高いエントリーポイントを獲得するためのインジケーターです。このインジケーターは、数学的計算を容易にし、ポジションへのエントリーポイントの検索を簡素化するために開発されました。このインジケーターが作成されたトレーディング戦略は、長年にわたってその有効性が証明されてきました。取引戦略のシンプルさはその大きな利点であり、初心者のトレーダーでもうまく取引することができます。 VR Cub はポジション開始ポイントとテイクプロフィットとストップロスのターゲットレベルを計算し、効率と使いやすさを大幅に向上させます。取引の簡単なルールを理解するには、以下の戦略を使用した取引のスクリーンショットを見てください。 設定、設定ファイル、デモ版、説明書、問題解決方法は、以下から入手できます。 [ブログ] レビューを読んだり書いたりすることができます。 [リンク] のバージョン [MetaTrader 5] エントリーポイントの計算ルール ポジションをオープンする エントリーポイントを計算するには、VR Cub ツールを最後の高値から最後の安値までストレッチする必要があります。 最初
SMC Venom Model BPR インジケーターは、スマート マネー (SMC) コンセプトで取引するトレーダー向けのプロフェッショナル ツールです。価格チャート上の 2 つの主要なパターンを自動的に識別します。 FVG   (フェアバリューギャップ) は、3 本のローソク足の組み合わせで、最初のローソク足と 3 番目のローソク足の間にギャップがあります。ボリュームサポートのないレベル間のゾーンを形成し、価格修正につながることがよくあります。 BPR   (バランス価格範囲) は、2 つの FVG パターンの組み合わせで、「ブリッジ」を形成します。これは、価格がボリュームアクティビティの少ない動きで動くときに、ブレイクアウトしてレベルに戻るゾーンで、ローソク足の間にギャップを作成します。 これらのパターンは、大規模な市場プレーヤーと一般参加者の相互作用が発生するチャート上のボリュームと価格動向の分析に基づいて、トレーダーが主要なサポート/レジスタンス レベル、ブレイクアウト ゾーン、エントリ ポイントを識別するのに役立ちます。 インジケーターは、長方形と矢印の形でパターンを視
Crypto_Forex MT4用インジケーター「 WPR SPEED 」は、優れた予測ツールで、リペイント機能はありません。 - このインジケーターの計算は物理学の方程式に基づいています。WPR SPEEDは、WPRオシレーター自体の1次導関数です。 - WPR SPEEDは、横ばい相場やフラット相場でのスキャルピングエントリーに適しています。 - WPR SPEEDインジケーターは、WPR自体の方向転換の速さを示します。非常に敏感です。 - モメンタムスキャルピング戦略には、WPR SPEEDインジケーターの使用をお勧めします。インジケーターの大きなピークを見つけ、反対方向にスキャルピングトレードを開始します(図を参照)。 - インジケーターには、モバイルとPCの両方でアラートが組み込まれています。 Click here to see high quality Trading Robots and Indicators! これは、このMQL5ウェブサイトでのみ提供されるオリジナル製品です。
Introducing the "Extreme Exhaustion Levels": A powerful tool for traders looking to identify market exhaustion and potential trend reversals. The Exhaustion Indicator is an advanced technical analysis tool that helps traders identify when markets are overbought or oversold, potentially indicating an imminent reversal in the trend. With a unique combination of price action, moving averages, and Bollinger Bands, the Exhaustion Indicator provides traders with a comprehensive view of market condit
This is a trend indicator without redrawing Developed instead of the binary options strategy (by the color of the Martingale candlestick) Also works well in forex trading When to open trades (binary options) A signal will appear in the place with a candle signaling the current candle It is recommended to open a deal for one candle of the current timeframe M1 and M5 When a blue dot appears, open a deal up When a red dot appears, open a trade down. How to open trades on Forex. When a signal is rec
このプロダクトを購入した人は以下も購入しています
Scalper Inside PRO – Since 2020. An exclusive indicator that utilizes an innovative algorithm to swiftly and accurately determine the market trend. The indicator automatically calculates opening, closing, and profit levels, providing detailed trading statistics. With these features, you can choose the most appropriate trading instrument for the current market conditions. Additionally, you can easily integrate your own arrow indicators into Scalper Inside Pro to quickly evaluate their statistics
Gann Made Easy は、ミスター・ギャンの理論を使用した取引の最良の原則に基づいた、プロフェッショナルで使いやすい外国為替取引システムです。 W・D・ガン。このインジケーターは、ストップロスとテイクプロフィットレベルを含む正確な買いと売りのシグナルを提供します。 PUSH通知を利用して外出先でも取引可能です。 ご購入後、取引方法の説明と優れた追加インジケーターを無料で入手するには、私にご連絡ください! おそらく、ギャンの取引手法についてはすでに何度も聞いたことがあるでしょう。通常、ギャンの理論は初心者のトレーダーだけでなく、すでにある程度の取引経験がある人にとっても非常に複雑なものです。なぜなら、ギャンの取引手法は理論的にはそれほど簡単に適用できるものではないからです。私はその知識を磨き、最良の原則を私の外国為替インジケーターに組み込むために数年を費やしました。 このインジケーターは非常に簡単に適用できます。必要なのは、それをチャートに添付し、簡単な取引推奨事項に従うだけです。このインジケーターは常に市場分析の仕事を行い、取引の機会を探します。適切なエントリーポイントを検出す
M1 SNIPER は使いやすいトレーディングインジケーターシステムです。M1時間足向けに設計された矢印インジケーターです。M1時間足でのスキャルピングのためのスタンドアロンシステムとして、また既存のトレーディングシステムの一部としても使用できます。このトレーディングシステムはM1時間足での取引に特化して設計されていますが、他の時間足でも使用できます。元々、この手法はXAUUSDとBTCUSDの取引用に設計しましたが、他の市場においても役立つと考えています。 インジケーターのシグナルは、トレンドの方向と逆方向に取引できます。インジケーターのシグナルを利用して両方向に取引するのに役立つ特別な取引テクニックをご紹介します。この手法は、特別な動的なサポートとレジスタンスの価格帯を利用することに基づいています。 ご購入後、M1 SNIPER矢印インジケーターをすぐにダウンロードできます。さらに、M1 SNIPERツールのすべてのユーザーに、以下のスクリーンショットに表示されているApollo Dynamic SRインジケーターを無料で提供しています。この2つのインジケーターを組み合わせることで
ゴールドラッシュ・トレンド・アロー・シグナル ゴールドラッシュ・トレンド・アロー・シグナル 指標は、XAU/USDにおける高速・短期スキャルパー向けに最適化された、正確でリアルタイムのトレンド分析を提供します。 1分足専用に設計されたこのツールは、明確なエントリーポイントを示す方向矢印を表示し、スキャルパーが変動の激しい市場状況でも自信を持って取引できるよう支援します。 この指標は、PRIMARY(主要)とSECONDARY(補助)のアラート矢印で構成されています。PRIMARYシグナルは、トレンドの方向転換を示す白と黒の方向矢印であり、SECONDARYシグナルは、PRIMARY矢印が示す方向を確認し、潜在的なエントリーポイントを示す青と赤の矢印です。 注意:トレンド方向の変化後にPRIMARYアラート矢印が1つだけ表示される場合、複数のSECONDARY青/赤矢印が表示される点に注意が必要です。SECONDARYシグナルは、シグナル基準を満たす任意のローソク足後に表示されます。したがって、長期的なトレンド移動の場合、画面に多くのSECONDARY矢印が表示されます(添付の
PRO Renko Systemは、特別にRENKOチャートを取引するために設計された高精度の取引システムです。 これは、様々な取引商品に適用することができる普遍的なシステムです。 システムは効果的に正確な逆転信号へのアクセスを与えるいわゆる市場の騒音を中和する。 表示器は非常に使いやすく、信号の生成に責任がある1つの変数だけがあります。 あなたは簡単にお好みの任意の取引ツールとレンコバーのサイズにツールを適応させることができます。 私はいつもあなたが私のソフトウェアで収益性の高い取引を支援するために余分なサポートを提供する準備ができています! 私はあなたに幸せで収益性の高い取引をしたいです! ご購入後にご連絡ください! 私はあなたに私のレンコチャートジェネレータを送信します。 私はまた、私の個人的な推奨事項やシステムの他のモジュールを無料で共有します!
After purchase, contact me privately to receive 1 month of free testing with EA Forex Proton! This advanced MT4 trading robot automatically executes signals from any MT4 indicator, including Market Makers. The latest version also includes AI integration, allowing each trade signal to be analyzed using Artificial Intelligence. Live Signal with EA Forex Proton: Click here Market Makers is a powerful price action trading system designed to identify high-probability Buy and Sell opportunities based
Advanced Supply Demand
Bernhard Schweigert
4.91 (300)
現在40%オフ 初心者にもエキスパートトレーダーにも最適なソリューション このインジケーターは独自の機能と新しい公式を多数内蔵しており、ユニークで高品質かつ手頃な取引ツールです。このアップデートでは、2つの時間枠ゾーンを表示できるようになります。より長いTFだけでなく、チャートTFとより長いTF(ネストゾーンを表示)の両方を表示できます。すべてのSupply Demandトレーダーの皆さんのお気に召すはずです。:) 重要情報の公開 Advanced Supply Demandの可能性を最大化するには、 https://www.mql5.com/ja/blogs/post/720245 にアクセスしてください。   エントリーまたはターゲットの正確なトリガーポイントを正確に特定できれば取引がどのように改善されるか想像してみてください。新しい基盤となるアルゴリズムに基づいて構築されているため、買い手と売り手の間の潜在的な不均衡をさらに簡単に特定できます。これは、最も強い需要と供給のゾーンと、過去のパフォーマンス(古いゾーンを表示)がグラフィカルに表現されるためです。これらの機能は、最適な
チャートを構成し、周期的な価格変動を識別するテクニカル指標。 どのチャートでも動作します。 いくつかの種類の通知。 グラフ自体に追加の矢印があります。 履歴を再描画せずに、キャンドルのクローズに取り組みます。 M5以上のTFを推奨します。 パラメータの使用と設定が簡単です。 異なるパラメータを持つ 2 つのインジケーターを使用する場合、他のインジケーターなしで使用できます。 入力パラメータは2つあります 周期性と信号持続時間 これら 2 つのパラメータは、チャート構造の処理を扱います。 Cyclicity - 反転サイクルが変化する頻度を調整し、サイクルを滑らかにします。 Signal duration - 最小数では価格変動の衝動を検出し、最大数では長期的なトレンドの動きを検出します。
NAM Divergences
NAM TECH GROUP, CORP.
5 (1)
MT4マルチタイムフレームの発散と売られ過ぎ/売られ過ぎの検出インジケーター。 特徴 -チャートコントロールパネルで完全にカスタマイズ可能で、完全な相互作用を提供します。 -必要な場所でコントロールパネルを表示および非表示にします。 -資本化されていない発散に関するリアルタイムの情報。 -売られ過ぎ/売られ過ぎの状況に関するリアルタイム情報。 -定期的な発散に関するリアルタイムの情報。 -隠れた発散に関するリアルタイム情報。 -発散検出に使用できる発振器:AO、RSI、CCI、MACD、STOCH、RMI、TDI、RSIOMA。 -通知サービス(画面アラート|プッシュ通知)。 概要 発散取引を使用すると、弱体化傾向や勢いの逆転を見つけるのに役立ちます。トレンドが続くためのシグナルとして使用できる場合もあります。私たちのツールは、チャートを可能な限りクリーンに保つために、表示と非表示の可能性を備えた驚くほど快適で直感的なコントロールパネルで、すべての時間枠で同時に発散検出を提供します。 選択した履歴期間に、買われ過ぎと売られ過ぎの状況、通常の相違、隠れた相違
Auto Optimized Parabolic RSI: 高度な3Dモメンタムエンジン ほとんどのリテール向けインジケーターは、市場のボラティリティが変化した瞬間に破綻する静的な入力値に依存しているため、失敗に終わります。Auto Optimized Parabolic RSIは、自らの数学的優位性を継続的に再計算することで「インジケーターの陳腐化」問題を解決し、機関投資家レベルの定量的適応力をMT5ターミナルに直接もたらします。 最大の強み: カスタムインメモリ3D最適化   標準的な自動最適化ツールは、インジケーターの呼び出しで端末に過負荷をかけるため、頻繁にMT5プラットフォームをフリーズさせます。本ツールは、このボトルネックを完全に回避しています。RAMベースのカスタムネイティブ計算機を内蔵した内部エンジンは、チャートを読み込んだりタイムフレームを変更したりするたびに、超高速の3Dグリッド探索を実行します。RSI期間(頻度)、SARステップ(加速度)、SAR最大値(制限速度)を同時にスイープし、プラットフォームを遅延させることなく、数万通りものパラメーターの組み合わせを絶対的
現在40%オフ 初心者やエキスパートトレーダーに最適なソリューション! このインジケーターは、独自の機能と新しい計算式を取り入れた、ユニークで高品質、かつ手頃な価格のトレーディングツールです。たった1枚のチャートで28の為替ペアの通貨強度を読み取ることができます。新しいトレンドやスキャルピングチャンスの引き金となるポイントを正確に特定することができるので、あなたのトレードがどのように改善されるか想像してみてください。 ユーザーマニュアルはこちら  https://www.mql5.com/en/blogs/post/697384 これが最初の1本、オリジナルだ! 価値のないクローンを買わないでください。 特別な サブウィンドウの矢印で強い通貨の勢いを表示 GAPがあなたのトレードを導く! 基準通貨や気配値が売られすぎ・買われすぎのゾーン(外相フィボナッチレベル)にあるとき、個別チャートのメインウィンドウに警告表示。 通貨がレンジの外側から反落した場合、プルバック/リバーサルのアラート。 クロスパターンの特別なアラート 複数の時間枠を選択可能で、トレンドを素早く確認できます
「 Dynamic Scalper System 」インジケーターは、トレンド波の中でスキャルピング取引を行う手法のために設計されています。 主要通貨ペアと金でテスト済みで、他の取引商品との互換性があります。 トレンドに沿った短期的なポジションオープンのシグナルを提供し、追加の価格変動サポートも提供します。 インジケーターの原理 大きな矢印はトレンドの方向を決定します。 トレンド波の中では、小さな矢印の形でスキャルピングシグナルを生成するアルゴリズムが機能します。 赤い矢印は強気方向、青い矢印は弱気方向です。 トレンドの方向には敏感な価格変動ラインが描かれ、小さな矢印のシグナルと連動します。 シグナルは次のように機能します。適切なタイミングでラインが現れるとエントリーシグナルが形成され、ラインが開いている間はポジションが保持され、完了すると取引が終了します。 推奨される動作時間枠はM1~H4です。 矢印は現在のローソク足に形成され、次のローソク足が開いている場合は、前のローソク足の矢印は再描画されません。 入力パラメータ Trend Wave Period - トレンド方向
現在40%オフ! 初心者やエキスパートトレーダーに最適なソリューション! このインジケータは、独自の機能と秘密の数式を組み込んだ、ユニークで高品質かつ手頃な価格のトレーディングツールです。たった1枚のチャートで28の通貨ペアのアラートを表示します。新しいトレンドやスキャルピングチャンスの引き金となるポイントを正確に把握することができるので、あなたのトレードがどのように改善されるか想像してみてください! 新しい基本的なアルゴリズムに基づいて構築されているため、潜在的な取引の特定と確認がより簡単になります。これは、通貨の強さや弱さが加速しているかどうかをグラフィカルに表示し、その加速のスピードを測定するためです。加速すると物事は明らかに速く進みますが、これはFX市場でも同じです。つまり、反対方向に加速している通貨をペアにすれば、利益を生む可能性のある取引を特定することができるのです。 通貨の勢いを示す縦の線と矢印は、あなたの取引の指針となるでしょう。 ダイナミックマーケットフィボナッチ23レベルはアラートトリガーとして使用され、市場の動きに適応します。もしインパルスが黄色のトリガ
通貨強さウィザードは、取引を成功させるためのオールインワン ソリューションを提供する非常に強力な指標です。このインジケーターは、複数の時間枠のすべての通貨のデータを使用して、このまたはその外国為替ペアのパワーを計算します。このデータは、使いやすい通貨インデックスと通貨パワーラインの形式で表され、特定の通貨のパワーを確認するために使用できます。 必要なのは、取引したいチャートにインジケーターを接続することだけです。インジケーターは、取引する通貨の実際の強さを示します。このインジケーターは、トレンドに合わせて取引するときに有利に利用できる売買高の圧力の極値も示します。このインジケーターには、フィボナッチに基づく可能なターゲットも表示されます。 このインジケーターは、PUSH 通知を含むあらゆるタイプのアラートを提供します。 購入後ご連絡下さい。私の取引のヒントをあなたと共有し、素晴らしいボーナスインジケーターを無料で提供します! 幸せで有益な取引をお祈りします。
Apollo SR Master は、サポート/レジスタンスゾーンを利用した取引をより容易かつ確実にする特別な機能を備えたサポート/レジスタンスインジケーターです。このインジケーターは、ローカル価格の高値と安値を検出することで、タイムラグなしでリアルタイムにサポート/レジスタンスゾーンを計算します。そして、新たに形成されたSRゾーンを確認するために、インジケーターは特別なシグナルを表示します。このシグナルは、SRゾーンを実際の売りまたは買いシグナルとして考慮して使用できることを示します。この場合、SRゾーンの強度が高まり、SRエリアからの取引が成功する確率も高まります。これがこのインジケーターの基本的な考え方です。 SRゾーンは、ストップロスとテイクプロフィットの設定を容易にします。シグナルの方向に応じて、SRゾーンの上または下のスペースをストップロスとして設定できます。さらに、反対側のSRゾーンは、潜在的なテイクプロフィットエリアとして設定できます。 また、Apollo SRマスターインジケーターをご利用のすべてのユーザーには、「Apollo Price Action System」
Scalping Lines System - は、M1-H1の時間枠で金(XAUUSD)を取引するために特別に設計されたスキャルピング取引システムです。 トレンド、ボラティリティ、買われ過ぎ/売られ過ぎの市場分析のための指標を1つのオシレーターに統合し、短期的なシグナルを識別します。 シグナルラインの主要な内部パラメータは事前​​に設定されています。 一部のパラメータは手動で調整可能です。「トレンド波の持続時間」(MAトレンドを使用してトレンド方向の一連のシグナルの持続時間を調整)と「シグナルラインにスムージングを適用」(シグナルラインの生成を調整)です。 始値でシグナルラインを計算する際、インジケーターは再描画されません。他の価格では、シグナル矢印がちらつく場合があります。 シグナルはローソク足が閉じた後に表示され、複数のアラートタイプが用意されています。 推奨される時間枠:M1-M5-M15-M30-H1。 このインジケーターは元々金の取引用に設計されましたが、スプレッドの低いボラティリティの高い資産(BTCや暗号通貨、銀、株価指数CFD(ナスダック100など))の取引にも適
地震計マーケット クエイク検出器。 Description in English : https://www.mql5.com/en/market/product/113869?source=Site+Market+Product+Page#description How to use the Seismograph : https://www.mql5.com/en/market/product/113869#!tab=comments&page=2&comment=52806941 Create an EA : https://www.mql5.com/en/market/product/113869#!tab=comments&page=3&comment=52816509 どのような取引方法であれ、流動性の低い市場への参入は避けたいものです。 地震計は、市場が上昇する前に市場に参入する適切なタイミングに役立ちます。 しかし、忙しいはずの市場時間帯にエントリーするようにしたにもかかわらず、流動性の低い市場に閉じ込められてしまう人が多いのが実情です。 数時間待った後、
Trend Screener
STE S.S.COMPANY
4.79 (95)
トレンドインジケーター、1つのツールに組み込まれたすべての重要なトレンド機能を備えたトレンドトレーディングとフィルタリングのための画期的なユニークなソリューション! これは、すべてのシンボル/商品(外国為替、商品、暗号通貨、インデックス、株式)で使用できる100%再描画されていないマルチタイムフレームおよびマルチ通貨インジケーターです。 期間限定オファー: サポートおよびレジスタンス スクリーナー インジケーターは、たった 65 ドルで永久的にご利用いただけます。(元の価格 250 ドル) (オファー延長) トレンドスクリーナーは、チャート内のドットで矢印トレンドシグナルを提供するインジケーターに続く効率的なインジケーターです。 トレンド分析インジケーターで使用できる機能: 1.トレンドスキャナー。 2.最大利益分析を備えたトレンドライン。 3.トレンド通貨強度メーター。 4.アラート付きのトレンド反転ドット。 5.アラート付きの強いトレンドドット。 6.トレンド矢印 毎日の分析例、毎日のシグナルパフォーマンス...など、トレンドスクリーナーインジケーターを使用して、ここで見つけること
まず第一に、この取引インジケーターは再描画されず、再描画されず、遅延しないことを強調する価値があります。これにより、手動取引とロボット取引の両方に理想的なものになります。 ユーザーマニュアル:設定、入力、戦略。 アトミックアナリストは、価格の強さとモメンタムを利用して市場でより良いエッジを見つけるためのPA価格アクションインジケーターです。ノイズや誤ったシグナルを除去し、取引ポテンシャルを高めるための高度なフィルターを備えています。複雑なインジケーターの複数のレイヤーを使用して、アトミックアナリストはチャートをスキャンし、複雑な数学的計算をシンプルなシグナルと色に変換します。これにより、どのような初心者トレーダーでも理解して使用し、一貫した取引の決定を行うことができます。 「アトミックアナリスト」は、新規および経験豊富なトレーダー向けにカスタマイズされた包括的な取引ソリューションです。プレミアムインジケーターとトップノッチの機能を1つの取引戦略に組み合わせ、すべてのタイプのトレーダーにとって汎用性のある選択肢にします。 デイリートレーディングとスキャルピング戦略:高速で正確な
現在40%OFF! このダッシュボードは、複数のシンボルと最大9つのタイムフレームで動作するソフトウェアの非常に強力な部分です。 このソフトは、弊社のメインインジケーター(ベストレビュー:Advanced Supply Demand)をベースにしています。    Advanced Supply Demand ダッシュボードは、素晴らしい概要を提供します。それは示しています。  ゾーン強度評価を含むフィルタリングされた需給値。 ゾーン内/ゾーンへのPips距離。 ネストされたゾーンがハイライトされます。 選択されたシンボルの4種類のアラートを全ての(9)時間枠で提供します。 それはあなたの個人的なニーズに合わせて高度に設定可能です。 あなたの利益! すべてのトレーダーにとって最も重要な質問です。 市場に参入するのに最適なレベルはどこか? 成功のチャンスとリスク/リターンを得るために、強力な供給/需要ゾーン内またはその近くで取引を開始します。 損切りの最適な位置はどこですか? 最も安全なのは、強力な供給/需要ゾーンの下/上にストップを置くことです。 最適な利益
Smart Liquidity Matrix は、MetaTrader 4 向けの非再描画型 ICT スマートマネー指標です。オーダーブロック、フェアバリューギャップ、マーケットストラクチャーの変化(ストラクチャーブレイクとキャラクターチェンジ)、等値高値/等値安値、流動性スイープを検出することで機関投資家のオーダーフロー全景を描き出し、複数のスマートマネー条件が確定済みバーの終値で一致したときにコンフルエンス評価付きの買いシグナルと売りシグナルを生成します。すべてのシグナルには自動計算されたエントリー・ストップロス・テイクプロフィットレベルがチャート上に直接表示され、プレミアム5セクションダッシュボードではリアルタイムの市場コンテキスト、トレンド分析、コンフルエンスマッピング、アクティブシグナル追跡、M1からMNまでをカバーする9タイムフレームシグナルスキャナーを提供します。ライトモードはよりクリーンなビューを好むトレーダー向けにチャートを必要最低限に絞り込み、11種類のアラートタイプ(Webhook JSONを含む)がポップアップ・サウンド・プッシュ・メールの各チャネルで常に最新情
Super Signal – Skyblade Edition プロ仕様のノンリペイント / ノーラグ・トレンドシグナルシステム。卓越した勝率を実現 | MT4 / MT5 対応 1分足、5分足、15分足などの低い時間足で最も効果を発揮します。 主な特徴: Super Signal – Skyblade Edition は、トレンド取引に特化したスマートなシグナルシステムです。マルチレイヤーのフィルターロジックを用いて、明確な方向性と実際のモメンタムに支えられた強力なトレンドのみを検出します。 このシステムは 天井や底を予測するものではありません 。次の3つの条件がすべて満たされた場合にのみシグナルを発生させます: 明確なトレンド方向 モメンタムの増加 健全なボラティリティ構造 市場セッションに基づく流動性分析と組み合わせることで、シグナルの精度とタイミングがさらに向上します。 シグナルの特性: すべての矢印シグナルは 100% 非リペイント / 遅延なし 一度出現したシグナルは固定され、点滅・消失しません チャート上の矢印、情報パネル、ポップアップ通知、音声アラート、プッシュ通知
Legacy of Gann
Pavel Zamoshnikov
4.83 (12)
The indicator very accurately determines the levels of the possible end of the trend and profit fixing. The method of determining levels is based on the ideas of W.D.Gann, using an algorithm developed by his follower Kirill Borovsky. Extremely high reliability of reaching levels (according to K. Borovsky  - 80-90%) Indispensable for any trading strategy – every trader needs to determine the exit point from the market! Precisely determines targets on any timeframes and any instruments (forex, met
単純なドラッグアンドドロップEAでMetatrader4をPythonに接続するためのドキュメント。 完全にテストされた、高速で効率的な完全なエンドツーエンドソリューション! Pytraderエコシステムは、PythonスクリプトとMT4またはMT4EAで構成されています。 さらに、ライセンス供与にはインジケーターが使用されます。 PythonスクリプトとEAの間の通信は、ソケットに基づいています。 EAはサーバーであり、Pythonスクリプトはクライアントです。 それは常にquery(関数/ pythonスクリプト)とoutput(データ/サーバー)です。 EAは、Pythonスクリプトが実行されているのと同じコンピューターで実行する必要はありません。 Githubリンクには、Pythonスクリプト、EA、完全なドキュメント、および関数の呼び出し方法を示すPytraderサンプルスクリプトがあります。 質問については、不和チャンネルもあります。 デモ(ライセンスインジケーターなし)でも全機能がありますが、機器の数は限られています (EURUSD、AUDCHF、NZDCHF、GBP
NextCandlePredictor インジケーター NextCandlePredictorは、再描画しない、色が変わらない、動かない、消えない、遅延がないアラート付きのシグナルインジケーターです。あらゆるタイムフレームで次のキャンドルまたはその次のキャンドルの方向を識別するのに役立ちます。ニューヨーク、ロンドン、またはその両方の重なり合う高ボラティリティ市場に特にお勧めです。 主な特徴: タイムフレームの汎用性: M1からH1以上のあらゆるタイムフレームで迅速かつ正確なシグナルを提供します。 明確な買い/売りシグナル: ADXのDI+とDI-ラインを使用して明確な買いと売りのシグナルを生成し、最良のトレード判断を下せるようにします。 直感的な視覚化: シグナルはチャート上に緑色(買い)と赤色(売り)の矢印で直接表示され、迅速かつ簡単に読み取れます。 カスタマイズ可能な設定: 分析するバーの数とアラートオプションを好みとトレード戦略に応じて調整できます。使用するTFに応じた提案表を以下で確認してください。 即時およびオプションのキャンドル終了時アラート: デフォルトでは、ADX条件が
FullScalping は、あらゆる市場で 継続的なスキャルピングエントリー を生成するように特別に設計された 再描画なし、後方描画なし のインジケーターです。絶え間ないアクションを求める積極的なトレーダーに最適です! 独占情報とアップデートを入手するには、チャンネルに参加してください: https://www.mql5.com/en/channels/forexnewadvisor ほぼすべてのローソク足 でシグナルを出し、トレンドを確認するか、重要なリトレースメントをシグナルします。常にあなたを導くレーダーのようなものです。 どのように機能しますか?非常にシンプルです: 赤い矢印 売り 取引に入る。 青い矢印 買い 取引に入る。 常に一般的なトレンドの方向に取引し、 取引ごとに15〜20ピップ を積極的にターゲットにし、急激な市場の反転の前に素早く退出します。 シグナルは 継続的 なので、取引機会が尽きることはありません。目標は以下を使用して 集中的なスキャルピング を実行することです: 高ロット 低スプレッド(左下隅に表示) 最後のトレンド変化の近くに配置された
推測をやめて、統計的優位性を持って取引を始めましょう 株価指数はFXとは異なる動きをします。決まったセッションがあり、オーバーナイトでギャップが発生し、予測可能な統計パターンに従います。このインジケーターは、DAX、S&P 500、ダウ・ジョーンズなどの指数を自信を持って取引するために必要な確率データを提供します。 何が違うのか ほとんどのインジケーターは何が起こったかを示します。このインジケーターは次に何が起こる可能性が高いかを示します。毎取引日、インジケーターは100日間のヒストリカルデータに対して現在のセットアップを分析します。類似のギャップ、類似のオープニングポジションを持つ日を見つけ、価格が主要なレベルに到達した頻度を正確に計算します。ギャップが埋まるか、昨日の高値がテストされるかの推測はもう必要ありません。実際のデータに基づいた正確なパーセンテージが得られます。 すべての入力パラメータを説明した完全なマニュアルはこちら: https://www.mql5.com/en/blogs/post/766370 優れたセットアップを見つけるための戦略ガイドはこちら: https:/
Volatility Trend System - a trading system that gives signals for entries. The volatility system gives linear and point signals in the direction of the trend, as well as signals to exit it, without redrawing and delays. The trend indicator monitors the direction of the medium-term trend, shows the direction and its change. The signal indicator is based on changes in volatility and shows market entries. The indicator is equipped with several types of alerts. Can be applied to various trading ins
Trend Scanner PRO First of all, it’s worth emphasizing that this trading system is 100% Non-Repainting, Non-Redrawing, and Non-Lagging , which makes it ideal for both   manual   and   algorithmic   trading setups. Online course, user manual, and downloadable presets included. The Trend Scanner Dashboard is a professional   multi pair scanner   that analyzes multiple symbols and timeframes at once, giving you an instant   market scanner   view of the real trend direction. Instead of switching ch
Trend indicator AI
Ramil Minniakhmetov
4.54 (84)
Trend Ai indicatorは、トレンドの識別と実用的なエントリポイントと反転アラートを組み合わせることで、トレーダーの市場分析を強化する優れたツールです。 この指標は、ユーザーが自信と正確さで外国為替市場の複雑さをナビゲートすることを可能にします トレンドAiインジケーターは、主要なシグナル以外にも、プルバックやリトレースメント中に発生するセカンダリエントリポイントを識別し、トレーダーが確立されたトレンド内の価格修正を活用できるようにします。 重要な利点: *MT4およびMT5の仕事 *明確な買いまたは売りシグナル *再描画しません ·すべての資産で動作します 私はeaやセットをtelegram it詐欺で販売しないように注意してください。 すべての設定はここでブログで無料です。  重要! 指示とボーナスを得るために購入後すぐに私に連絡してください! 私の他のプロダクトと同様、実質操作の監視はここに見つけることができます: https://www.mql5.com/en/users/mechanic/seller&nbsp ; 設定および入力: すべての
作者のその他のプロダクト
Parabolic Sar easy mode, remake the original p.sar indicator making it more easy to read for novicians traders and experimented traders looking to reduce the time analizing the charts, you can make your own strategy modificating the periods and fusioning it with others indicators like RSI ,stochastic or what you want,its one indicator runs better on high time charts like H4 or D1.
FREE
Lines Resource is an technical indicator that dysplay lines in the chart giving some notion of supports and resistance levels for the correct functionallity of Optimal Investor EA an multicurrency EA that gives an 52% return monthly.  Please install it, to run Optimal Investor EA correctly. Next to it, install Profitnator Resources Indicator FREE , to Run Optimal Investor EA.the second and last one resource.
FREE
Are you ready to get Alert,aim,shot and take profit? well nice to meet you im Martin del NEGRO from Argentina, let me introduce you about your new indicator, this one have the knowledge to find pivot points in the chart ,more specifically when the price its starting a new strong trend (buy)bullish or bearish(sell) ,and when "Victory Ravage Days.ex4" indicator find this one pivot point, he will immediately get in touch with you send you a notification to take advantage of this fresh and new oport
ADX revolution
MARTIN ANDRES DEL NEGRO
ADX revolution its an revolutionary indicator, this one simplificate all the signals of convencional ADX indicator, analyzing the market more quickly and giving more colour to the entry signals, to gift you more time for trade and dont waste time analizing. Nice to meet you trader!, im from Argentina if you have any question  please contact me by my email: despiertatutrader@gmail.com
Stochastic easy cross, its a simplificated version of original Stochastic indicator, its one its based on the cross of the main line and the signal line of the indicator,and when a cross ocurrs , a cross or a flower will be drawn , if a blue cross appear its one give us a buy signal, and if then is drawn a red cross its talk us about a sell signal, well this is all its really easy to use, any question please ask me to mi email see you! email: despiertatutrader@gmail.com
RSI orbes
MARTIN ANDRES DEL NEGRO
RSI orbes its an remake of the classic RSI indicator, it have the same but show it by a different way, if lvl 30 or lvl70 are crossed the RSI orbs will draw red orbs or blue green orbes,you can create your own strategy configuring the periods, also for sell when the red orbs appear or to buy when the green orbs its drawn, you can use it by your way, any question please ask to me to my email , good luck see you! email: despiertatutrader@gmail.com
Reward Risk Pro Tool
MARTIN ANDRES DEL NEGRO
5 (1)
Reward Risk PRO TOOL, its the ultimate tool for your trading money managment, stop wasting time calculating your reward risk percentaje , just making some clicks you can get your ideal distance for your stop loss, and next to it will get your corresponded Take profit point for your stop loss, for example if you set an 100 ticks stop loss and want to get an equivalent reward just make your next click were the text offers 1/1 reward risk, if you want to get a reward/risk relation more profitly jus
NFP Master
MARTIN ANDRES DEL NEGRO
NFP Master its an scalper EA that trade the NFP monhtly news,here we locate an extraordinary oportunity to make flash money, even if the price rise down or pump up we will get profit anyway, the best part of this Expert Advisor is that we dont need any VPS, just run the EA 10 minutes before the Non Farming Payrolls new gonna be released and let the money comes, just test it on any NFP new that has been released in the past and you will see it works, the performance say it all. Preferly use ECN b
BC Juice MT5
MARTIN ANDRES DEL NEGRO
BC Juice mt5 (ビッグ キャンドル スキャナー) は、ポートフォリオに入れるべき強力なツールです。その最も重要な特徴の 1 つは、85% の確率で市場で「反転」を見つけた場合に成功する可能性が高いことです。 Martin Gale や Grid を使用していません。これは、Heiken Ashi インジケーターによって提供されるトレンドの独占的な確認に加えて、非常に十分に根拠のある実績のある戦略です。 Experts Advisor は、反転の可能性が高い領域に参入しようとしますが、市場の急激で強い動きは、この EA の運用にとって最良の味方であることが確認されています.不安定で不安定な BC Juice mt5 EA は、経済カレンダーの金融ニュース レポートの恩恵を受けており、世界経済の不安定性によって生じる市場の潜在的でつかの間のターンを利用するのに理想的な EA です。 BC Juice mt5 EA のデモをダウンロードして、その見事なパフォーマンスをご自身で確認してください。AUD/USD ペアですぐに使用できる構成が付属しており、最近の最適化はわずか
RSI Rush
MARTIN ANDRES DEL NEGRO
Certainly! Let’s discuss the   RSI Rush , an aggressive momentum indicator that combines weighted moving averages (WMAs) at lows, mid-price, and tight highs. Here are the key components: Weighted Moving Averages (WMAs) : The RSI Rush employs three WMAs: WMA at Lows : Calculated based on the lowest prices during a specific period. WMA at Mid-Price : Considers the average price (midway between highs and lows) during the same period. WMA at Tight Highs : Based on the highest prices during the speci
Keyboard Trader は、 MetaTrader 5 (MT5) で キーボードショートカット を使用して超高速で取引するためのツールです。以下にその特徴の簡潔な説明を示します: 迅速な実行 : Keyboard Traderを使用すると、クリックせずに注文を迅速に実行できます。キーボードショートカットを使用して効率的にポジションを開いたり閉じたりできます。 ニューストレードに最適 : ニュースイベント時に迅速に対応する必要があるため、高いボラティリティの瞬間に取引する際に特に役立ちます。 カスタマイズ可能なホットキー : 最高の部分は、キーボードショートカットを 自分の好みにカスタマイズできる ことです。自分の取引スタイルに合ったアクションを実行するために独自のキーコンビネーションを割り当てることができます。 要するに、Keyboard TraderはMT5で迅速で正確な実行を求めるトレーダーにとって優れたツールです。トレード体験を向上させるためにその潜在能力を活用してください!
フィルタ:
レビューなし
レビューに返信