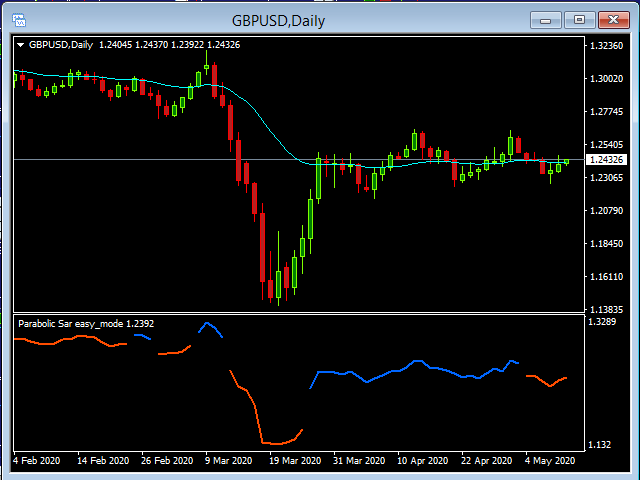
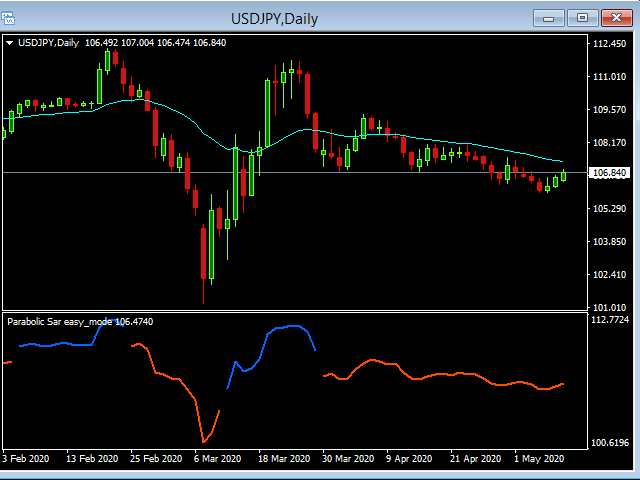
Parabolic Sar easy mode
- インディケータ
- バージョン: 1.0

Parabolic Sar easy mode, remake the original p.sar indicator making it more easy to read for novicians traders and experimented traders looking to
reduce the time analizing the charts, you can make your own strategy modificating the periods and fusioning it with others indicators like
RSI ,stochastic or what you want,its one indicator runs better on high time charts like H4 or D1.