BeST Breakout Strategy MT5

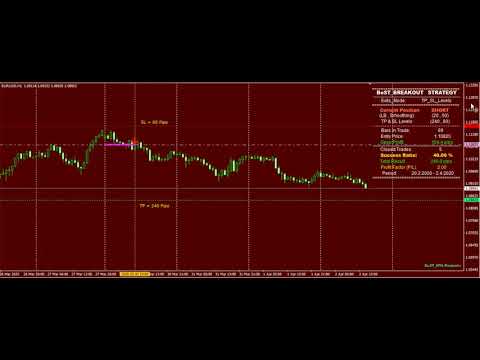
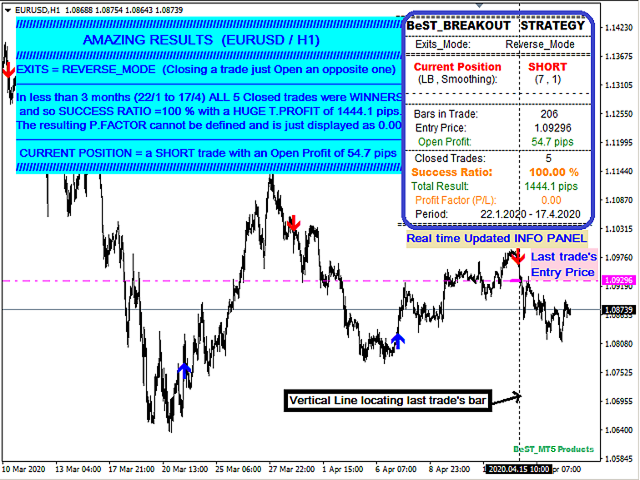
BeST_Breakout Strategy MT5 is an Metatrader Indicator based on a proprietary algorithm implementing a very powerful tool that can exploit every breakout leading to huge market movements.It timely locates the most likely points for Entering the Market as well as the most suitable Exit points and can be used successfully as a standalone Trading System which performance is often accompanied by very impressive statistics of % Success Ratio and Profit Factor

The BeST_Breakout Strategy is a non-repainting and non-backpainting Indicator while using it you can get:

  • Definite Entry and Exit Signals of high winning probability
  • 3 different Exit strategies to select 
  • Draw of the corresponding Breakout Level
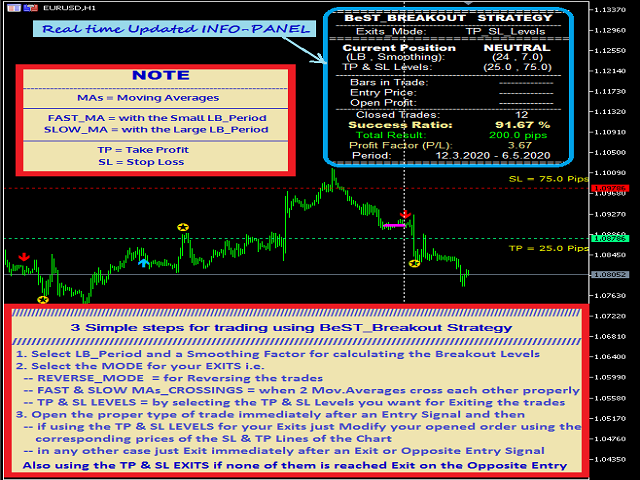
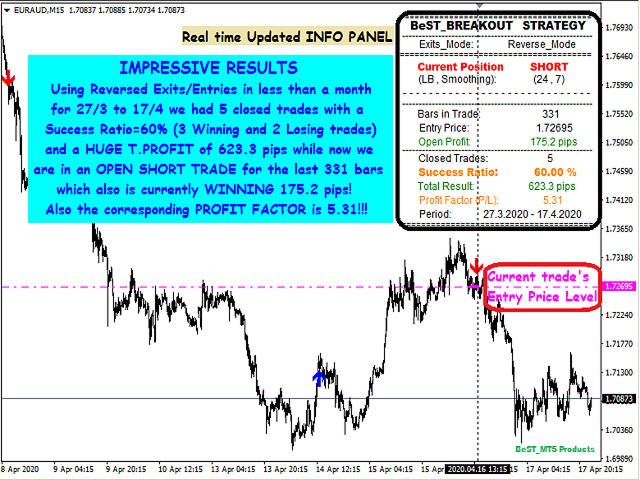
  • A Real Time Updated Info and Statistics Panel 
  • All the MT5 Alerts of the Entry and Exit Signals
  • Fully customizable colors, sizes and distances of all the chart objects


Input parameters

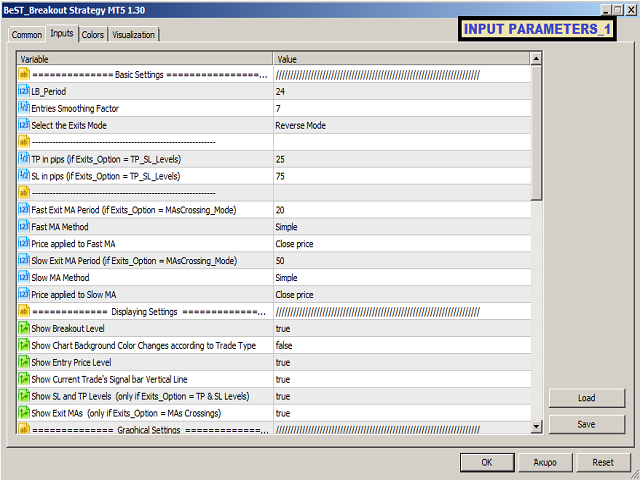
=== Basic Settings - for selecting LB Period for calculating Breakout Levels and Entries Smoothing Factor  for calculating Breakouts’ frequency, Also for selecting the preferable Exits Mode out of:
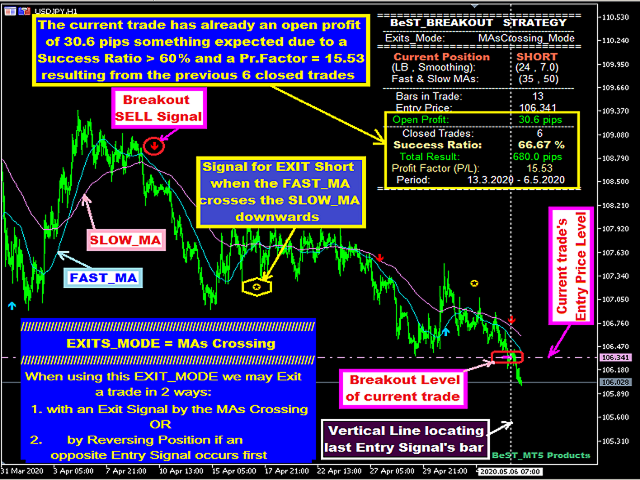
i) Reverse Mode – Exit by Reversing the trade at the opposite Entry Signal ii) Fast & Slow MAs Crossings – Exit when the 2 Mov.Averages intersect and  iii) TP & SL Levels – Exit using the selected TP and SL values in pips. Then after selecting the Exits Mode we can select the corresponding Exit features:

      • TP in pips (if Exits_Option = TP_SL_Levels)
      • SL in pips (if Exits_Option = TP_SL_Levels)
      • Fast Exit MA  Period / Method and Price  (if Exits_Option MAsCrossing_Mode)
      • Slow Exit MA  Period / Method and Price (if Exits_Option = MAsCrossing_Mode)

      === Displaying Settings - for selecting which chart objects and features to show/activate and for selecting the color, size and distances of drawn objects

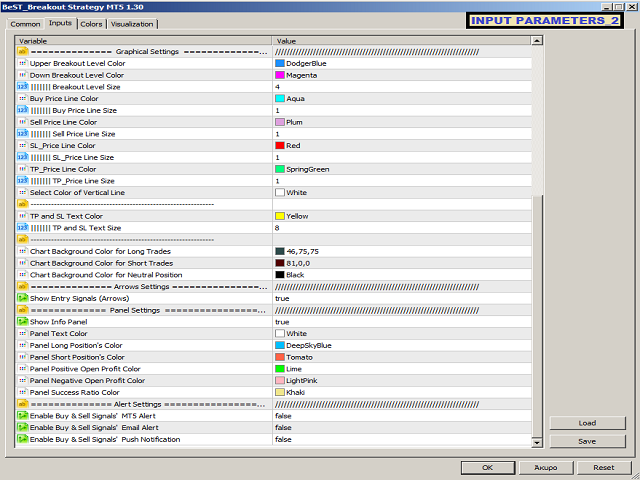
      === Graphical Settings - for selecting the color, size and distances of drawn objects 

      === Arrows Settings – for  controlling  Entry/Exit  arrows’ features

      === Panel Settings – for  selecting to show or not the Info Panel and controlling the colors used for

      === Alert Settings - for controlling the use of Entry and Exit points MT4 alerts


      For EA Developers
      • Buy Arrows and Sell Arrows :                         Buffers = 2,3
      • TP Exit , SL Exit and MAs Exit Signals :         Bufferss = 4,5,6


      おすすめのプロダクト
      This is an original, agile, and excellent trending system. Whether you are a beginner trading novice or a professional trader, this set of indicators can help you quickly and timely track the latest changes in market trends. It has the following characteristics: The method of use is extremely simple, plug and play, and the display of all trend analysis results is clear at a glance; There is no need to configure any functional parameters, the trend tracking indicator will automatically analyze th
      Manyal trading system, CovEchoTrend Robot, focuses on reliability and flexibility. By employing statistical analysis methods to study the relationships between the base indicator and market patterns, the system enables a deeper understanding of market processes. Intelligent pattern analysis: The application of statistical data processing helps identify key trend reversal points more accurately, signaling significant market shifts. Informed decision-making is based on the intersection of indicato
      Strategy Concept: A trend-following strategy designed to capture precise entry points right as market pullbacks come to an end. How it works: Trend Identification: Two moving averages (EMA 34 and 144) display the main market direction. We only trade in the direction of this global trend. Pullback Detection: We wait for the medium RSI (9) line to temporarily move against the trend (crossing the 50 level). Entry Signal: Once the fast RSI (2) confirms short-term overbought/oversold conditions, an
      Trend Wave Analyzer Pro
      AL MOOSAWI ABDULLAH JAFFER BAQER
      Trend Wave Analyzer Pro: Ride the True Market Trend Stop guessing and start seeing the real story behind price movements. Are you tired of lagging indicators that give you signals too late? Do you struggle to distinguish between a minor pullback and a major trend reversal? The Trend Wave Analyzer Pro is the definitive tool designed to give you a clear, decisive, and actionable view of the market's true momentum. For just $30, you can unlock a professional-grade analysis system that will become
      Divergent Stochastic Filter II Catch Reversals Early, Filter Noise, Trade with Confidence The Edge: Why This Stochastic is Different  Every trader knows the Stochastic oscillator. But knowing when to trust its signals, that's the real challenge. The Divergent Stochastic Filter II transforms this classic indicator into a precision reversal detection system by adding critical elements: divergence intelligence, signal filtering and exhaustion detection.  While standard Stochastic oscillators fire s
      OV-VCS_ATR  Trading Rules The OV-VCS_ATR indicator is a popular trend-following technical analysis tool that helps traders identify the current market trend and potential entry/exit points. Below are the general trading rules for using the OV-VCS_ATR indicator: 1. Indicator Overview The OV-VCS_ATR indicator consists of a line plotted on the price chart, which changes color to indicate the trend direction: Green Line:   Indicates an   uptrend   (buy signal). Red Line:   Indicates a   downtrend  
      FREE
      RBreaker Gold Indicatorsは、金先物の短期日内取引戦略であり、トレンドフォローと日内反転の2つの取引手法を組み合わせたものです。トレンド相場での利益を捉えるだけでなく、相場が反転した際には迅速に利確し、その流れに沿ってポジションを反転させることができます。 この戦略は、アメリカの雑誌『Futures Truth』において、15年連続で最も収益性の高い取引戦略トップ10に選ばれた実績を持ち、非常に長いライフサイクルを誇り、現在も国内外で広く使用・研究されています。 本インディケーターは、2026年の金先物の値動きに対応し、14日間のATR指標に基づいて、ブレイクアウト係数A、観察係数B、リバーサル係数Rをより合理的な値で定義しています。非常に優れたインディケーターであり、安定的な年間収益を実現しています。ぜひおすすめします〜
      Market Structure Fractals The structure layer MetaTrader 5 was missing Most traders stare at candles and draw structure manually — imprecisely, inconsistently, and always too late. You know what a fractal high and low look like. The question is whether you can spot every one, mark it cleanly, and track it the moment price breaks through. You can't. Market Structure Fractals can. MetaTrader 5 shows you price. It doesn't show you structure. That gap — between a candle pattern and a confirmed bre
      FREE
      Elite Harmony Signals Pro Panoramica Elite Harmony Signals è un indicatore sofisticato di analisi tecnica che visualizza rettangoli dinamici che forniscono zone di trading chiare e segnali di conferma per decisioni migliorate. Caratteristiche Principali Zone Rettangolo Dinamiche Estensione in Tempo Reale : I rettangoli si estendono automaticamente all'azione corrente del prezzo Chiusura Intelligente : I rettangoli si chiudono solo quando appaiono segnali opposti Conferma Visiva : Zone di trading
      Xtrade Trend Detector is an indicator capable of finding the best opportunities to take a position in any stock market. Indeed, it is a great tool for scalpers but also for Daytraders. You could therefore use it to identify areas to trade, it fits easily on a chart. I use it to detect trends on Big timeframes and take positions on Small timeframes. Don't hesitate to give me a feedback if you test it.
      Trade Visualizer インジケーターは、取引データを視覚化し、MT5チャート上にすべての取引履歴を直接表示します。自分のパフォーマンスを分析する場合も、MQL5のシグナル提供者の取引を研究する場合も、このツールは生データを分かりやすいビジュアルに変換します。各トレードはエントリーとエグジットの矢印、接続ライン、価格・利益・ロット数・pipsなどのツールチップで示されます。 注: インジケーターをダウンロードした方は、メールアドレスを添えてご連絡ください。 Trade Visualizer Template を無料でお送りします。 特徴: • 最新版 ProTrading Analytics Excel Template v1.7 と完全連携。 • 複数トレーダー・戦略を同一銘柄上で比較可能。 • 売買ごとの色・線のスタイル・矢印サイズを自由に設定。 • CSVとブローカーのGMT差を自動調整。 • 複数ブローカーのシンボル接尾辞に対応。 • 戦略ロジックやエントリー精度の可視分析に最適。
      FREE
      Delta Divergence •         Real-Time Market Conviction Tracking — Measures cumulative delta to reveal whether buyers or sellers are truly in control, cutting through price noise to show actual order flow dominance. •         Multi-Timeframe Confluence (30M / H1 / H4 / D1) — Validates lower timeframe signals against higher timeframe trends. When all timeframes align, confidence in the trade is significantly higher. •         Session Strength Percentage — Quantifies how far current delta has pulle
      # RSI Pro Alert - Advanced RSI Indicator A powerful professional-grade RSI indicator with intelligent alerts, scheduled snapshots, and multi-dimensional notifications to help you capture market opportunities with precision! --- ## Key Features ### Smart Signal Detection - **Precision Cross Detection** : Automatically identifies critical moments when RSI crosses overbought/oversold levels - **State Tracking Mechanism** : Real-time monitoring of market state changes (Overbought/Overso
      Based on the Dow Theory, the system automatically draws a turning point, which is the starting point for buying or selling. It also automatically tells you whether the market is in a buying or selling condition and recognizes the environment. It is also a good tool to prevent false trades and to make profitable trades. We are live-streaming the actual operation of the system. Please check for yourself if it is usable. Please check it out for yourself. https://www.youtube.com/@ganesha_forex We
      Non-proprietary study of Joe Dinapoli used for trend analysis. The indicator gives trend signals when the fast line penetrates the slow line. These signals remain intact until another penetration occurs. The signal is confirmed at the close of the period. It is applicable for all timeframes.   Inputs lnpPeriod: Period of moving average. lnpSmoothK: %K period. lnpSmoothD: %D period.                                    ********************************************************************************
      FREE
      The Martinware Manual Trading Helper indicator is aimed at helping people start their lives in manual trading. It can be used to display both some generic images at the right side of the graph, where custom operational remarks may be displayed or just a blank rectangle hiding the chart while backtesting. Moreover, it can periodically play a list of sounds. To show a blank rectangle, let the first image name input field empty and select the desired color. To show one or more custom images inste
      FREE
      Kagi Chart MT5
      Mohammad Taher Halimi Tabrizi
      KagiChart for MetaTrader 5 Introduction KagiChart is a time-independent charting indicator designed for MetaTrader 5. It renders Kagi lines directly on the chart window, focusing on price movement and reversal structure rather than time-based candles. What is a Kagi Chart Kagi is a charting method that represents price movement without using fixed time intervals. Instead of plotting candles at regular time steps, the chart changes direction only when price reverses by a defined amount. The chart
      Exclusive Arrival: Presenting for the First Time . This is your secret weapon for predicting which way the wind will blow with the next market shift. It assists you in developing your trading strategy by predicting the direction of the next candle.  Compatible with forex, stocks, and cryptocurrencies on all timeframes, but higher timeframes are recommended. MT4 Version -  https://www.mql5.com/en/market/product/108931/ How does it work ? It's pretty neat. The algorithm separates green and red ca
      タートルズインジケーター(アラート付き)。ブレイクアウトを取引せよ。シグナルを一つも見逃すな。 市場は待ってくれない。価格が新しい領域へブレイクアウトした瞬間、あなたはそれを知り、行動しなければならない。このインジケーターは、他人の意見ではなく価格そのものを追うトレーダーのために設計されています。 クラシックなタートル・トレーディング・システムのルールに従っていても、他のブレイクアウト系のアプローチを使っていても、このインジケーターは重要なレベルをチャート上に直接描画し、市場がシグナルを発したその瞬間にあなたへ通知します。憶測は不要。長時間の画面監視も不要。本当に重要な瞬間に、ルールに基づいた明確なシグナルだけが届きます。 規律を保ちたいシステムトレーダーのために設計 ブレイクアウトトレーダーの最大の敵は、悪い相場ではなく感情です。注意が散漫になってエントリーを逃す。「価格が戻ってくる」という感覚で損失トレードを持ち続ける。ドローダウンに不安を感じて早すぎる決済をする。 このインジケーターはそのすべてを排除します。いつエントリーすべきか、そしていつ市場がトレードの終了を示しているかを正
      The First Dawn indicator uses a unique mechanism to search and plot signals. This keeps searching for signals, making it a great indicator for scaping and identification of changes in direction, swing trading and trend trading. The    First Dawn     helps you get early signals. The backtest gives the true picture of how the indicator works with real/demo accounts. Although this is a tiny indicator it is packed with advantageous settings that will help you whether you desire to: Snap the Peaks a
      Engulfing with EMAs Indicator Unlock the power of advanced candlestick pattern detection with the Engulfing with EMAs Indicator , a cutting-edge tool designed for MetaTrader 5. This futuristic indicator combines the precision of engulfing pattern analysis with the trend-following strength of Exponential Moving Averages (EMA 21 and EMA 50), empowering traders to identify high-probability setups across all currency pairs and timeframes. Key Features: Comprehensive Engulfing Detection : Detects b
      Limited-time free initial release. Squeeze Momentum Breakout Signals MT5 is free while MetaCoderStore collects real trader feedback. Please leave a comment with requests, issues, settings ideas, or premium-version features you want considered. Squeeze Momentum Breakout Signals MT5 detects volatility compression with Bollinger Bands inside Keltner Channels, then highlights bullish or bearish release bars when momentum expands after the squeeze. Use cases Find markets moving from quiet compression
      FREE
      Key Features Visual Risk/Reward Planning Spawns interactive rectangles on the chart for Buy and Sell setups. Pink Box:   Represents your Risk (Entry to Stop Loss). Green Box:   Represents your Reward (Entry to Take Profit). The Green box automatically adjusts its size based on your preferred Reward Ratio (e.g., 1:2). Auto-Lot Calculation Automatically calculates the correct   Lot Size   based on your Account Balance and defined Risk Percentage. Takes into account the symbol's Tick Value and Cont
      Caicai L&S Yield Histogram Important Notice: This indicator is an integral tool of the automated EA Caicai Long and Short Pair Trading . This indicator visually displays the percentage deviation (Yield %) of a pair's current spread relative to its own historical mean. It is an excellent tool for quickly visualizing the gross financial potential of a market distortion in Long & Short operations. Main Features: Percentage Visualization: Understand the size of the distortion in palpable percentage
      Sinus wave  indicator is a extra ordinary oscillator.to find divergency.for mt5 it works all pairs and all timeframes. suitable for experienced and beginner traders.. indicator works on toward of the prices... while sinus wave go up side that means prices will up. and while sinus wave go down that means prices is going down. it gives divegency when trend reversals. there is wave to set default 500. on pictures divergency lines and letters has been drawn by hand.to explain how it works.
      Smash FX System — Inside-Bar Breakouts, Reversals & Continuations (Indicator) Tagline: Smash the noise, catch the clear moves — high-clarity inside-bar breakout, reversal and continuation arrows designed for clean entries and professional journaling. Short promo  Smash FX System pinpoints high-probability inside-bar breakouts, smart reversals and continuation setups with on-chart arrows and exact levels — built for traders who want clear, repeatable setups and perfect order-management handoffs f
      Non-proprietary study of Joe Dinapoli used for trend analysis. The indicator gives trend signals when the fast line penetrates the slow line. These signals remain intact until another penetration occurs. The signal is confirmed at the close of the period. It is applicable for all timeframes.   Parameters Fast EMA: period of the fast moving average. Slow EMA: period of the slow moving average. Signal EMA: period of the signal line.                              ************************************
      FREE
      Stochastic MTF Dashboard
      Andres Felipe Carvajal Rodriguez
      4.67 (3)
      Stochastic MTF Dashboard(ストキャスティクス・マルチタイムフレーム・ダッシュボード) Stochastic MTF Dashboard は、トレードの効率化を追求して設計された視覚的ソリューションです。現在のチャートを切り替えることなく、最大 6つの異なる時間足 のストキャスティクス状態を同時にモニタリングできます。 このツールの目的は、分析の混乱を排除し、市場の勢いを瞬時に読み取ることです。 赤:買われすぎゾーン — 価格上昇の限界(売りの検討)。 緑:売られすぎゾーン — 価格回復の可能性(買いの検討)。 グレー:ニュートラルゾーン — 中間圏内での推移。 このダッシュボードが選ばれる理由 マルチタイムフレームの明瞭性: 5分足(M5)から日足までを1つのパネルに表示。数秒で上位足のトレンドを把握するのに最適です。 超高速な状況判断: 複雑なラインの交差を読み解く必要はありません。色と数値によって、市場の正確なゾーンを即座に判断できます。 エントリーの根拠を強化: トレンドに逆らったトレードを防止します。下位足でのエントリーが、上位足の相場心理と一致している
      FREE
      • Please test the product in the Strategy Tester before purchasing to understand how it works. • If you face any issues, contact me via private message—I’m always available to help. • After purchase, send me a screenshot of your order to receive a   FREE EA   as a gift. Dragon State Indicator is a powerful trading tool designed to empower traders by giving them the foundation to optimize it further. This indicator is not optimized, making it a perfect choice for traders who love to tweak and cu
      このプロダクトを購入した人は以下も購入しています
      Neuro Poseidon is a new indicator by Daria Rezueva. It combines precise trading signals with adaptive TP/SL levels - creating best possible trades as a result! Message me and get  Neuro Poseidon Assistant  as a gift to automize your trading process! What makes it stand out? 1. Proven profitability on all assets and timeframes 2. Only confirmed BUY and SELL signals present on the chart 3. Adaptive TP & SL levels generated by the software for each trade 4. Easy to understand - suitable for al
      SuperScalp Pro
      Van Minh Nguyen
      4.65 (26)
      SuperScalp Pro – 高度なマルチフィルタースキャルピングインジケーターシステム SuperScalp Pro は、クラシックな Supertrend と複数のインテリジェント確認フィルターを組み合わせた高度なスキャルピングインジケーターです。M1 から H4 まで複数の時間足で効率的に動作し、XAUUSD、BTCUSD、主要 Forex 通貨ペア向けに最適化されています。 このインジケーターは明確な Buy / Sell シグナルを提供し、ATR に基づいてエントリー価格、Stop Loss、Take Profit を自動計算します。Fibonacci Take Profit 機能により、重要な価格帯で早期決済し、到達時に通知を送信します。 初期設定では Fibonacci Take Profit が有効化されており、より安定した取引体験を重視しています。チャートに適用するだけですぐ利用可能です。上級者向けに、すべてのパラメータは自由にカスタマイズできます。 完全なドキュメントは製品ブログにあります: [User Guide] SuperScalp Pro Auto T
      このインジケーターを購入された方には、以下の特典を 無料 で提供しています: 各トレードを自動で管理し、ストップロスとテイクプロフィットを設定し、戦略ルールに基づいてポジションを決済する補助ツール 「Bomber Utility」 様々な銘柄に合わせたインジケーターの設定ファイル(セットファイル) 「最小リスク」、「バランスリスク」、「待機戦略」 の3つのモードで使用できる Bomber Utility 用の設定ファイル このトレーディング戦略をすぐに導入・設定・開始できる ステップバイステップのビデオマニュアル ご注意: 上記の特典を受け取るには、MQL5のプライベートメッセージシステムを通じて販売者にご連絡ください。 オリジナルのカスタムインジケーター 「Divergence Bomber(ダイバージェンス・ボンバー)」 をご紹介します。これは、MACDのダイバージェンス(乖離)戦略に基づいた 「オールインワン」型のトレーディングシステム です。 このテクニカルインジケーターの主な目的は、価格とMACDインジケーターの間に発生するダイバージェンスを検出 し、将来の価格の動きを示す
      Entry In The Zone and SMC Multi Timeframe is a real-time 2-in-1 market analysis tool that combines market structure analysis and a No Repaint BUY / SELL signal system into a single indicator, built on Smart Money Concepts (SMC) — a widely adopted framework used by professional traders to understand market structure. This indicator helps you see the market more clearly, make decisions based on structure rather than guesswork, and focus on high-probability zones where price is more likely to react
      まず正直に言いましょう。 どんなインジケーターも、それ単体であなたを利益化させることはできません。もしそう言う人がいるなら、それは夢を売っているだけです。完璧な売買シグナル(矢印)を表示するインジケーターは、いくらでも“完璧に見せる”ことができます。正しい過去の区間を拡大して、勝ちトレードだけを切り取ればいいだけです。私たちはそれをしません。 SMC Intraday Formula はツールです。 市場構造を読み取り、最も高い確率の価格ゾーンを特定し、今この瞬間のスマートマネーの痕跡をシンプルな言葉で正確に示します。最終判断はあなたが行います。トレードを実行するのもあなたです。しかし今は「希望」ではなく「精度」でエントリーできます。 私たちはこのインジケーターを、ゴールド(XAUUSD)および主要FX通貨ペアで約3年間、日々のスキャルピングに使用してきました。M1、M5、M15、M30の主要ツールです。これは未来を予測しようとするのではなく、今まさに形成されている高確率セットアップを示し、その理由を説明します。 他のすべてのインジケーターと何が違うのか? ほとんどのトレーディングイ
      この製品は 2026 年の市場向けに更新され、最新の MT5 ビルドに最適化されています。 価格更新のお知らせ: Smart Trend Trading System は現在 $99 で提供されています。 次の 30 件の購入 後、価格は $199 に上がります。 特別オファー: Smart Trend Trading System を購入後、私にプライベートメッセージを送ることで、 Smart Universal EA を無料 で受け取り、Smart Trend のシグナルを自動売買に変えることができます。 Smart Trend Trading System は、リペイントなし、再描画なし、遅延なしの完全なトレーディングシステムです。よりクリーンなシグナル、より明確なトレンド方向、そしてより整理された取引方法を求めるトレーダー向けに作られています。 Online course , manual and download presets . このシステムは、トレンド検出、反転ゾーン、Smart Cloud、トレーリングストップロジック、サポートとレジスタンス、ローソク足の色分け、ア
      Power Candles V3 - 自己最適化型強弱インジケーター Power Candles V3は 、通貨や銘柄の強さを、適用されたすべてのチャート上で実行可能なトレードプランに変換します。単にローソク足を色分けするだけでなく、バックグラウンドでリアルタイムの自動最適化を実行し、目の前の銘柄に対して最適なストップロス、テイクプロフィット、およびシグナルの閾値を提示します。ワンクリックで実取引に適用でき、エントリーポイント、ストップロス、テイクプロフィットのラインが正確な価格位置にチャート上に表示され、方向性を示すアラートがリアルタイムで発動します。 このツールは、Stein Investmentsのエコシステムの一部です。  18種類以上のツールをすべて閲覧し、AIを活用したセットアップの推奨事項を入手し、  https://stein.investments でコミュニティに参加しましょう クローズしたバーごとに3,000回以上のトレードシミュレーション。9つの強さの状態。2つの戦略を並行してテスト。勝率の高い設定をワンクリックで適用。 なぜこれが必要なのか ほとんどの強
      SignalTech is an unique fully rule based trading system delivers an Institutional approach for both Independent Traders and Prop Firm Challengers. Never Repaint. Push Notification available. No over-optimization. All the winning trades with chart setups are published on the comments page. 2026-05 4107 Pips (Until 05-29 NY Closed) 2026-04 2243 Pips 2026-03 2165 Pips 2026-02 2937 Pips 2026-01 2624 Pips 2025-12 1174 Pips It can generate signals with Buy/Sell Arrows, Push Notification (To Mobile) an
      PrimeScalping is a powerful trading companion designed to generate high-probability entry signals with dynamic TP/SL/DP levels based on volatility. Built-in performance tracking shows win/loss stats, PP1/PP2 hits, and success rates — all updated live. Key Features: Buy/Sell signals with adaptive volatility bands Real-time TP/SL/DP levels based on ATR Built-in MA Filter with optional ATR/StdDev volatility Performance stats panel (Success, Profit/Loss, PP1/PP2) Alerts via popup, sound, push, or e
      Quantum TrendPulse を ご紹介します。これは、   SuperTrend   、   RSI   、および Stochastic のパワーを 1 つの包括的なインジケーターに組み合わせて、取引の可能性を最大限に引き出す究極の取引ツールです。精度と効率を求めるトレーダー向けに設計されたこのインジケーターは、市場のトレンド、勢いの変化、最適なエントリー ポイントとエグジット ポイントを自信を持って特定するのに役立ちます。 主な特徴: SuperTrend 統合: 現在の市場動向に簡単に追従し、収益性の波に乗ることができます。 RSI精度: 買われすぎと売られすぎのレベルを検出し、市場の反転のタイミングに最適で、SuperTrendのフィルターとして使用されます。 確率的精度: 確率的振動を活用して、変動の激しい市場で隠れたチャンスを見つけます。SuperTrend のフィルターとして使用されます。 マルチタイムフレーム分析:   M5 から H1 または H4 まで、さまざまなタイムフレームで市場を常に把握します。 カスタマイズ可能なアラート: カスタム取引条件が満たされ
      トレンドキャッチャーインジケーター トレンドキャッチャーインジケーターは、開発者独自の適応型トレンド分析指標を組み合わせることで、市場価格の動きを分析します。短期的なノイズを除去し、根底にあるモメンタムの強さ、ボラティリティの拡大、価格構造の挙動に焦点を当てることで、真の市場方向性を特定します。また、移動平均線、RSI、ボラティリティフィルターなどの平滑化およびトレンドフィルタリング機能を備えたカスタマイズ指標も使用します。 実際の運用状況のモニタリングやその他の製品については、こちらをご覧ください: https://www.mql5.com/en/users/mechanic/seller ご注意ください。私はTelegramでEAや設定を販売していません。詐欺です。すべての設定はブログで無料で公開しています。 重要!ご購入後すぐにご連絡ください。手順とボーナスをお送りします!
      ご紹介     Quantum Breakout PRO は 、ブレイクアウト ゾーンの取引方法を変革する画期的な MQL5 インジケーターです。 13年以上の取引経験を持つ経験豊富なトレーダーのチームによって開発されました。     クォンタム ブレイクアウト プロ   は、革新的でダイナミックなブレイクアウト ゾーン戦略により、あなたのトレーディングの旅を新たな高みに押し上げるように設計されています。 クォンタム ブレイクアウト インジケーターは、5 つの利益ターゲット ゾーンを備えたブレイクアウト ゾーン上のシグナル矢印と、ブレイクアウト ボックスに基づいたストップロスの提案を提供します。 初心者トレーダーにもプロのトレーダーにも適しています。 量子EAチャネル:       ここをクリック 重要!購入後、インストールマニュアルを受け取るためにプライベートメッセージを送ってください。 推奨事項: 時間枠: M15 通貨ペア: GBPJPY、EURJPY、USDJPY、NZDUSD、XAUUSD アカウントの種類: ECN、Raw、またはスプレッドが非常に低い R
      Gann Made Easy   は、ミスター・ギャンの理論を使用した取引の最良の原則に基づいた、プロフェッショナルで使いやすい外国為替取引システムです。 W・D・ガン。このインジケーターは、ストップロスとテイクプロフィットレベルを含む正確な買いと売りのシグナルを提供します。 PUSH通知を利用して外出先でも取引可能です。 ご購入後、取引方法の説明と優れた追加インジケーターを無料で入手するには、私にご連絡ください! おそらく、ギャンの取引手法についてはすでに何度も聞いたことがあるでしょう。通常、ギャンの理論は初心者のトレーダーだけでなく、すでにある程度の取引経験がある人にとっても非常に複雑なものです。なぜなら、ギャンの取引手法は理論的にはそれほど簡単に適用できるものではないからです。私はその知識を磨き、最良の原則を私の外国為替インジケーターに組み込むために数年を費やしました。 このインジケーターは非常に簡単に適用できます。必要なのは、それをチャートに添付し、簡単な取引推奨事項に従うだけです。このインジケーターは常に市場分析の仕事を行い、取引の機会を探します。適切なエントリーポイントを検
      FX Trend NG:次世代マルチマーケット・トレンドインテリジェンス 概要 FX Trend NG は、複数の時間足に対応したプロフェッショナル向けトレンド分析およびマーケット監視ツールです。 市場全体の構造を数秒で把握することができます。 複数のチャートを切り替える必要はありません。どの銘柄がトレンド中なのか、どこでモメンタムが弱まっているのか、そしてどの時間足で強い整合性があるのかを瞬時に確認できます。 ローンチ特別オファー – FX Trend NG を $30(6ヶ月) または $80 永久ライセンス でご利用いただけます。 すでに Stein Investments のユーザーですか? -> メッセージを送信 して、プライベートグループへアクセスしてください。 セットアップや詳細情報が必要ですか? -> Stein Investments 公式ページ をご覧ください。 1. FX Trend NG が他と異なる理由 3ステート・トレンドロジック ― Buy と Sell だけではない • 多くのインジケーターは Buy または Sell の2状態のみを表示します。
      M1 Quantum は、M1専用のプロフェッショナルトレーディングシステムであり、ストップロス、テイクプロフィット、スマートな資金管理を内蔵した、迅速かつ正確な取引シグナルを提供します。 M1 Quantum は、 連続勝利 に重点を置いて口座を素早く成長させるために設計されたプロフェッショナルな資金管理を備えています。 M1 Quantum インジケーター の主な特徴 M1時間足 およびすべての 主要通貨ペア 向けに設計 すべての取引にストップロスとテイクプロフィットを設定 資金管理 を実装し、トレーダーが簡単に取引できるようサポート 高い勝率と高い 連続勝利 リペイントなし、遅延なし あらゆるトレーダーにとって理解しやすい M1 Quantum を使用するには、 M1 Quantum Assistant が必要です。この強力なツールは、M1 Quantum をご購入いただいたすべてのお客様に 無料 で提供されています。 M1 Quantum Assistant をダウンロード 私のMQL5 チャンネルに参加して、最新のアップデートや新製品のリリース情報を入手してください。 価格は
      Reversion King Indicator
      Eugen-alexandru Zibileanu
      5 (4)
      新たな王者が登場 - インジケーター + 注文管理表示(TP1 + TP2 + TP3)+ オプションのTelegramシグナル送信機能付き(無料) (完全なトレード&シグナルシステム) ゴールド向け最高のEA: Gold Slayer このインジケーターには、高度な戦略、カスタマイズ可能な注文管理システム、そしてエンベロープ拡張を組み合わせた平均回帰システムが搭載されています。さらに、RSIなど複数のインテリジェントな確認フィルターによって、高確率の反転エントリーをBUY・SELLシグナルとして検出します。 単にトレードを学ぶだけでなく、複数ポジションを効果的に管理し、過去に利益を出しているオープンポジションで損失トレードをカバーする方法も学べます。 M5向けに構築・最適化されており、流動性が高くシグナルの精度が安定しているBTCUSDとXAUUSDで優れたパフォーマンスを発揮します。 このインジケーターは、ATRを基に自動計算されたエントリー、ストップロス、テイクプロフィットレベルを備えた明確なLong・Shortシグナルを提供するため、リスク管理が最初から組み込まれています。 マ
      Meridian Pro
      Ottaviano De Cicco
      5 (2)
      Meridian Pro 2.00:MT5向けプロ仕様マルチタイムフレーム・トレンドマトリクス Meridian Pro 2.00 は、MetaTrader 5 向けのプロ仕様の適応型トレンドマトリクスです。オリジナルの Meridian トレンドエンジン、クリーンなチャート ribbon、確定足ベースのシグナル矢印、8時間足 dashboard、Fuel momentum、weighted consensus、synthetic HTF processing、そしてチャート上に直接表示される上位足コンテキストラインを統合します。 目的はシンプルです。現在のトレンド、マルチタイムフレーム構造、強度、momentum、EA-ready 状態を、複数チャートに無関係なインジケータを重ねるのではなく、1つの整理された workflow で読むことです。 Meridian Pro の違い 1つの適応型エンジン - 同じ volatility-aware Meridian ロジックを M1 から W1 まで適用します。 Synthetic HTF architecture - 上位足行は下位足デ
      この製品は 2026 年の市場向けに更新され、最新の MT5 ビルドに最適化されています。 価格更新のお知らせ: Atomic Analyst は現在 $99 で提供されています。 次の 30 件の購入 後、価格は $199 に上がります。 特別オファー: Atomic Analyst を購入後、私にプライベートメッセージを送ることで、 Smart Universal EA を無料 で受け取り、Atomic Analyst のシグナルを自動売買に変えることができます。 Atomic Analyst は、リペイントなし、再描画なし、遅延なしの Price Action トレーディングインジケーターで、手動取引、シグナルの明確化、EA 自動化のために設計されています。 User manual: settings, inputs and strategy. 価格行動、強さ、モメンタム、マルチタイムフレーム方向、高度なフィルターを分析し、トレーダーがノイズを減らし、弱いセットアップを避け、より構造化された取引判断を行えるようにします。 このインジケーターは、複雑な市場計算をシンプルな視覚シ
      SmartScalping is a powerful trading companion designed to generate high-probability entry signals with dynamic TP/SL/DP levels based on volatility. Built-in performance tracking shows win/loss stats, PP1/PP2 hits, and success rates — all updated live. Key Features: Buy/Sell signals with adaptive volatility bands Real-time TP/SL/DP levels based on ATR Built-in MA Filter with optional ATR/StdDev volatility Performance stats panel (Success, Profit/Loss, PP1/PP2) Alerts via popup, sound, push, or e
      ARIPoint
      Temirlan Kdyrkhan
      1 (1)
      ARIPoint is a powerful trading companion designed to generate high-probability entry signals with dynamic TP/SL/DP levels based on volatility. Built-in performance tracking shows win/loss stats, PP1/PP2 hits, and success rates all updated live. Key Features: Buy/Sell signals with adaptive volatility bands Real-time TP/SL/DP levels based on ATR Built-in MA Filter with optional ATR/StdDev volatility Performance stats panel (Success, Profit/Loss, PP1/PP2) Alerts via popup, sound, push, or email Cu
      この製品は 2026 年の市場向けに更新され、最新の MT5 ビルドに最適化されています。 価格更新のお知らせ: Smart Price Action Concepts は現在 $200 で提供されています。 次の 30 件の購入 後、価格は $299 に上がります。 特別オファー: 購入後、私にプライベートメッセージを送ることで、 無料ボーナス + ギフト を受け取ることができます。 まず、このトレーディングツールはリペイントなし、再描画なし、遅延なしのインジケーターであり、プロフェッショナルな取引に最適であることを強調しておきます。 Online course , and manual Smart Price Action Concepts Indicator は、初心者から経験豊富なトレーダーまで使える非常に強力なツールです。20 種類以上の便利なインジケーターを 1 つにまとめ、Inner Circle Trader Analysis や Smart Money Concepts Trading Strategies などの高度な取引アイデアを組み合わせています。このインジケ
      MasterTrend Indicator for MT5 A powerful trend-following and signal-evaluation tool MasterTrend   is a custom MT5 indicator that combines Moving Averages and ATR-based risk/reward logic to generate clear buy/sell signals. It visualizes dynamic SL/TP levels, evaluates past trade outcomes, and displays win/loss statistics in a clean on-chart panel. Key features include: Buy/Sell signals based on MA crossovers ATR-based SL/TP1/TP2/TP3 levels with visual lines and labels Signal outcome tracking wit
      M30/H1/H4スイング版もあります M5/M15では取りきれない大きな波を狙いたい方へ。 Gold Signal Swing Pro(M30/H1/H4対応)を販売中。 1トレードで$20〜$80+の値幅を狙う。 https://www.mql5.com/en/market/product/177643 KURAMA GOLD SIGNAL PRO(MT5版)— 7層フィルター搭載 XAUUSD完全トレードシステム リペイントなし。リドローなし。ラグなし。すべてのサインは確定後に変わりません。 購入者限定特典:買い切りライセンスをご購入いただいた方に、AI Zone Radar($59相当)+PDFマニュアルを無料プレゼント。購入後にMQL5でメッセージをお送りください。 AI Zone Radar: https://www.mql5.com/en/market/product/175834 ゴールドトレーダーのコミュニティで実際に使用され、精度と使いやすさで高評価。 あなたの問題
      Azimuth Pro
      Ottaviano De Cicco
      5 (7)
      Azimuth Pro V2:MT5向けシンセティック・フラクタル構造分析と確認済みエントリー 概要 Azimuth Pro は Merkava Labs によるマルチレベルスイング構造インジケーターです。4つのネストされたスイングレイヤー、スイングアンカーVWAP、ABCパターン検出、3タイムフレーム構造フィルタリング、そして確定バーでの確認済みエントリー — 1つのチャートで、ミクロスイングからマクロサイクルまでを網羅するワークフロー。 これはブラインドシグナル製品ではありません。ロケーション、コンテキスト、タイミングを重視するトレーダーのための構造ファーストワークフローです。 V2発売記念オファー — Azimuth Pro V2をUSD 399で(次の100本)。最終価格:USD 499。 1. V2での変更点 シンセティック・マルチタイムフレームエンジン 上位タイムフレーム分析をMeridian Proと同じ独自のシンセティックアーキテクチャで一から再構築。よりクリーンなHTFコンテキスト、安定したライブ動作、従来のMTF同期問題なし。シンセティックエンジンは 固定比率タ
      RelicusRoad Pro: 定量的市場オペレーティングシステム 【期間限定】無制限アクセス 70% OFF - 2,000人超のトレーダーと共に なぜ多くのトレーダーは「完璧な」インジケーターを使っても失敗するのでしょうか? それは、文脈を無視して 単一の概念 だけでトレードしているからです。文脈のないシグナルは単なるギャンブルです。勝ち続けるには、 根拠の重なり(コンフルエンス) が必要です。 RelicusRoad Proは単なる矢印インジケーターではありません。完全な 定量的市場エコシステム です。独自のボラティリティモデリングを用いて、価格が推移する「適正価値の道(Fair Value Road)」をマッピングし、ノイズと真の構造的ブレイクを判別します。 推測はやめましょう。機関投資家レベルの「ロード・ロジック」でトレードを。 コアエンジン:「Road」アルゴリズム システムの中心となる Road Algo は、市場環境にリアルタイムで適応するダイナミックなボラティリティチャネルです。 安全ライン(平衡点) と、価格が数学的に反転しやすい 拡張レベル を投影します。 Si
      ScalpPoint is a powerful trading companion designed to generate high-probability entry signals with dynamic TP/SL/DP levels based on volatility. Built-in performance tracking shows win/loss stats, PP1/PP2 hits, and success rates — all updated live. Key Features: Buy/Sell signals with adaptive volatility bands Real-time TP/SL/DP levels based on ATR Built-in MA Filter with optional ATR/StdDev volatility Performance stats panel (Success, Profit/Loss, PP1/PP2) Alerts via popup, sound, push, or emai
      Crystal Heikin Ashi Signals - Professional Trend & Signal Detection Indicator Advanced Heikin Ashi Visualization with Intelligent Signal System for Manual & Automated Trading Final Price: $149 ---------> Price goes up $10 after every 10 sales . Limited slots available — act fast . Overview Crystal Heikin Ashi Signals is a professional-grade MetaTrader 5 indicator that combines pure Heikin Ashi candle visualization with an advanced momentum-shift detection system. Designed for both manual traders
      FX Power: 通貨の強弱を分析して、より賢い取引を実現 概要 FX Power は主要通貨と金の実際の強弱をあらゆる市場状況で理解するための必須ツールです。強い通貨を買い、弱い通貨を売ることで、 FX Power は取引の意思決定を簡素化し、高い確率の取引機会を見出します。トレンドを追従する場合でも、極端なデルタ値を使用して反転を予測する場合でも、このツールはあなたの取引スタイルに完全に適応します。ただ取引するだけではなく、 FX Power で賢く取引をしましょう。 1. なぜ FX Power がトレーダーにとって非常に有益なのか 通貨と金のリアルタイム強弱分析 • FX Power は主要通貨と金の相対的な強弱を計算し、マーケットダイナミクスに関する明確な洞察を提供します。 • どの資産がリードしているか、または後れを取っているかを監視して、取引するペアを賢く選びましょう。 マルチタイムフレームの包括的なビュー • 短期、中期、長期のタイムフレームで通貨と金の強弱を追跡し、マーケットトレンドに基づいて取引戦略を調整できます。 • スキャルピングからスイングトレード
      メタトレンドプロ   これは、トレードにおける推測を排除し、市場が既に決定を下したポイントを示すトレンドフォローツールです。この指標は、トレンド、動向、構造が変化する重要なポイントを特定し、主要プレーヤーがポジションを取るべき価格の戻り領域を強調表示します。 単に値動きを見るだけでなく、その背後にある論理を理解できます。すべてのシグナルはローソク足が確定した後に記録され、再描画されることなくチャートに保存されるため、自信を持って状況を分析し、意思決定を行うことができます。トレード目標(利益確定)も表示されます。 この指標の有効性について完全に確信を持っていただくために、自動統計機能をご利用いただけます。 方向転換のたびに、インジケーターはストップロスレベルとそのインテリジェントな段階的移動(Move SL)も表示します。これは非常に重要です。     削減   リスク   ポジション別。 損切り/利益確定/リスクリワード 右側の内蔵パネルには、現在の世界的なトレンドの方向における市場参入ポイントが表示され、過去のデータからもこれらのシグナルが確認できます。 任意の時間枠/ツール この指
      マーケットメーカーのためのツール。 Meravith は次の機能を提供します: すべての時間足を分析し、現在有効なトレンドを表示します。 強気と弱気の出来高が等しくなる流動性ゾーン(出来高均衡)を強調表示します。 異なる時間足のすべての流動性レベルをチャート上に直接表示します。 テキスト形式の市場分析を生成し、参考情報として表示します。 現在のトレンドに基づいて目標値、サポートレベル、ストップロスを計算します。 取引のリスクリワード比を算出します。 口座残高に基づいてポジションサイズを計算し、潜在的な利益を推定します。 また、市場に大きな変化があった場合には警告を表示します。 インジケーターの主要ライン: 強気/弱気の出来高エグゾーストライン ― 目標値として機能します。 市場のトレンドを示すライン。市場が強気か弱気かによって色が変わり、トレンドのサポートとして機能します。主にその色が市場センチメントを示します。 出来高均衡ライン(Eq)。Eq(Volume Equilibrium)ラインはシステムの中核です。これは買い手と売り手の出来高のバランスポイントを表します。市場の流動性を示し
      作者のその他のプロダクト
      BeST_123 Strategy is clearly based on the 123_Pattern which is a frequent Reversal Chart Pattern of a very high Success Ratio . It occurs at the end of trends and swings and it’s a serious indication of high probability for a change in trend. Theoretically an 123_pattern is valid when the price closes beyond the level of #2 local top/bottom, a moment when the indicator draws an Entry Arrow,  raises an Alert and a corresponding Position can be opened. The BeST 123_Strategy Indicator is non-repai
      BeST_Fibonacci Retracement Lines is an MT4 Indicator that by default is based on common  Fibonacci levels but it can also draw any 3 desired levels of Retracement or Support of a trending move. It can be used to identify pullback points but also additionally as a kind of a Trailing Stop . BeST_Fibonacci Retracement Lines indicator: • by default draws 38.2%, 50% and 61.8% Retracement Levels of the current price move defined using the Highest High (HH) and Lowest Low (LL) of a desired Look Back Pe
      BeST_IFT of Oscillators Collection is a Composite MT4 Indicator   that is based on the IFT (Inverse Fisher Transformation) applied to RSI , CCI , Stochastic and DeMarker Oscillators in order to find the best Entry and Exit points while using these Oscillators in our trading. The IFT was first used by John Ehlers to help clearly define the trigger points while using for this any common Oscillator ( TASC – May 2004 ). All Buy and Sell Signal s are derived by the Indicator’s crossings of the Buy or
      BeST_Oscillators Collection is a Composite MT5 Indicato r including the Chaikin ,  Chande and TRIX Oscillators from which by default Chaikin and TRIX Oscillators but not Chande Momentum Oscillator are contained in MT5 platform. It also provides for each Oscillator the option of displaying or not a Mov. Average as a  Signal Line and the resulting Signals as Arrows in a Normal (all arrows) or in a Reverse Mode (without showing up any resulting successive and of same type arrows). Analytically fo
      FREE
      BeST_Gann Hi-Lo Strategy is an MT4 indicator that is based on the Gann Hi-Lo Activator the famous trend-following indicator that allow us to to enter a trade quite early while also stay in a trade as longer as we can for taking profit.While it is built of a moving average it helps traders determine the direction of the trends and to produce with-trend trading signals. This indicator is in fact a simple moving average of the highs and lows of the previous period. It follows the trends in the mark
      FREE
      BeST_Darvas Boxes is a Metatrader Indicator based on the trading method developed in the 50’s by the Hungarian Nicolas Darvas . BeST_Darvas Boxes indicator draws the Top and the Bottom of every Darvas Box that can be confirmed on the current Chart draws Buy and Sell Arrows for every confirmed Upwards or Downwards Breakout of the above levels draws always only after the bar closing and so is non-repainting or backpainting it can be used as a standalone trading system/method Inputs Basic Settin
      BeST Oscillators Collection is a Composite MT4 Indicator including the  Chaikin,Chande  and TRIX Oscillators which by default are contained in  MT5  but not in  MT4 platform. It  also provides  the option of displaying or not a Mov. Avg. as a Signal   Line and the resulting Signals as Arrows in a Normal (all arrows) or in a Reverse Mode (without showing up any resulting successive and of same type arrows). Analytically for each one of the specific Oscillators: The Chaikin Oscillator ( CHO )   is
      FREE
      Variable Index Dynamic Average (VIDYA) developed by Tushar Chande  by default is contained in MT5 but not in MT4 platform and it is a dynamic EMA (Exponential Moving Average) that adjusts its Length (LB Period) automatically in response to Market Volatility originally measured through the Chande Momentum Oscillator(CMO). CMO value is used as the ratio to the smoothing factor of EMA ( The New Technical Trader by Tushar Chande and Stanley Kroll, John Wiley and Sons, New York, 1994). The higher th
      FREE
      BeST_ Classic Pivot Points is an MT4 Indicator that is based on the widely known and definitely classic Pivot Point of a market prices activity. A pivot point is calculated as an average of significant prices (high,low,close) from the performance of a market in the prior trading period. If the market in the following period trades above the pivot point it is usually evaluated as a bullish sentiment, whereas trading below the pivot point is seen as bearish. A pivot point and the associated suppo
      FREE
      Triple Exponential Moving Average ( TEMA ) is a  moving   average (MA) that gives the  most weight to recent price data. TEMA is more reactive to  all price fluctuations than  a Simple Moving Average (SMA) or an Exponential Moving Average (EMA) or even a Double Moving Average (DEMA) and surely can help traders to spot reversals sooner because it responds very fast to any changes in market activity.  TEMA was developed by Patrick Mulloy in an attempt to reduce the amount of lag time found in trad
      FREE
      BeST_Chande RAVI (Range Action Verification Index) is an MT4 Indicator that is based on the corresponding indicator developed by Tushar Chande which is mainly based on market momentum while focuses on identifying ranging and trending markets. By default RAVI is defined by the formula:  RAVI = Absolute value (100 x (SMA(7) – SMA(65)). Also by default there is an arbitrary reference level of 3% that means a market is ranging if the RAVI is less than 3%, or trending strongly if it is is greater th
      FREE
      BeST DEMA
      Eleni Koulocheri
      4.5 (2)
      Double Exponential Moving Average ( DEMA ) is a moving  average (MA) that gives the most weight to recent price data.Like exponential moving average (EMA), it is more reactive to all price fluctuations than a simple moving average (SMA) and so DEMA can help traders to spot reversals sooner, because it is faster responding to any changes in market activity. DEMA was developed by Patrick Mulloy in an attempt to reduce the amount of lag time found in traditional MAs. ( TASC_Feb. 1994 ). DEMA can al
      FREE
      BeST_Darvas Boxes is an MT4  Indicator based on the trading method developed in the 50’s by the Hungarian Nicolas Darvas . BeST_Darvas Boxes indicator draws the Top and the Bottom of every Darvas Box  that can be confirmed on the current Chart. draws Buy and Sell Arrows  for every confirmed Upwards or Downwards Breakout of the above levels. draws always only after the bar closing and so is non-repainting or backpainting . Note : Every customer who wants to have the older version v_1.75 with th
      BeST_Visual MAs Signal Generator  MT4 Indicator is a very  useful Visual Tool that can display in the Chart all ENTRY signals (BUY and SELL) and also any corresponding EXIT signal, based on a total of 12, common but also different trading strategies, in which the Entry and Exit Signals are derived exclusively by using Moving Averages (MAs). The two main groups of MAs Strategies included in this tool are: A) Crossover Signals This group includes 4 different strategies (A1-A4), where Entry and Exi
      BeST_Keltner  Channels Variations & Strategies   is an   MT4  Indicator based on the original  Keltner Channels Technical Analysis Indicator and it is a very useful Visual Tool that can display in the Chart all the known Variations of Keltener Channels and also the corresponding 10 totally Strategies   i.e. all ENTRY signals (BUY and SELL) and also any corresponding EXIT signal, in which the Enrty and Exit Signals are derived exclusively by using Keltner Channels Variations. Every variation of K
      BeST_Trend  Scanner is an MT4 Indicator that uses a proprietary algorithm   in order to identify the most likely levels and probable moment for an upside  or a downside trending price move. BeST_Trend  Scanner is a very useful tool that defines in advance and with a high statistical percentage of accuracy the subsequent Resistance & Support Levels of the anticipated upside or downside trending move of price and so When used at its Reverse Entries Mode : It generates Buy or Sell arrows at the ver
      BeST_Darvas Boxes EA is an MT4  Expert Advisor that is based on the most classic trading method developed  in the 50's by Nicolas Darvas  commonly known as The Darvas Boxes Trading System. The Original Darvas Boxes System can be found in details in his book "How I Made $2,000,000 In The Stock Market"  (Copyright 1960, by Nicolas Darvas). Although the original system was designed to trade only Stocks and to open only Long trades its trading principles can also be applied to many other Markets l
      BeST_Chande TrendScore Indicator  points the start of a trend with high degree of  accuracy and it is amazing for scalping on the 1min timeframe. It is also a   simple way to rate trend strength. It indicates both the direction and strength  of a trend and can be easily combined with various trend-following, swing and scalping strategies. As of a trend’s direction and strength a value of +10 signals a strong uptrend while a value of -10 signals a strong downtrend. Generally a positive score show
      All those involved in trading do certainly know that Moving Average Crossovers for being tradable should be reliable and also they need to have minimal lag. BeST_Vervoort Zero Lagging MAs Strategy is a Metatrader Indicator that can help you to achieve it and is based on S.Vervoort's work about Reliable and of Zero Lag MAs Crossovers as described in his TASC_05/2008 article " The Quest For Reliable Crossovers ". It's a Multipotentiality Indicator as it can display of either simply the Zero Laggin
      BeST_Trend Exploiter is a Metatrader Indicator  based on a smart proprietary algorithm which can detect the market Median Trend while it filters out the noise providing Buy and Sell Signals and also wherever it is applicable it provides us with TP Levels of High Probability. Additionally as it has Built Inside all the necessary features it can be used as a Complete Strategy of very Impressive Results. Essential Advantages of the Indicator Clear and Easily Understandable trading rules. Real Time
      BeST_Profit Taker Exits is a Metatrader Indicator based on the corresponding vital part of Jim Berg's Trading System.It timely locates the most likely points/bars of significant Profit Taking and can be easily used as an add-on to any Trading System/Method . The Indicator consists of 2 Take Profit lines deriving as (MA ± times the ATR) usually the upper one above the prices (for Long Trades) and the lower one below prices (for Short Trades). When the Close (or High by choice) of a bar is above
      BeST_Hull MAs Directional Strategy is a Metatrader Indicator based on the corresponding Hull Moving Average.It timely locates the most likely points for Entering the Market as well as the most suitable Exit points and can be used either as a standalone Trading System or as an add-on to any Trading System for finding/confirming the most appropriate Entry or Exit points. This indicator does use only the directional slope and its turning points of Hull MAs to locate the Entry/Exit points while it a
      BeST_Breakout Strategy is a Metatrader Indicator based on a proprietary algorithm implementing a very powerful tool that can exploit every breakout leading to huge market movements. It timely locates the most likely points for Entering the Market as well as the most suitable Exit points and can be used successfully as a standalone Trading System which often results in huge profits accompanied by very impressive statistics like Success Ratio and Profit Factor.  The BeST_Breakout Strategy is a
      BeST_ Elliot Wave Oscillator Strategies is an MT4 indicator which by default is the difference of two SMAs displayed as a histogram fluctuating around zero while a Signal Line generates Entry Signals either in a Reverse or in a Normal Mode and it is a very powerful tool that very often exploits huge market movements. Signal Line comes in 2 types: Advanced Get Type – like the corresponding one used in the homonym analysis package Mov. Average Type – as a Moving Average of the Elliot Oscillator I
      BeST_Keltner Channels Strategies  EA   is an MT4  Expert Advisor that is based on the method developed by Chester W. Keltner described in book “How To Make Money in Commodities” that  Keltner called it the ten-day moving average trading rule. Originally Keltner Channels uses for Central Line a 10-bars SMA of Typical Price and  the 10-bars Average Range (High - Low) with a multiplication factor of 1 for constructing the Boundary Bands. Later several known traders and authors have published modif
      BeST_RevEngEMARSI Strategy is an MT4 Indicator that is based on the indicator RevEngEMARSI by Giorgos Siligardos that was presented in his article " Reverse Engineering RSI (II) " ( TASC_Aug 2003 ) as a new variation of his inverse-RSI indicator and which transforms the Exponential moving average of RSI into a curve in the price graph, simplifying the price projection method and improving its visual representation. BeST_RevEngEMARSI Strategy while implementing the crossings with its Moving Aver
      BeST_ADX Scalping Strategy is an MT4 Strategy of an Entry and Exit Signals Indicator based on the ADX values that is an excellent tool for scalpers to scalp the currency market multiple times a day for profit . It is built mainly for scalping purposes although it can also be used as a breakout indicator . Its Signals produce a complete and standalone trading system of impressive results . The indicator comes with a new enhanced Real Time Updated Info and Statistics Panel that can improve its ove
      BeST_RMO Indicator Strategies is an MT4 Indicator that is based on the corresponding famous Oscillator created by Rahul Mohindar that detects trends in all markets and it can produce Buy and Sell Signals of high winning probability forming a complete and standalone trading system of impressive results. The indicator uses 2 strategies as a selection: i) Classic : produces Reversed Entry Signals by the crossings of zero (0) line  and ii) MAsSignals : produces Reversed Entry Signals using MAs of RM
      BeST_Fisher Oscillator Strategies is an MT4 Indicator that is based on the popular Fisher Indicator and it is mainly used to identify trend reversals with a high accuracy .  It is a great forex trading indicator for scalping , day trading and swing trading purposes. The indicator comes with 2 corresponding Strategies of Reversed Entries each one of which can be used either as a standalone Trading System or as an add-on to any Trading System for finding or confirming the most appropriate Entry o
      BeST_Hull MAvgs Strategies_EA is an MT4 Expert Advisor based on the Market indicator named  BeST_Hull MAs Directional Strategy  and can make trades according to it or using only 1 HMA while it also applies all common Trade and Risk Management features. Generally the Hull Moving Average (HMA - developed by Alan Hull) is a directional trend indicator. It captures the current state of the market and uses recent price action to determine if conditions are bullish or bearish relative to historical da
      フィルタ:
      レビューなし
      レビューに返信