Multi Trend Fast Tracer MT5
- インディケータ
- バージョン: 1.20
- アップデート済み: 9 9月 2021
- アクティベーション: 5

This is an original, agile, and excellent trending system. Whether you are a beginner trading novice or a professional trader, this set of indicators can help you quickly and timely track the latest changes in market trends. It has the following characteristics:
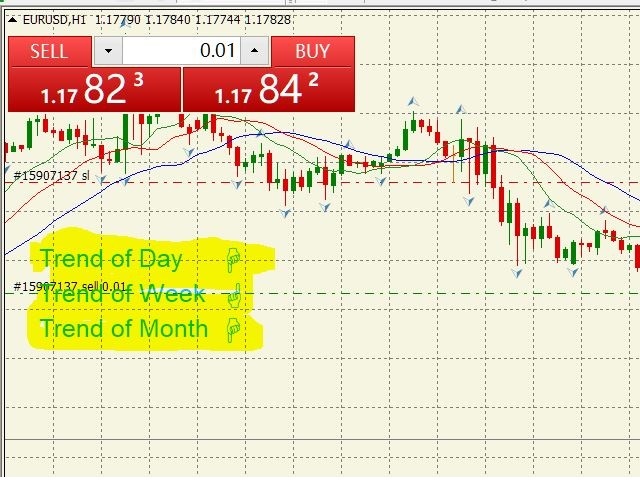
- The method of use is extremely simple, plug and play, and the display of all trend analysis results is clear at a glance;
- There is no need to configure any functional parameters, the trend tracking indicator will automatically analyze the daily/weekly/monthly trend direction based on market data;
- The trend information of today, this week and the current month are displayed in the same chart window at the same time;
- Does not rely on data from any other traditional/classic indicators;
- Support all trading varieties of the MT platform;
- Support all levels of charts from 5 minutes to daily (there are no restrictions for MT5 platform users);