PVA Color Volume Histograma
- インディケータ
- バージョン: 1.0
- アクティベーション: 5

Several techniques use volume as an important point in the trade. Whether to indicate strength, exhaustion, pullback weakness, among others.
In chief I quote Richard Wyckoff's theory, which said about the importance of looking price and volume.
However, there are several possibilities to filter what is volume that should be noticed.
PVRSA/PVA users use an indicator with specific colors, which assist in identifying the volume and type of movement that the price has made.
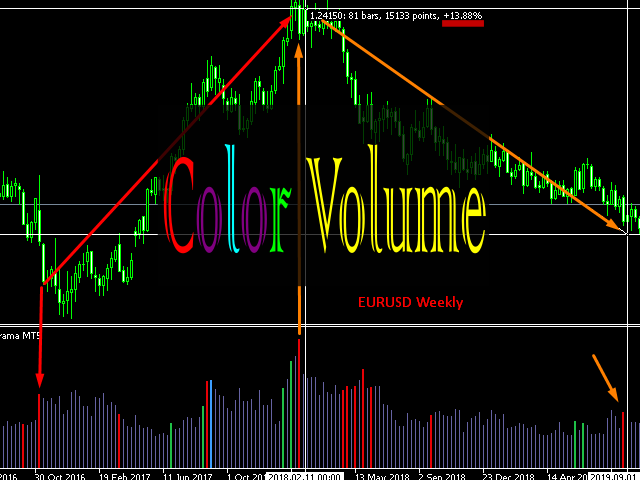
Will the high volume candle serve as a resistance, or has it indicated a candle of exhaustion of movement and the trend will reverse?
This decision is the trader's, but will be aided by the coloring rule of the PVA Color Histogram indicator.
By analyzing the Histogram you can see how big the volume of that candle was.
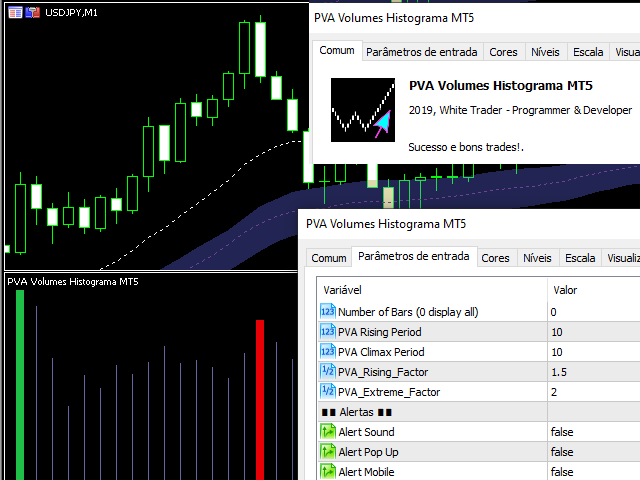
The indicator can be used on any asset/currency pair and can be customized according to the trader's interest.
See also my indicator of volume analysis in the form of c and chocolate candlestick, in addition to the indiador "Dragon", because they complement the analysis of PVA (Price and Volume Analysis)
Success and good trades!
In chief I quote Richard Wyckoff's theory, which said about the importance of looking price and volume.
However, there are several possibilities to filter what is volume that should be noticed.
PVRSA/PVA users use an indicator with specific colors, which assist in identifying the volume and type of movement that the price has made.
Will the high volume candle serve as a resistance, or has it indicated a candle of exhaustion of movement and the trend will reverse?
This decision is the trader's, but will be aided by the coloring rule of the PVA Color Histogram indicator.
By analyzing the Histogram you can see how big the volume of that candle was.
The indicator can be used on any asset/currency pair and can be customized according to the trader's interest.
See also my indicator of volume analysis in the form of c and chocolate candlestick, in addition to the indiador "Dragon", because they complement the analysis of PVA (Price and Volume Analysis)
Success and good trades!