EasyTrend Pro
- インディケータ
- バージョン: 1.3
- アップデート済み: 2 4月 2023
- アクティベーション: 5

EasyTrend Pro is the powerful trend indicator provided with all necessary for trade and it is very easy to use. Everyone has probably come across indicators or Expert Advisors that contain numerous input parameters that are difficult to understand. But here, input parameters are simple and it is no need to configure anything — neural network will do all for you.
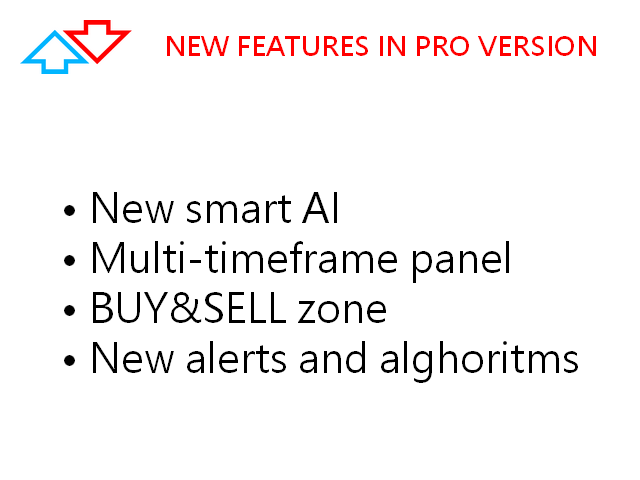
Difference from a classic version
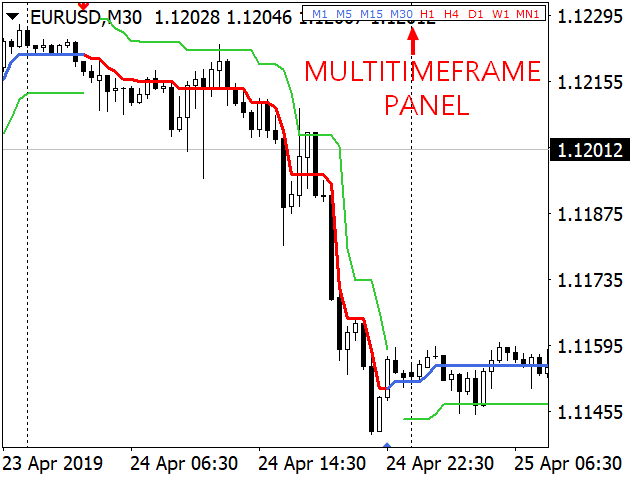
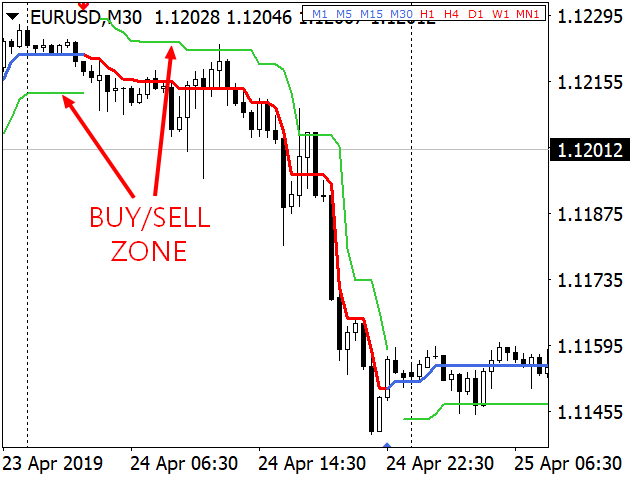
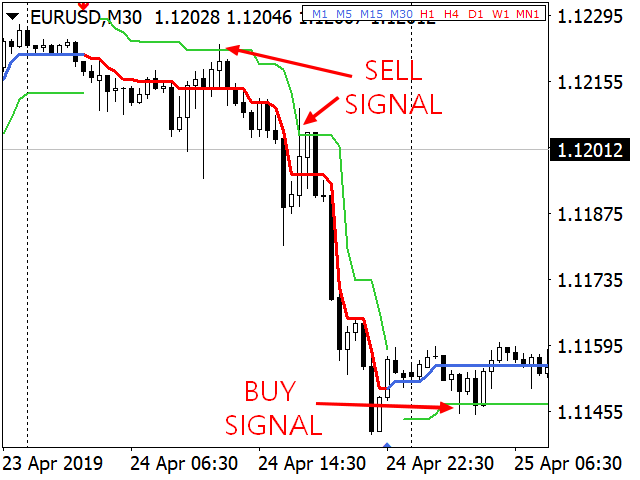
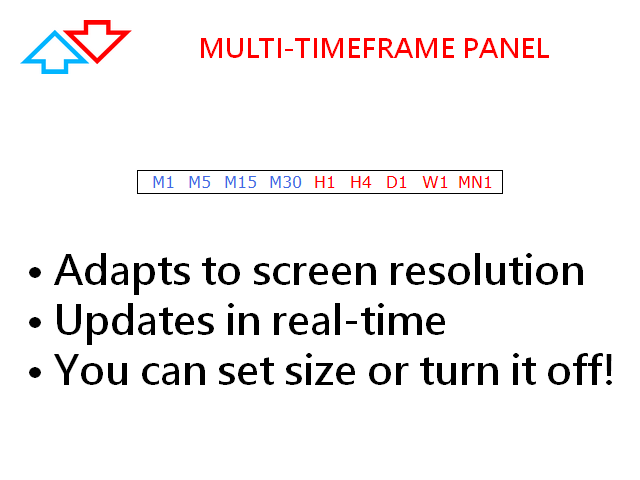
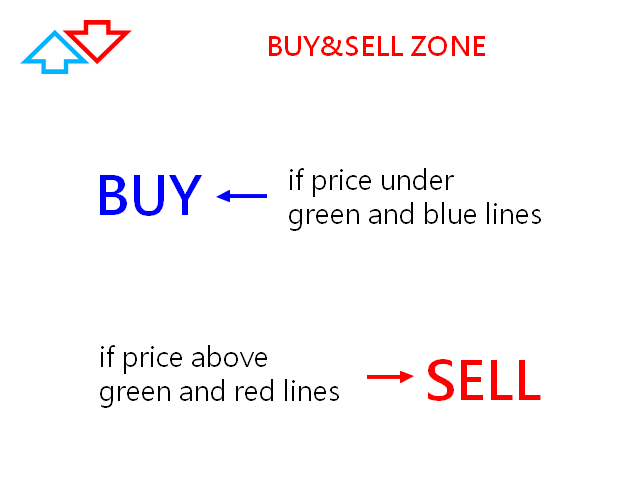
The real-time multi time frame panel is added, so you can check a trend for other timeframes without switching the schedule. The size of panel is regulated by tuning, and also adapts to the down-scaling of screen in Windows. The zone of purchase-sale is added. Now you get signals of purchase and sale, also zone adapts to current market volatility. A neural network is improved: it works quicker and qualitative the changes are vast and affected all. The indicator supports binary options trading using the MT2 platform. Support of cryptocurrency is added.Input parameters
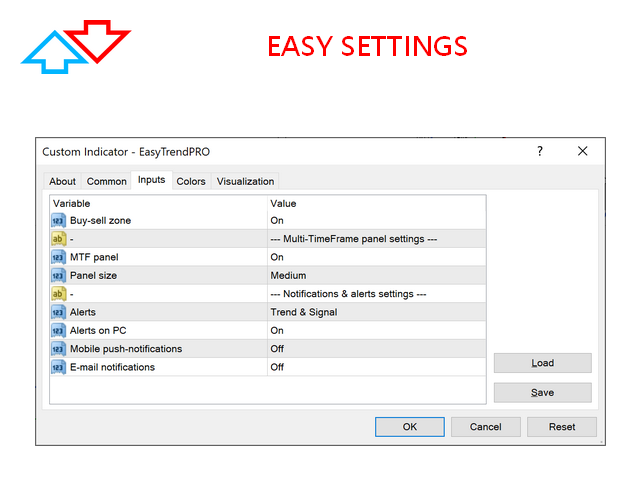
- Buy-sell zone - On/Off the buy-sell zone.
- MT2 Signals - On/Off MT2 signal buffers.
- MTF Panel - On/Off the multi-timeframe panel.
- Panel size - a size of multi-timeframe panel.
- Alerts - notification management, here you can disable some types of notifications. Off/Trend/Signal/Trend & Signal.
- Alerts on PC - On/Off notifications in the terminal, turning of notifications in a terminal off is Off.
- Mobile push-notifications - On/Off mobile push-notifications.
- E-mail notifications - On/Off notifications by mail.
How It Works and features
It is based on the analysis of the current change in the price deviation from its average value over a certain period and the statistical average of the absolute value of this parameter. The analysis results are adjusted by the sensitivity coefficient and vertical shifts, which in turn depend on the current trading instrument, timeframe and inclination angle of the trend channel. All internally variable parameters, values and automatic adaptation is managed by a neural network.
It does not get redrawn. Suitable for all types of trading, and also can be used in binary options trading. Easy to set up and use. It works on all timeframes, but the sale and purchase zone does not work on W1 and MN1. Automatically adjusts to all currency pairs, metals, cryptocurrency, CFD and even oil. Works with MT2 Trading Platform.
How to trade?
You can see an example of trading in the attached video.
A classic method: сhoose a timeframe to trade, suppose M15. Wait for a trend change notification. Next, wait for a buy or sell signal. After receiving the signal, be sure to check the trend on higher timeframes. When trading on M15, check M30, H1 and H4 - the trends should match your signal. Open a trade. Set Stop Loss at the same distance from the opening price as the opening price is from the trend line. After the price crosses the trend line confidently, set Stop Loss to breakeven and gradually move it with the price. You can use trailing. You can close the transaction by stop loss or by crossing the price with a moving average.
Scalping: the timeframe is M1 or M5. You can open a trade either by a buy-sell signal or by a change of trend. Use trailing stop. Closing a deal when crossing a moving average or trailing.
Binary options
The timeframe is M1 or M5 and a five-digit broker. Waiting for a buy-sell signal. Open a trade with expiration of 15 minutes for M5 and 5 minutes for M1. These settings are tested on the EURUSD pair, but all parameters can be individually selected for yourself.
Settings for MT2 Trading Platform
- Turn off all notifications and the MTF panel.
- Turn on MT2 Signals and Buy-sell zone.
- Use buffers 6 and 7 as signals.
- Also in MT2 Auto Connector, set signals to IntraBar.
- In the MT2 Trading Platform settings, set the open trading limit for the asset to 1.
Due to the fact that there are many bugs in the MT2 Trading Platform, when working in IntraBar, the computer can seriously slow down - it is not recommended to install more than 1 chart at a time.


Spot on for trend and pull back, Author support is excellent, reported issue has been fix fast 5 stars and Author is open to idea constantly update and improving, Well done!