Improved Fractals
- インディケータ
- バージョン: 1.2
- アップデート済み: 10 2月 2023

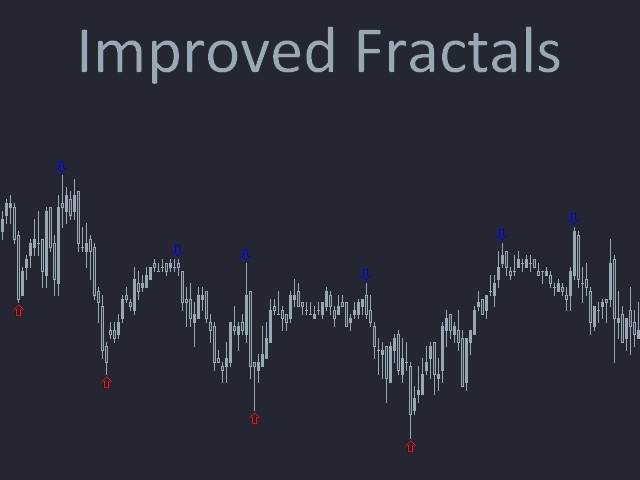
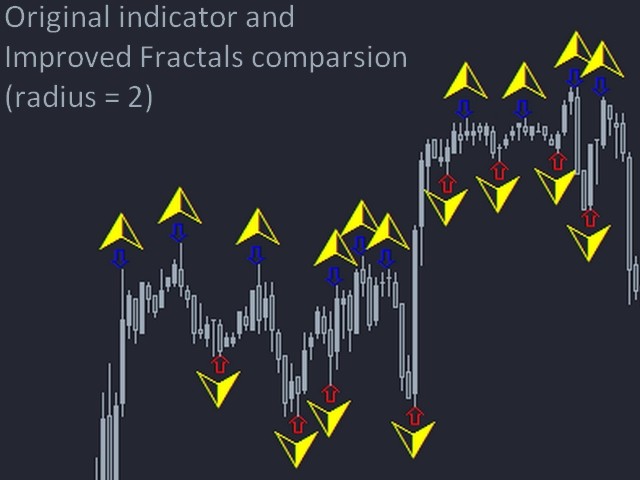
This is a modified Fractals indicator. It works similar the original Bill Williams' indicator, and is additionally enhanced with the possibility to change the top radius, in contrast to the standard radius of 2 bar. Simply put, the indicator checks the top and if it is the minimum/maximum in this radius, such a top is marked by an arrow.
Advantages
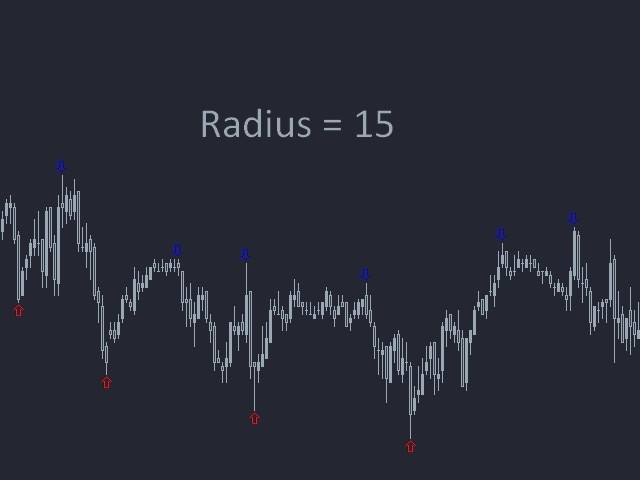
- Adjustable radius.
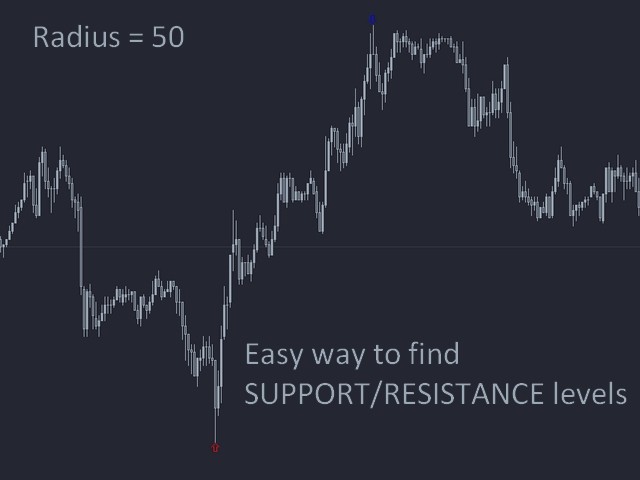
- Use for drawing support and resistance levels.
- Use for drawing trend channels.
- Use within the classical Bill Williams' strategy or in its modifications.
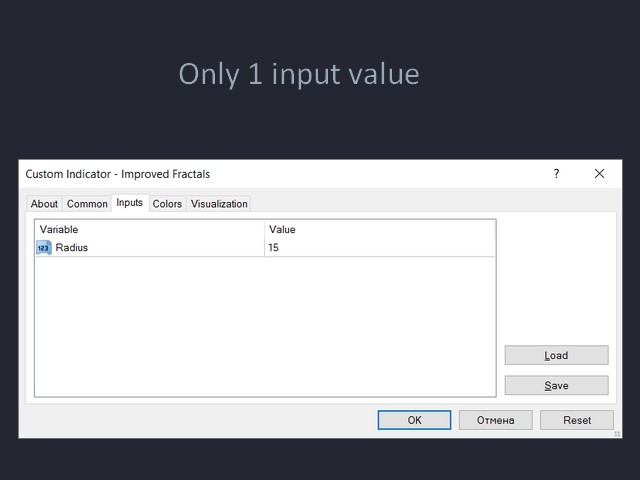
Input parameters
- Radius — the radius of the fractal.
Extra
- I regularly publish modified versions of standard indicators. You can find these indicators and my other applications here.
- If you have ideas or need a modification of any indicator, please contact me—I will consider your suggestion and may publish it.


Depends on how you use it. For me i track it a shorter radius. Nothing is concrete in technical trading. You always got to monitor your trades. Thank you Denis.