Arbitrage Thief Index

4.35

The Silent Edge of Smart Money
"It's not about how much you do, but how much love you put into what you do that counts." – Mother Teresa


They say the real money in trading is made in the shadows—where inefficiencies hide and only the most perceptive capitalize. That’s exactly where the Arbitrage Thief Index (ATI) thrives.

For years, this tool has been my personal advantage, silently identifying low-risk, high-reward trades before the crowd even notices. It’s the kind of edge top fund managers never talk about—until now.

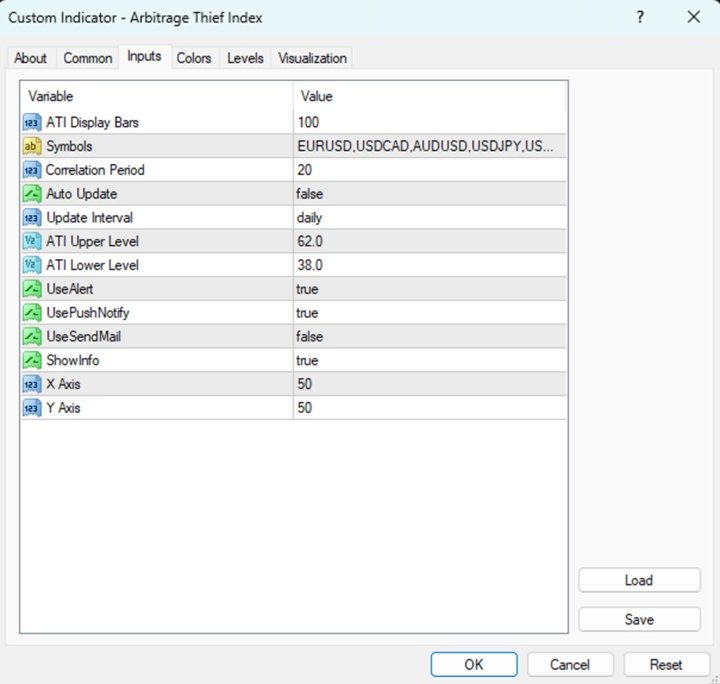
To maintain stability in basket trading, it’s important to carefully manage the auto_update setting and ensure the preferred timeframe is set correctly from the beginning.

Action:

  1. Set auto_update to false after entering a trade in a basket. This helps validate results without unintended changes.
  2. If auto_update is enabled, choosing an appropriate update interval is crucial—daily is recommended for stability.
  3. Do not switch timeframes after setup, as this will trigger auto_update . Instead, ensure the preferred timeframe is selected from the start.
  4. The correlation period works only on the daily timeframe to determine statistical cointegration and correlation. The default 20-period setting is generally sufficient for capturing patterns.

Details:

  • Disabling auto_update prevents unwanted adjustments to the basket once the trade is placed.
  • A daily update interval, if used, balances consistency and adaptability without excessive recalculations.
  • Keeping the timeframe stable avoids triggering unintended updates.
  • The default 20-period correlation setting is optimized for reliable pattern detection.


    What Makes ATI Unmatched?
    No guesswork. It delivers precise entry and exit signalsno repainting, no lag.
    Perfect for all traders. Whether you’re scalping or holding, this works.
    Effortless execution. Real-time alerts (popup, push, email) ensure you never miss a move.
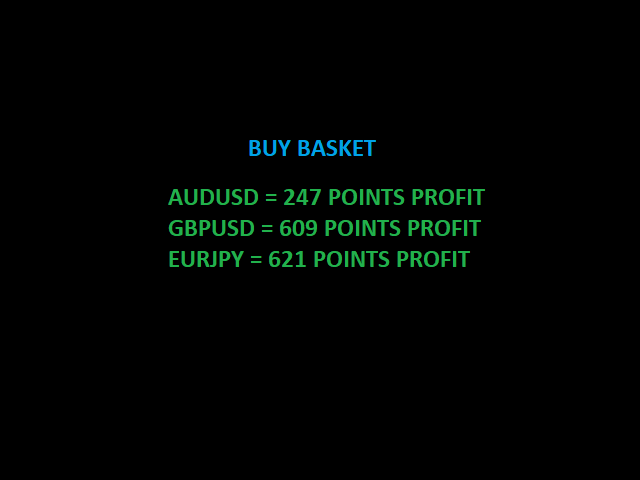
    Basket trading made easy. Quickly spots the best arbitrage opportunities across multiple correlated pairs.
    Adapts to all market conditions. Works in trending and ranging environments.
    Seamless with Expert Advisors. Automate your strategy effortlessly.


    How to Trade with ATI
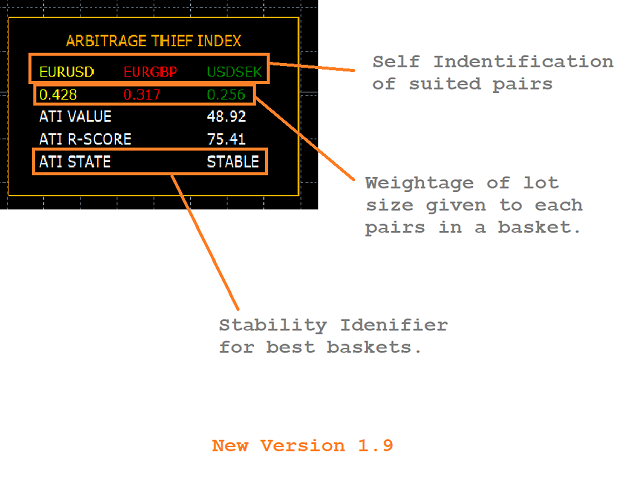
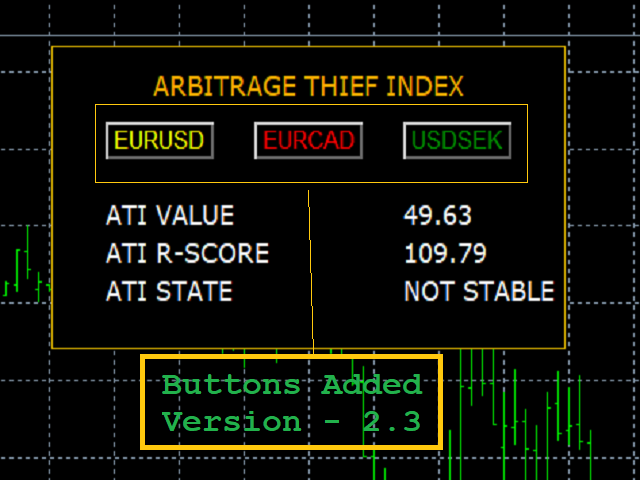
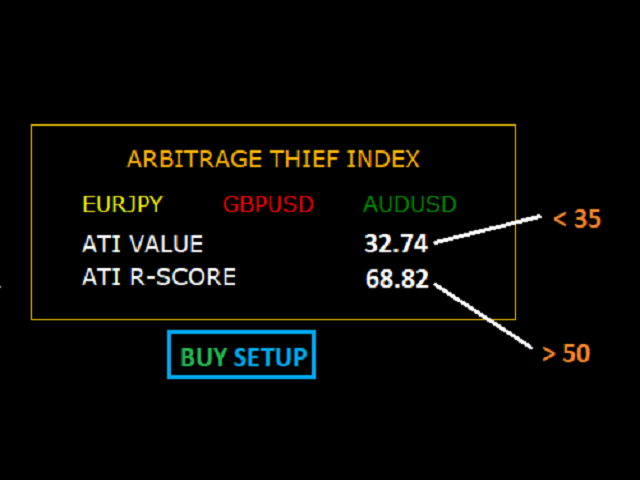
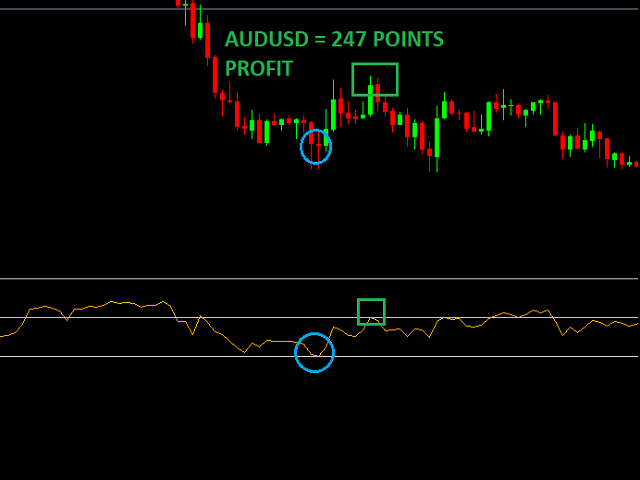
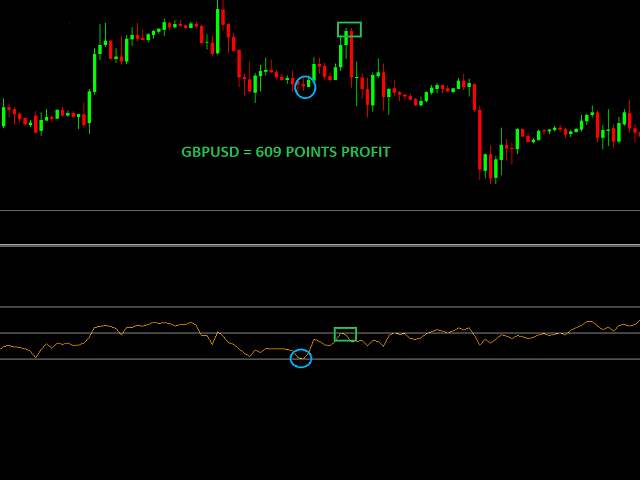
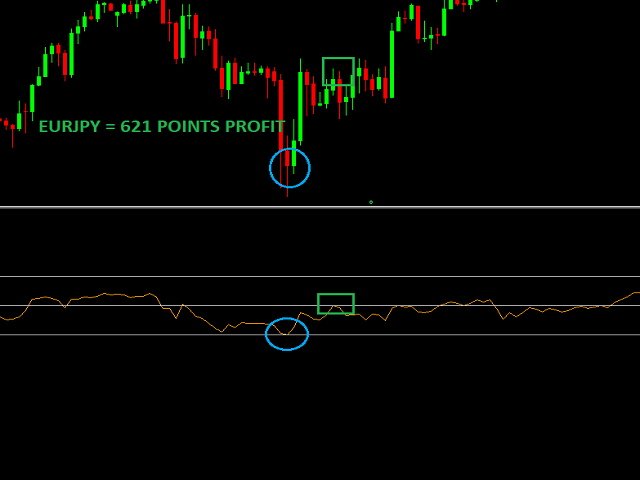
    📉 SELL: Short the three correlated pairs when ATI exceeds 65 and R-SCORE is above 50. Exit at 50.
    📈 BUY: Go long when ATI drops below 35 and R-SCORE is above 50. Exit at 50.


    The Smart Money Isn’t Waiting – Neither Should You
    This is more than an indicator. It’s an entire system, a battle-tested methodology that tilts the odds in your favor.
    Most traders chase signals. The best traders anticipate them. The choice is yours.
    Get the Arbitrage Thief Index now and step into the world of precision trading.


    [WATCH THE VIDEO DEMO BELOW]

    レビュー 26
    Mihai Stanciu
    147
    Mihai Stanciu 2020.02.17 21:47 
     

    Excellent indicator, excellent support from author

    chayanin sinthuset
    159
    chayanin sinthuset 2019.09.25 12:04 
     

    Great tools.Great support.

    Pui Man Wong
    381
    Pui Man Wong 2019.07.07 03:40 
     

    4 weeks testing, the indicator + EA were great, always positive, it can work on large investment.

    おすすめのプロダクト
    VR Cub
    Vladimir Pastushak
    VR Cub は、質の高いエントリーポイントを獲得するためのインジケーターです。このインジケーターは、数学的計算を容易にし、ポジションへのエントリーポイントの検索を簡素化するために開発されました。このインジケーターが作成されたトレーディング戦略は、長年にわたってその有効性が証明されてきました。取引戦略のシンプルさはその大きな利点であり、初心者のトレーダーでもうまく取引することができます。 VR Cub はポジション開始ポイントとテイクプロフィットとストップロスのターゲットレベルを計算し、効率と使いやすさを大幅に向上させます。取引の簡単なルールを理解するには、以下の戦略を使用した取引のスクリーンショットを見てください。 設定、設定ファイル、デモ版、説明書、問題解決方法は、以下から入手できます。 [ブログ] レビューを読んだり書いたりすることができます。 [リンク] のバージョン [MetaTrader 5] エントリーポイントの計算ルール ポジションをオープンする エントリーポイントを計算するには、VR Cub ツールを最後の高値から最後の安値までストレッチする必要があります。 最初
    Indicator Description GOLD TITAN KING SIGNAL INDICATOR High-Precision Gold Scalping Buy/Sell Signals – Manual Trading Assistant Overview The Gold Titan King Signal Indicator is a manual trading assistant tool designed for high-frequency scalping on Gold (XAUUSD) and other major pairs. It generates clear BUY/SELL signals with precise entry levels, along with adjustable Stop Loss and Take Profit levels displayed directly on the chart. ️ This tool is NOT an EA. It does not execute trades
    Owl smart levels
    Sergey Ermolov
    4.24 (37)
    MT5版  |   FAQ Owl Smart Levels Indicator   は、 Bill Williams   の高度なフラクタル、市場の正しい波構造を構築する Valable ZigZag、エントリの正確なレベルをマークする Fibonacci レベルなどの一般的な市場分析ツールを含む 1 つのインジケーター内の完全な取引システムです。 利益を得るために市場と場所に。 戦略の詳細な説明 インジケータを操作するための指示 顧問-取引助手 プライベートユーザーチャット ->購入後に私に書いて、私はプライベートチャットにあなたを追加し、あなたはそこにすべてのボーナスをダウンロードすることができます 力はシンプルさにあります! Owl Smart Levels   取引システムは非常に使いやすいので、専門家にも、市場を勉強し始めて自分で取引戦略を選択し始めたばかりの人にも適しています。 戦略と指標に秘密の数式や計算方法が隠されているわけではなく、すべての戦略指標は公開されています。 Owl Smart Levels を使用すると、取引を開始するためのシグナルをすばやく確認し、注
    「ダイナミック・スキャルピング・オシレーター」は、MT4向けの高度なカスタムCrypto_Forexインジケーターです。効率的な取引ツールです! - 新世代のオシレーター - 使い方は画像をご覧ください。 - ダイナミック・スキャルピング・オシレーターは、適応型の売られ過ぎ/買われ過ぎゾーンを備えています。 - オシレーターは、動的な売られ過ぎ/買われ過ぎエリアから正確なエントリーポイントを見つけるための補助ツールです。 - 売られ過ぎ値:グリーンラインより下、買われ過ぎ値:オレンジラインより上。 - このインジケーターは、プライスアクションパターンと組み合わせるのに最適です。 - 標準的なオシレーターよりもはるかに正確です。対応時間枠:M30、H1、H4、D1、W1。 - PCとモバイルの両方でアラート機能付き。 高品質のトレーディングロボットとインジケーターをご覧になるにはここをクリックしてください! これは、このMQL5ウェブサイトでのみ提供されるオリジナル製品です。
    [ZhiBiCCI]インディケータは全てのサイクル使用に適しており、そして全ての市場品種にも適しています。 [ZhiBiCCI]緑色の実線は強気の発散の逆転です。緑色の点線は古典的な強気の発散です。 [ZhiBiCCI]赤への実線は逆弱気の発散である。赤い点線は古典的な弱気の発散です。 [ZhiBiCCI]はパラメータ(アラート、メール送信、通知送信)で設定でき、(true)に設定するとインスタント信号をアラームウィンドウに送信し、Eメール、インスタントメッセージを送信できます。 パラメータ設定の説明 [displayAlert]:これはアラームスイッチで、trueに設定され、矢印が表示されればプロンプトに自動的に警告され、falseに設定されれば警告されません。 [sendmail_NO_OFF]:これはメールを送信するためのスイッチで、trueに設定します。矢印が表示されていればMT4で設定したメールボックスにメールを送信し、falseに設定されていればメールを送信しません。 [sendnotification_NO_OFF]:これはインスタントメッセージを送信するた
    Alpha Trend signは私たちの取引システムを検証し、取引信号を明確に提示し、信号がドリフトすることはありません。 主な機能: •市場が活況を示している地域に応じて、指標に基づいて現在の相場がトレンド相場に属しているか、それとも揺れ相場に属しているかを直感的に判断することができる。 そして、指標の指示矢印に基づいて市場に切り込み、緑の矢印は購入を提示し、赤の矢印は販売を提示する。 •小周期変動による頻繁な取引信号の発生を回避するために、5分以上の時間周期で取引を行うことを推奨します。 •最適な取引タイミングを逃さないために、シグナルプロンプトをオンにすることもできます。 •本指標はトレンド相場をよく予測するだけでなく、幅広振動相場でも利益を得ることができる。 •本指標は大道至簡の原則に基づいており、異なる段階のトレーダーが使用するのに適している。 注意事項: •Alpha Trend signには明確な入退場信号があり、損失を与えないように逆位相操作を提案しない。 •Alpha Trend signは特に成熟した指標であり、デルのチー
    Advanced Trend Regime
    Shellard Securities (Pty) Ltd
    The indicator has been designed to function on any time-frame and any pair.   This regime filter will help the trader better evaluate whether the current market is trending, and in which direction. It quickly reacts to changes in market dynamics using a series of advanced calculations. The user is able to select whether the calculation remains standard, or if a further filter constraint is added to the calculation.   A Yellow moving average of the signal has been included for the trader to smoot
    PipFinite Trend PRO
    Karlo Wilson Vendiola
    4.88 (2249)
    Breakthrough Solution For Trend Trading And Filtering With All Important Features Built Inside One Tool! Trend PRO's smart algorithm detects the trend, filters out market noise and gives entry signals with exit levels. The new features with enhanced rules for statistical calculation improved the overall performance of this indicator. Important Information Revealed Maximize the potential of Trend Pro, please visit www.mql5.com/en/blogs/post/713938 The Powerful Expert Advisor Version Automatin
    Super Reversal Pattern Indicator Unlock the power of advanced pattern recognition with our Super Reversal Pattern Indicator. Designed for traders seeking precision and reliability, this indicator identifies one of the most effective reversal patterns in technical analysis, offering a significant edge in your trading strategy. Key Features: Non-Repainting Accuracy: Enjoy the confidence of non-repainting technology. Once a Super Reversal Pattern is detected, it remains static, providing consiste
    Noize Absorption Index - is the manual trading system that measures the difference of pressure between bears forces and bulls forces. Green line - is a noize free index that showing curent situation. Zero value of index shows totally choppy/flat market.Values above zero level shows how powerfull bullish wave is and values below zero measures bearish forces.Up arrow appears on bearish market when it's ready to reverse, dn arrow appears on weak bullish market, as a result of reverse expectation. S
    Heiken Ashi candle chart is an improved version of The Japanese candle chart, which can effectively filter the market "noise" of the Japanese candle chart. It is favored by many traders for its simplicity and intuition. For trend traders, the HA candle chart is a magic tool. Unlike the traditional Japanese candle chart, Heikenashi does not reflect the opening price, high price, low price and closing price of the market. Instead, Heikenashi calculates the value of a single K line in the dominant
    Improved version of the free HMA Trend indicator (for MetaTrader 4) with statistical analysis. HMA Trend is a trend indicator based on the Hull Moving Average (HMA) with two periods. HMA with a slow period identifies the trend, while HMA with a fast period determines the short-term movements and signals in the trend direction. The main differences from the free version: Ability to predict the probability of a trend reversal using analysis of history data. Plotting statistical charts for analyzi
    EZZ Elite Zig Zag is an indicator for the MetaTrader 4 terminal. This indicator traces the peak of the trend based on the market reversal, thus showing various opportunities in the financial market. EZZ Elite Zig Zag is a visual tool, intuitive, and easy to understand and use.  Test it Yourself by Downloading it for Free. Author Paulo Rocha all rights reserved
    Taurus All4 Taurus All4 is a high-performance indicator, it will tell you the strength of the trend, and you will be able to observe the strength of the candle. Our indicator has more than 4 trend confirmations. It is very simple and easy to use. Confirmation Modes Candle Trend Confirmations: When the candle switches to light green the trend is high. When the candle switches to light red the trend is reverting down. When the candle changes to dark red the trend is low. Trendline Trend Confirm
    The Stepping Trend Indicator     The Steppi ng Trend indicator uses the  average true range  (ATR indicator) in its calculation. This gives you control to set your own average true range period, I set the Default as 10.   Indicator Details. Green Arrow Up: This means you are at the starting point of a new bullish trend, it’s time to buy.   Red  Arrow  Down : This means you are at the starting point of a new  bearish  trend, it’ s time to sell .   What if you miss the Arrow Signal?   No prob
    SMC Venom Model BPR インジケーターは、スマート マネー (SMC) コンセプトで取引するトレーダー向けのプロフェッショナル ツールです。価格チャート上の 2 つの主要なパターンを自動的に識別します。 FVG   (フェアバリューギャップ) は、3 本のローソク足の組み合わせで、最初のローソク足と 3 番目のローソク足の間にギャップがあります。ボリュームサポートのないレベル間のゾーンを形成し、価格修正につながることがよくあります。 BPR   (バランス価格範囲) は、2 つの FVG パターンの組み合わせで、「ブリッジ」を形成します。これは、価格がボリュームアクティビティの少ない動きで動くときに、ブレイクアウトしてレベルに戻るゾーンで、ローソク足の間にギャップを作成します。 これらのパターンは、大規模な市場プレーヤーと一般参加者の相互作用が発生するチャート上のボリュームと価格動向の分析に基づいて、トレーダーが主要なサポート/レジスタンス レベル、ブレイクアウト ゾーン、エントリ ポイントを識別するのに役立ちます。 インジケーターは、長方形と矢印の形でパターンを視
    これは、キャンドルの終値を予測する指標です。 このインジケータは、主にD1チャートでの使用を目的としていますが. この指標は、従来の外国為替取引とバイナリオプション取引の両方に適しています。 インジケーターは、スタンドアロンのトレーディングシステムとして使用することも、既存のトレーディングシステムへの追加として機能させることもできます。 このインジケーターは、現在のキャンドルを分析し、キャンドル自体の内部の特定の強度係数と、前のキャンドルのパラメーターを計算します。 したがって、この指標は、市場の動きのさらなる方向性と現在のキャンドルの終値を予測します。 この方法のおかげで、この指標は、短期の日中取引だけでなく、中期および長期の取引にも適しています。 インジケーターを使用すると、市場の状況の分析中にインジケーターが生成する潜在的な信号の数を設定できます。 インジケーターの設定には、このための特別なパラメーターがあります。 また、インジケーターは、チャート上のメッセージの形式で、電子メールで、およびPUSH通知の形式で、新しい信号について通知することができます。 購入後は必ず私に書いて
    The Th3Eng PipFinite indicator is based on a very excellent analysis of the right trend direction with perfect custom algorithms. It show the true direction and the best point to start trading. With StopLoss point and Three Take Profit points. Also it show the right pivot of the price and small points to order to replace the dynamic support and resistance channel, Which surrounds the price. And Finally it draws a very helpful Box on the left side on the chart includes (take profits and Stop loss
    The Super Arrow Indicator provides non-repainting buy and sell signals with exceptional accuracy. Key Features No repainting – confirmed signals remain fixed Clear visual arrows: green for buy, red for sell Real-time alerts via pop-up, sound, and optional email Clean chart view with no unnecessary clutter Works on all markets: Forex, gold, oil, indices, crypto Adjustable Parameters TimeFrame Default: "current time frame" Function: Sets the time frame for indicator calculation Options: Can be set
    Fourteen plus nine What is it for? Applying Tom DeMark’s TD Sequential serves the purpose of identifying a price point where an uptrend or a downtrend exhausts itself and reverses. . What are the main components of TD Sequential? TD Sequential has two parts – TD Setup and TD Countdown. The first phase of TD Sequential starts with a TD Setup and is completed with a 9 count. When the 9 count is completed, it is at that point, a price pause, price pullback, or reversal is likely. It is also at tha
    Forex Gump
    Andrey Kozak
    2.4 (5)
    Forex Gump is a fully finished semi-automatic trading system. In the form of arrows, signals are displayed on the screen for opening and closing deals. All you need is to follow the instructions of the indicator. When the indicator shows a blue arrow, you need to open a buy order. When the indicator shows a red arrow, you need to open a sell order. Close orders when the indicator draws a yellow cross. In order to get the most effective result, we recommend using the timeframes H1, H4, D1. There
    Magical Arrow
    Ranguni Abdulsamir Abdulmajid
    Magical Arrow Indicator – Clear & Reliable Signals The Magical Arrow Indicator is a non-repainting, trend-following tool that gives you crystal-clear Buy and Sell signals . It  high-probability reversals and entries . No more guesswork – just follow the arrows on your chart! The Magical Arrow Indicator is a powerful, easy-to-use trading tool that helps you catch the most profitable Buy and Sell opportunities in the Forex market. It is designed for beginners and professional traders , giving y
    Trend PA
    Mikhail Nazarenko
    5 (3)
    The Trend PA indicator uses   Price Action   and its own filtering algorithm to determine the trend. This approach helps to accurately determine entry points and the current trend on any timeframe. The indicator uses its own algorithm for analyzing price changes and Price Action. Which gives you the advantage of recognizing, without delay, a new nascent trend with fewer false positives. Trend filtering conditions can be selected in the settings individually for your trading style. The indicator
    Chart Patterns Detect 15 patterns (Ascending Triangle, Descending Triangle, Rising Wedge, Falling Wedge, Bullish Flag, Bearish Flag, Bullish Rectangle, Bearish Rectangle Symmetrical triangle, Head and Shoulders, Inverted Head and Shoulders, Triple top, Triple Bottom, Double Top, Double Bottom) Use historical data to calculate the probability of each pattern to succeed (possibility to filter notification according to the chance of success) gives graphic indication about the invalidation level and
    "The trend is your friend" is one of the best known sayings in investing, because capturing large trendy price movements can be extremely profitable. However, trading with the trend is often easier said than done, because many indicators are based on price reversals not trends. These aren't very effective at identifying trendy periods, or predicting whether trends will continue. We developed the Trendiness Index to help address this problem by indicating the strength and direction of price trend
    Scalping Modulator is a scalping trading system. The indicator consists of several analytical modules. It automatically analyzes the market and shows the trader all the necessary information for trading. Scalping Modulator draws two trend lines on the chart. One line shows the long-term direction of the price, the second line shows the medium-term direction of the price. The indicator also draws red and blue dots on the chart. They indicate a likely change in price movement. In order to open a
    The Riko Trend indicator is a revolutionary trend trading and filtering solution with all the important features of a trend tool built into one tool! The Riko Trend indicator is good for any trader, suitable for any trader for both forex and binary options. You don’t need to configure anything, everything is perfected by time and experience, it works great during a flat and in a trend. The Riko Trend indicator is a technical analysis tool for financial markets that reflects the current price f
    This multi time frame and multi symbol indicator alerts about Heiken Ashi Smoothed color changes. As a bonus it can also scan for Hull Moving Average trend (color) changes. Combined with your own rules and techniques, this indicator will allow you to create (or enhance) your own powerful trading system. Features Can monitor all symbols visible in your Market Watch window at the same time. Apply the indicator to just one chart and instantly monitor the entire market. Can monitor every time frame,
    QuantumEdge Trader v1.0 AI-Powered Precision Signals for Serious Traders QuantumEdge Trader is a smart and reliable indicator that delivers accurate BUY and SELL signals using advanced market analysis and trend detection. Designed for M1 to M60 timeframes, it's ideal for scalping and intraday strategies. --- Key Features: No Repaint – Signals never change after appearing Smart trend filters to reduce noise Adjustable sensitivity and alerts Perfect for XAUUSD, EURUSD, and m
    Indicator for binary options arrow is easy to use and does not require configuration works on all currency pairs, cryptocurrencies buy signal blue up arrow sell signal red down arrow tips do not trade during news and 15-30 minutes before their release, as the market is too volatile and there is a lot of noise it is worth entering trades one or two candles from the current period (recommended for 1 candle) timeframe up to m 15 recommended money management fixed lot or fixed percentage of the depo
    このプロダクトを購入した人は以下も購入しています
    Precautions for subscribing to indicator This indicator only supports the computer version of MT4 Does not support MT5, mobile phones, tablets The indicator only shows the day's entry arrow The previous history arrow will not be displayed (Live broadcast is for demonstration) The indicator is a trading aid Is not a EA automatic trading No copy trading function The indicator only indicates the entry position No exit (target profit)  The entry stop loss point is set at 30-50 PIPS Or the front hi
    Miraculous Indicator – ガン・スクエア・オブ・ナインに基づく100%非リペイントのFXおよびバイナリーツール この動画では、FXおよびバイナリーオプションのトレーダー向けに特別に開発された、非常に正確で強力な取引ツールである Miraculous Indicator を紹介しています。このインジケーターがユニークなのは、伝説的な ガン・スクエア・オブ・ナイン と ガンの振動の法則 に基づいている点で、現代の取引で利用できる最も正確な予測ツールの一つとなっています。 Miraculous Indicatorは 完全に非リペイント であり、ローソク足が確定した後にシグナルが変化したり消えたりすることはありません。つまり、見たものがそのまま利用できます。これにより、トレーダーは自信を持ってエントリーおよびエグジットを行うための信頼性と一貫性のある根拠を得ることができます。 主な特徴: ガン・スクエア・オブ・ナインとガン理論に基づいて構築 100%非リペイントのシグナルシステム すべての時間枠(M1、M5、H1、H4、日足、週足)で機能 FXおよびバイナリーオプション取引
    Volatility Trend System - a trading system that gives signals for entries. The volatility system gives linear and point signals in the direction of the trend, as well as signals to exit it, without redrawing and delays. The trend indicator monitors the direction of the medium-term trend, shows the direction and its change. The signal indicator is based on changes in volatility and shows market entries. The indicator is equipped with several types of alerts. Can be applied to various trading ins
    現在40%OFF! 初心者やエキスパートトレーダーのためのベストソリューション! このダッシュボードソフトウェアは、28の通貨ペアで動作しています。それは私達の主要な指標(高度な通貨の強さ28と高度な通貨インパルス)の2に基づいています。それは全体の外国為替市場の大きい概観を与えます。それは、すべての(9)時間枠で28の外国為替ペアのための高度な通貨の強さの値、通貨の動きの速度と信号を示しています。チャート上で1つのインディケータを使用して市場全体を観察し、トレンドやスキャルピングの機会をピンポイントで見つけることができたら、あなたのトレードがどのように改善されるか想像してみてください。 このインディケータには、強い通貨と弱い通貨の識別、潜在的な取引の識別と確認がより簡単になるような機能が搭載されています。このインディケータは、通貨の強さや弱さが増加しているか減少しているか、また、すべての時間枠でどのように機能しているかをグラフィカルに表示します。 新機能として、現在の市場環境の変化に適応するダイナミックなマーケットフィボナッチレベルが追加され、すでに当社のAdvanced
    Looking for a powerful yet lightweight swing detector that accurately identifies market structure turning points? Want clear, reliable buy and sell signals that work across any timeframe and any instrument? Buy Sell Arrow MT Swing is built exactly for that — precision swing detection made simple and effective. This indicator identifies Higher Highs (HH) , Higher Lows (HL) , Lower Highs (LH) , and Lower Lows (LL) with remarkable clarity. It is designed to help traders easily visualize market str
    An exclusive indicator that utilizes an innovative algorithm to swiftly and accurately determine the market trend. The indicator automatically calculates opening, closing, and profit levels, providing detailed trading statistics. With these features, you can choose the most appropriate trading instrument for the current market conditions. Additionally, you can easily integrate your own arrow indicators into Scalper Inside Pro to quickly evaluate their statistics and profitability. Scalper Inside
    "Dragon's Tail" is an integrated trading system, not just an indicator. This system analyzes each candle on a minute-by-minute basis, which is particularly effective in high market volatility conditions. The "Dragon's Tail" system identifies key market moments referred to as "bull and bear battles". Based on these "battles", the system gives trade direction recommendations. In the case of an arrow appearing on the chart, this signals the possibility of opening two trades in the indicated directi
    Super Signal – Skyblade Edition プロ仕様のノンリペイント / ノーラグ・トレンドシグナルシステム。卓越した勝率を実現 | MT4 / MT5 対応 1分足、5分足、15分足などの低い時間足で最も効果を発揮します。 主な特徴: Super Signal – Skyblade Edition は、トレンド取引に特化したスマートなシグナルシステムです。マルチレイヤーのフィルターロジックを用いて、明確な方向性と実際のモメンタムに支えられた強力なトレンドのみを検出します。 このシステムは 天井や底を予測するものではありません 。次の3つの条件がすべて満たされた場合にのみシグナルを発生させます: 明確なトレンド方向 モメンタムの増加 健全なボラティリティ構造 市場セッションに基づく流動性分析と組み合わせることで、シグナルの精度とタイミングがさらに向上します。 シグナルの特性: すべての矢印シグナルは 100% 非リペイント / 遅延なし 一度出現したシグナルは固定され、点滅・消失しません チャート上の矢印、情報パネル、ポップアップ通知、音声アラート、プッシュ通知
    Pulse Scalping Line - an indicator for identifying potential pivot points. Based on this indicator, you can build an effective Martingale system. According to our statistics, the indicator gives a maximum of 4 erroneous pivot points in a series. On average, these are 2 pivot points. That is, the indicator shows a reversal, it is erroneous. This means that the second signal of the indicator will be highly accurate. Based on this information, you can build a trading system based on the Martingale
    MetaForecast M4
    Vahidreza Heidar Gholami
    5 (2)
    MetaForecastは、価格データのハーモニクスに基づいて、どんな市場の未来を予測し視覚化します。市場が常に予測可能ではありませんが、価格にパターンがある場合、MetaForecastは可能な限り正確な未来を予測できます。他の類似製品と比較して、MetaForecastは市場のトレンドを分析することでより正確な結果を生成することができます。 入力パラメータ Past size (過去のサイズ) MetaForecastが将来の予測を生成するために使用するバーの数を指定します。モデルは選択したバー上に描かれた黄色の線で表されます。 Future size (将来のサイズ) 予測すべき将来のバーの数を指定します。予測された将来は、ピンクの線で表示され、その上に青い回帰線が描かれます。 Degree (程度) この入力は、MetaForecastが市場で行う分析のレベルを決定します。 Degree 説明  0 Degree 0の場合、価格の全てのピークや谷、そして詳細をカバーするために、「Past size」の入力に大きな値を使用することが推奨されています。  1 (推奨) Degre
    チャートを構成し、周期的な価格変動を識別するテクニカル指標。 どのチャートでも動作します。 いくつかの種類の通知。 グラフ自体に追加の矢印があります。 履歴を再描画せずに、キャンドルのクローズに取り組みます。 M5以上のTFを推奨します。 パラメータの使用と設定が簡単です。 異なるパラメータを持つ 2 つのインジケーターを使用する場合、他のインジケーターなしで使用できます。 入力パラメータは2つあります 周期性と信号持続時間 これら 2 つのパラメータは、チャート構造の処理を扱います。 Cyclicity - 反転サイクルが変化する頻度を調整し、サイクルを滑らかにします。 Signal duration - 最小数では価格変動の衝動を検出し、最大数では長期的なトレンドの動きを検出します。
    まず第一に、この取引インジケーターは再描画されず、再描画されず、遅延しないことを強調する価値があります。これにより、手動取引とロボット取引の両方に理想的なものになります。 ユーザーマニュアル:設定、入力、戦略。 アトミックアナリストは、価格の強さとモメンタムを利用して市場でより良いエッジを見つけるためのPA価格アクションインジケーターです。ノイズや誤ったシグナルを除去し、取引ポテンシャルを高めるための高度なフィルターを備えています。複雑なインジケーターの複数のレイヤーを使用して、アトミックアナリストはチャートをスキャンし、複雑な数学的計算をシンプルなシグナルと色に変換します。これにより、どのような初心者トレーダーでも理解して使用し、一貫した取引の決定を行うことができます。 「アトミックアナリスト」は、新規および経験豊富なトレーダー向けにカスタマイズされた包括的な取引ソリューションです。プレミアムインジケーターとトップノッチの機能を1つの取引戦略に組み合わせ、すべてのタイプのトレーダーにとって汎用性のある選択肢にします。 デイリートレーディングとスキャルピング戦略:高速で正確な
    Introducing a powerful, precision-engineered indicator that seamlessly combines Pivot Points, Moving Averages, and Multi-Timeframe Analysis to deliver high-probability Buy and Sell signals in real-time. This tool is your strategic edge, designed to identify trend reversals, market momentum, and optimal trade entries, no matter your preferred trading style. Our algorithm goes beyond standard indicators—by analyzing multiple timeframes simultaneously, it spots true market turning points while fi
    このインジケーターは、反転ポイントと価格戻りゾーンを正確に表示します。     主要プレーヤー 。新たなトレンドが形成される場所を把握し、最大限の精度で意思決定を行い、すべての取引をコントロールします。 TREND LINES PRO インジケーターと組み合わせることで、その潜在能力を最大限に発揮します。 VERSION MT5 インジケーターが示す内容: 新しいトレンドの始まりに活性化する反転構造と反転レベル。 リスクと報酬の比率を最小限に抑えた利益 確定 と 損失停止の レベルの表示     RR 1:2   。 インテリジェントな削減ロジックによるストップロス。 指定されたインジケーターから 2 つのトレンド タイプの反転パターンを表示します。 指標: トレンドを追う   TREND LINES PRO   (世界的なトレンドの変化) TREND PRO   (クイックトレンド変更) シンプルで効果的   スキャナー   リアルタイムトレンド(新機能)。 マルチタイムフレームのインストゥルメント フィルタリング。 画面   利益     LOGIC AI信号の後。 当日プラス方
    Meravith
    Ivan Stefanov
    5 (3)
    マーケットメーカーのためのツール。 Meravith は次の機能を提供します: すべての時間足を分析し、現在有効なトレンドを表示します。 強気と弱気の出来高が等しくなる流動性ゾーン(出来高均衡)を強調表示します。 異なる時間足のすべての流動性レベルをチャート上に直接表示します。 テキスト形式の市場分析を生成し、参考情報として表示します。 現在のトレンドに基づいて目標値、サポートレベル、ストップロスを計算します。 取引のリスクリワード比を算出します。 口座残高に基づいてポジションサイズを計算し、潜在的な利益を推定します。 また、市場に大きな変化があった場合には警告を表示します。 インジケーターの主要ライン: 強気/弱気の出来高エグゾーストライン ― 目標値として機能します。 市場のトレンドを示すライン。市場が強気か弱気かによって色が変わり、トレンドのサポートとして機能します。主にその色が市場センチメントを示します。 出来高均衡ライン(Eq)。Eq(Volume Equilibrium)ラインはシステムの中核です。これは買い手と売り手の出来高のバランスポイントを表します。市場の流動性を示し
    このインジケーターを購入すると、プロ仕様のトレードマネージャーを無料で差し上げます。 まず第一に、このトレーディングシステムがノンリペイント、ノンリドロー、ノンラグのインジケーターであることを強調する価値がある。これにより、手動取引とロボット取引の両方に理想的なものになっています。 オンラインコース、マニュアル、プリセットのダウンロード。 「スマートトレンドトレーディングシステム MT5」は、新規および経験豊富なトレーダー向けにカスタマイズされた包括的なトレーディングソリューションです。10以上のプレミアムインジケーターを組み合わせ、7つ以上の堅実なトレーディング戦略を備えており、多様な市場状況に対応する多目的な選択肢となっています。 トレンドフォロー戦略:トレンドを効果的に乗り越えるための正確なエントリーとストップロス管理を提供します。 リバーサル戦略:潜在的なトレンドの反転を特定し、トレーダーがレンジ相場を活用できるようにします。 スキャルピング戦略:高速で正確なデイトレードおよび短期取引のために設計されています。 安定性:すべてのインジケーターはノンリペイント、ノンリドロー、ノ
    シンプルでありながら効果的なポジション取引戦略であるオーダーブロックの個人的な実装。価格範囲がブレイクアウトの反対方向に違反されていない場合、トレーダーは市場に参入するか、最後の注文ブロックの方向で取引を探す必要があります。わかりやすくするために、開いたブロックは描かれていません。 【 インストールガイド】 アップデートガイド | トラブルシューティング | FAQ | すべての製品 ] 強気のオープンブロックは、新鮮な市場の安値の後の最初の強気のバーです 弱気のオープンブロックは、新鮮な市場の高値の後の最初の弱気のバーです 開いているブロックが壊れるとシグナルが表示され、オーダーブロックになります オーダーブロックが反対側に折れると、反転ブロックになります インジケーターはすべての種類のアラートを実装します 塗り直しや裏塗りはしません 入力パラメータ 期間:新鮮な高値または安値を作成するために必要なバーの量。値が小さいほど、信号が多くなります。 最小ATRフィルター:ATRの乗数として表される、オーダーブロックバーの最小ボディサイズ。 最大ATRフィルター:ATRの乗数として表さ
    Trend Screener
    STE S.S.COMPANY
    4.79 (95)
    トレンドインジケーター、1つのツールに組み込まれたすべての重要なトレンド機能を備えたトレンドトレーディングとフィルタリングのための画期的なユニークなソリューション! これは、すべてのシンボル/商品(外国為替、商品、暗号通貨、インデックス、株式)で使用できる100%再描画されていないマルチタイムフレームおよびマルチ通貨インジケーターです。 期間限定オファー: サポートおよびレジスタンス スクリーナー インジケーターは、たった 50 ドルで永久的にご利用いただけます。(元の価格 250 ドル) (オファー延長) トレンドスクリーナーは、チャート内のドットで矢印トレンドシグナルを提供するインジケーターに続く効率的なインジケーターです。 トレンド分析インジケーターで使用できる機能: 1.トレンドスキャナー。 2.最大利益分析を備えたトレンドライン。 3.トレンド通貨強度メーター。 4.アラート付きのトレンド反転ドット。 5.アラート付きの強いトレンドドット。 6.トレンド矢印 毎日の分析例、毎日のシグナルパフォーマンス...など、トレンドスクリーナーインジケーターを使用して、ここで見つけること
    3つの移動平均クロス戦略に基づいて、統計アローはチャート上に描かれたtpとslのポイントで買いと売りのシグナルを与えます。勝率と接近した取引の数、勝った取引の数、勝った取引の数を示すバックテストダッシュボードが付属しています。損失が発生し、最終的に利益が得られた場合、インジケーターは BAR OPEN の tp および sl の横に矢印を印刷し、プレアラートを表示します。 ================================================================================================== パラメータは設定のスクリーンショットに表示され、説明されています。
    ゴールドラッシュ・トレンド・アロー・シグナル ゴールドラッシュ・トレンド・アロー・シグナル 指標は、XAU/USDにおける高速・短期スキャルパー向けに最適化された、正確でリアルタイムのトレンド分析を提供します。 1分足専用に設計されたこのツールは、明確なエントリーポイントを示す方向矢印を表示し、スキャルパーが変動の激しい市場状況でも自信を持って取引できるよう支援します。 この指標は、PRIMARY(主要)とSECONDARY(補助)のアラート矢印で構成されています。PRIMARYシグナルは、トレンドの方向転換を示す白と黒の方向矢印であり、SECONDARYシグナルは、PRIMARY矢印が示す方向を確認し、潜在的なエントリーポイントを示す青と赤の矢印です。 注意:トレンド方向の変化後にPRIMARYアラート矢印が1つだけ表示される場合、複数のSECONDARY青/赤矢印が表示される点に注意が必要です。SECONDARYシグナルは、シグナル基準を満たす任意のローソク足後に表示されます。したがって、長期的なトレンド移動の場合、画面に多くのSECONDARY矢印が表示されます(添付の
    Presenting one-of-a-kind Gann Indicator for XAUUSD IQ Gold Gann Levels is a non-repainting, precision tool designed exclusively for XAUUSD/Gold intraday trading. It uses W.D. Gann’s square root method to plot real-time support and resistance levels, helping traders spot high-probability entries with confidence and clarity. William Delbert Gann (W.D. Gann) was an exceptional market analyst whose trading technique was based on a complex blend of mathematics, geometry, astrology, and ancient calcul
    説明書(ロシア語)  /  説明書 (英語)  /  バージョン MT5 主な機能: 売り手と買い手のアクティブなゾーンを表示します。 このインジケーターは、買いと売りの適切な最初のインパルスレベル/ゾーンをすべて表示します。これらのレベル/ゾーンがアクティブになると、エントリーポイントの探索が始まり、レベルの色が変わり、特定の色で塗りつぶされます。状況をより直感的に把握できるように、矢印も表示されます。 LOGIC AI - テンプレートをアクティブ化するときにエントリポイントを検索するためのゾーン(円)の表示 視認性を向上させるため、人工知能を用いて進入ポイントを探索したゾーンを表示する機能が追加されました。 より高い時間枠からのレベル/ゾーンの表示(MTFモード) より長い時間間隔でレベル/ゾーンを表示する機能を追加しました。また、インジケーターに自動トレンド検出機能(   TPSproTREND PRO   )を実装しました。 取引のための個別の専門的なステップバイステップのアルゴリズム このアルゴリズムは、トレンドの方向と逆方向の両方でデイトレードを行うために設計されていま
    Dynamic Forex28 Navigator - 次世代の Forex 取引ツール。 現在 49% オフ。 Dynamic Forex28 Navigator は、長年人気のインジケーターを進化させたもので、3 つの機能を 1 つにまとめています。 Advanced Currency Strength28 インジケーター (レビュー 695 件)  + Advanced Currency IMPULSE with ALERT (レビュー 520 件) + CS28 コンボ シグナル (ボーナス)。 インジケーターの詳細 https://www.mql5.com/en/blogs/post/758844 次世代の Strength インジケーターが提供するもの  オリジナルで気に入っていたすべての機能が、新機能と精度の向上によって強化されました。 主な機能: 独自の通貨強度計算式。 すべての時間枠でスムーズかつ正確な強度ライン。 トレンドの特定と正確なエントリーに最適です。 ダイナミックマーケットフィボナッチレベル (マーケットフィボナッチ)。 このインジケーターに固有
    このダッシュボードは、選択されたシンボルの最新の利用可能なハーモニックパターンを表示するので、時間を節約し、より効率的に / MT5バージョン 。 無料インジケーター: Basic Harmonic Pattern インジケーター列 Symbol : 選択したシンボルが表示されます。 Trend : 強気または弱気 Pattern : パターンの種類(ガートレー、バタフライ、バット、カニ、サメ、サイファー、ABCD) Entry : エントリー価格 SL: ストップロス価格 TP1: 1回目の利食い価格 TP2: 2回目の利食い価格 TP3: 3回目の利食い価格 Current price : 現在値 Age (in bars):  最後に描画されたパターンの年齢 主な入力項目 Symbols: "28 Major Currency Pairs "または "Selected Symbols "から選択。 Selected Symbols: カンマで区切られた監視したいシンボル("EURUSD,GBPUSD,XAUUSD")。ブローカーがペアに接尾辞または接頭辞を付けている場合
    Scalping Lines System - は、M1-M5の時間枠で金(XAUUSD)を取引するために特別に設計されたスキャルピング取引システムです。 トレンド、ボラティリティ、買われ過ぎ/売られ過ぎの市場分析のための指標を1つのオシレーターに統合し、短期シグナルを識別します。 シグナルラインのすべての内部パラメータは事前​​に設定されています。 「トレンド波の持続時間」パラメータは、移動平均線を用いてトレンド方向の一連のシグナルの持続時間を調整し、手動で調整可能です。 このインジケーターは再描画されません。シグナルはローソク足の終値に表示されます。複数のアラートタイプが用意されています。 推奨される時間枠:M1-M5-M15。このインジケーターは元々金の取引用に設計されましたが、スプレッドが狭くボラティリティの高い資産(BTCや暗号通貨、銀、株価指数(Nasdaq 100など)のCFDなど)の取引にも適しています。 他の一部の取引商品(EURUSD、GBPUSD)では、このインジケーターはM15以上の時間枠で使用できます。 このインジケーターを取引に使用する方法 「売り」
    AI Forecast MT4
    Leonardo Antonio Camacaro Armas
    The "AI Forecast" indicator is the result of a unique experiment in which I asked an AI how to create the best indicator to anticipate the market. The AI suggested measuring the past history of the price and its reactions to different levels, and then calculating the probabilities of the price reaction in the future. With this idea, I designed with the help of another AI the "AI Forecast" indicator, which adapts to any MetaTrader chart and shows you three lines: one for entry and two for possi
    Volume Horizon is a horizontal volume indicator that allows you to observe the density of market participants' volumes across various price and time intervals. Volume histograms can be constructed based on ascending or descending market waves, as well as individual bars. This tool enables more precise determination of entry or exit points, relying on levels of maximum volumes or volume-weighted average prices (VWAP). What makes Volume Horizon unique? 1. Segmentation into ascending and descendi
    Dark Support Resistance  is an Indicator for intraday trading. This Indicator is programmed to identify  Support and Resistance Lines , providing a high level of accuracy and reliability. Key benefits Easily visible lines Only the most important levels will be displayed Automated adjustment for each timeframe and instrument Easy to use even for beginners Never repaints, never backpaints, Not Lag 100% compatible with Expert Advisor development All types of alerts available: Pop-up, Email, Push
    Gold Pointer は最高のトレンド・インジケータです。このインジケーターのユニークなアルゴリズムは、テクニカル分析および数学的分析の要素を考慮して資産価格の動きを分析し、最も収益性の高いエントリーポイントを決定し、買いまたは売り注文を発注するシグナルを出します。 最良のインジケーターシグナル: - 売り=赤のトレンドライン+赤のTFインジケーター+同じ方向に黄色のシグナル矢印。 - 買いの場合 = 青のトレンドライン + 青のTFインディケータ + 同じ方向の水色のシグナル矢印。 インジケータの利点 1. このインディケータは、高い精度でシグナルを発信する。 2. 2.シグナル(矢印)を音声(アラート&メッセージ)で確認した後、インジケータの確定シグナルは消えず、再描画されません。 3. どのブローカーのMetaTrader 4取引プラットフォームでも取引できます。 4. あらゆる資産(通貨、金属、暗号通貨、株式、指数など)を取引できます。 5. どのタイムフレームでも取引できます(M5-M15スキャルピングと取引/M30-N1中期取引/H4-D1長期取引)。 6.
    Candle Power Pro
    Thushara Dissanayake
    4.5 (8)
    その   キャンドルパワープロ   は、解読するために設計された洗練された取引ツールです。     実ボリューム圧力、ティックデータの不均衡、機関投資家の注文フローのダイナミクス   測定することにより   強気相場と弱気相場の戦い   リアルタイムでこの指標は生の   ボリュームデータを実用的な洞察に 変換し、トレーダーが   スマートマネーの動き、流動性ハンティング、そして隠れた市場心理   各価格ローソク足の裏にあるものを分析することで   買い手/売り手の取引量の割合、乖離パターン、取引量に基づく確認など 、     価格行動とボリューム分析は 、トレーダーにとって非常に貴重です。       ICT、SMC、および機関投資家向け取引手法 。 従来のボリュームインジケーターとは異なり、     キャンドルパワープロ   焦点を当てる   ティックデータの粒度は 、各ローソク足の動きが基礎となる   強気/弱気の強さ   または潜在的な   マーケットメーカーの罠、反転、またはブレイクアウトの継続を 予測します。     セッションベースの戦略(ロンドン/ニューヨークのキルゾー
    作者のその他のプロダクト
    Rsi Regression Channel
    Philip Pankaj Suthagar
    5 (2)
    In statistics, Regression Channel is a approach for modelling the relationship between a scalar response (or dependent variable) and one or more explanatory variables (or independent variables).We Applied relative strength index(rsi) values to develop regression models of various degrees in order to understand relationship between Rsi and price movement.                        Our goal is range prediction and error reduction of Price divergence , thus we use Rsi Regression
    MOVING AVERAGE BANDS / MA BANDS: This is an very simple Indicator but very powerful in identifying trend reversal.The calculation of moving Average bands consist of defining the range of bars and the multiplier we use. -To find range of n bars we used the values of moving average high and low values of n bars. -Then we used individual multiplier for individual bands. -The multiplier we defining can be based on your style say for example some needs moving average fibonacci bands or dynamic fibona
    Rsi Ma Bands
    Philip Pankaj Suthagar
    "It's not about how much you do, but how much love you put into what you do that counts."    - Mother Teresa This Indicator is build on value of Relative Strength Index and Moving average of relative strength Index. We have calculated bands with respect to Moving average of Relative strength Index. Trading strategy:   https://www.mql5.com/en/blogs/post/725691 Why use Rsi Ma Bands? Great for novice traders as well as experienced traders. Low risk entries. Doesn't repaints. No additional Indicato
    NeuroWave Scalper PRO
    Philip Pankaj Suthagar
    5 (2)
    Motivated from: A market is the story of cycles and of the human behavior that is responsible for overreactions in both directions. - Seth Klarman NeuroWave Scalper PRO  is a advanced powerful cycle algorithm which depicts the cycles of market in a effective manner.This Indicator works in trending as well as ranging market conditions. This indicator is perfect for scalp trades as well as swing trades.   NeuroWave Scalper PRO  is not just an indicator, but a trading strategy itself. It doesn't
    Citra Bot
    Philip Pankaj Suthagar
    4 (1)
    Inspired from, Time is the most important factor in determining market movements and by studying past price records you will be able to prove to yourself history does repeat and by knowing the past you can tell the future. There is a definite relation between price and time. - William Delbert Gann CITRA BOT is a Price Action/Price Pattern detection Indicator which uses historical data to validate a current pattern or profile to predict the probability of hitting future resistance or support le
    Rsi Decoder
    Philip Pankaj Suthagar
    4.5 (2)
    Introducing RSI DECODER "Time is the most important factor in determining market movements and by studying past price records you will be able to prove to yourself history does repeat and by knowing the past you can tell the future. There is a definite relation between price and time." - William Delbert Gann Caution: RSI DECODER is not a Holy Grail System. It is a tool designed to give you insight into the current market structure. Trading decisions should be made in combination with an economi
    Shark Deal Book
    Philip Pankaj Suthagar
    4 (3)
    Term  "shark"  in the business world denotes a high volume investor who just made a good investment in a highly Potential business deal.So, sharks are the ones who make the market move. In our case, if an American shark bought a Japanese company, he/she has to convert American dollars into Japanese yen to make the deal. So, the demand for the Japanese yen will increase sharply. Thus USD/JPY will go short rapidly if the deal was from the shark. Another example, In the case of forex, if fed increa
    Heiken Ashi Scanner
    Philip Pankaj Suthagar
    4.25 (4)
    Heikin-Ashi charts , developed by  Munehisa Homma  in the 1700s.  Munehisa Honma was a rice merchant from Sakata, Japan who traded in the Dojima Rice market in Osaka during the Tokugawa Shogunate. He is considered to be the father of the candlestick chart.   Th e man who invented the use of candlestick charts for finding and profiting from chart patterns.He was a billionaire trader on those days if we compared his net-worth with todays dollar . Heikin Ashi Scanner is an Multi-Currency and Multi
    Trade Extractor
    Philip Pankaj Suthagar
    5 (2)
    The AI That Puts You Ahead of the Market You're Losing Trades – And It’s Not Your Fault. The market is ruthless. You analyze charts, test strategies, follow indicators—yet profits slip through your fingers. Why? Because traditional trading forces you to guess. What if you didn’t have to? Most strategies are based on hope, not proof. You wouldn’t gamble your money in a casino, so why trade without statistical certainty? TRADE EXTRACTOR Changes Everything. This is not just an indicator. It’s
    Eurusd Decoder EA MT4
    Philip Pankaj Suthagar
    4 (1)
    EURUSD DECODER EA   is a fully automated mid-term, medium-risk expert advisor. Adaptive price pattern analysis is used to identify potential trade entries and exit. The EA does not use any unfair money management practices like grid and martingale. Each position includes a stop loss and all open positions are monitored by an advanced loss control algorithm, which decides when to close profit and when to accept loss.   Before you buy all of my product please be aware of the risks involved: 1) Pl
    The Knowledge of which Geometry aims is the knowledge of the Eternal - Plato Quant Stress Scanner is a Scientifically developed Stress detection algorithm along the geometrical lines on the price data which are quantified into Stress repulsion, fractures and clusters in a easily understandable signal form. Each signal are displayed in well-arranged with currency pairs in row-wise and timeframes in column-wise manner. Explanation of signal and plotting stress levels with trendlines are shown in
    Inspired from, Time is the most important factor in determining market movements and by studying past price records you will be able to prove to yourself history does repeat and by knowing the past you can tell the future. There is a definite relation between price and time. -William Delbert Gann   Caution:   It's not HolyGrail System, It's a tool to give you insight of current market structure. The decision to trade is made only with combination of economical understanding of underlying instru
    Owl Craft Pro
    Philip Pankaj Suthagar
    Owl Craft Pro is a powerful scalping strategy that employs a smart entry and exit algorithm as well as sophisticated filtering algorithms to discover just the safest entry points during market calms. This approach is designed to provide long-term, consistent growth. It is a professional tool that incorporates all of the latest trading advancements. There's nothing fancy about this, no Holy Grail testing, no "risk-free martingale," just a rigid rule-based method to trading that allows you to maxi
    フィルタ:
    Mike Kleinsteuber
    151
    Mike Kleinsteuber 2021.02.17 19:53 
     

    I've been trying this for a couple of days and whilst this is not really long enough to give anything a decent try out, my initial impression is that I doubt very much if the indicator is of very much value. You trade two or three pairs that are supposedly linked in some way and you buy them all or sell them all at the same time. I've looked at the correlation figures for the pairs I've traded and there's no seeming relationship between them, so there must be something else that's being used. However, you have to make the decision to close the positions and I suspect everyone who makes money is lucky rather than anything to do with the indicator. You just wait till the overall position is positive enough to close or close at a loss as your pain threshold is reached. You can do this without an indicator telling you anything. If you wait long enough and have a big enough bank to sustain any drawdown almost any position taken at any time at all can be a winner in the end. I certainly couldn't recommend it as being of much value.

    Mihai Stanciu
    147
    Mihai Stanciu 2020.02.17 21:47 
     

    Excellent indicator, excellent support from author

    Philip Pankaj Suthagar
    6657
    開発者からの返信 Philip Pankaj Suthagar 2020.11.25 08:57
    Thanks Mihai.
    Hasan Yildirim
    912
    Hasan Yildirim 2019.11.12 12:14 
     

    I loose all my capital

    Philip Pankaj Suthagar
    6657
    開発者からの返信 Philip Pankaj Suthagar 2020.11.25 08:58
    Sorry about that. It's just an indicator and proper risk management is necessary.
    izaga3
    1970
    izaga3 2019.10.15 07:45 
     

    Not worth your money.

    Philip Pankaj Suthagar
    6657
    開発者からの返信 Philip Pankaj Suthagar 2020.11.25 08:59
    Sorry about that. Asking you to try updated versions if you're not satisfied.
    chayanin sinthuset
    159
    chayanin sinthuset 2019.09.25 12:04 
     

    Great tools.Great support.

    Philip Pankaj Suthagar
    6657
    開発者からの返信 Philip Pankaj Suthagar 2020.11.25 08:59
    Thanks chayanin.
    christian bocceda
    559
    christian bocceda 2019.09.22 15:51 
     

    ユーザーは評価に対して何もコメントを残しませんでした

    Pui Man Wong
    381
    Pui Man Wong 2019.07.07 03:40 
     

    4 weeks testing, the indicator + EA were great, always positive, it can work on large investment.

    richard whittle
    1089
    richard whittle 2019.06.19 12:44 
     

    scam.

    RK99
    2797
    RK99 2019.05.25 11:20 
     

    It's one of the best correlation trading indicator, for those who want to try or use correlation strategy trading. This is the one you need !!!

    Yas
    258
    Yas 2019.05.23 07:13 
     

    This indicator and the strategy are awesome. I've tested it on my tiny real account and was quite successful with it if you follow the rules. I'm moving to my bigger account. Thank you, Philips!

    kwglin
    357
    kwglin 2019.05.23 04:29 
     

    Great one! Great support!

    Den JH
    201
    Den JH 2019.05.11 16:41 
     

    Grate indicator, easy to use. quite accurate signal of selected currency basket price reversal.

    Himanshu Manchanda
    577
    Himanshu Manchanda 2019.05.09 05:09 
     

    AMAZING INDICATOR. 15% GAIN IN PAST 10 DAYS ON 100 USD REAL ACCOUNT.

    38% net gain from 1st may till 6 june. (lot 0.02 per 100usd). great product and author.

    Mr Thitipan Choomanee
    167
    Mr Thitipan Choomanee 2019.05.06 10:41 
     

    Keep up the good work!

    David Jimenez
    339
    David Jimenez 2019.05.05 10:56 
     

    The strategy behind the indicator is very good. It is a very professional operating technique. If you want to operate a large investment fund this is your indicator, if on the contrary you are looking for unusual returns and with great risk, look for martingale robots that will exploit your account.

    "Arbitrage Thief Index" is very professional and very safe.

    削除済み 2019.05.04 07:58 
     

    ユーザーは評価に対して何もコメントを残しませんでした

    削除済み 2019.05.02 18:54 
     

    ユーザーは評価に対して何もコメントを残しませんでした

    Viktor Kashlev
    1013
    Viktor Kashlev 2019.04.21 05:59 
     

    Great product. Great support. Follow the author's recommendations and money management. 5 stars.

    Koike san
    120
    Koike san 2019.04.19 05:35 
     

    Supreme indicator! Very nice support from author. Thanks a lot!

    Joao Flores Neto
    2184
    Joao Flores Neto 2019.04.18 04:00 
     

    A excellent indicator, it works like author said, it is amazing. I have followed his trades and all of them go to profit, incredible. Thanks.

    12
    レビューに返信